Good Life Advisors – Talking Points – Week 31
We started the year with the S&P at all-time highs. That didn’t last very long, and the Fed was quick to steal the punch bowl. Since them the S&P fell as much as 23.5% then re-gained over 600 points climbing back 16.7%.
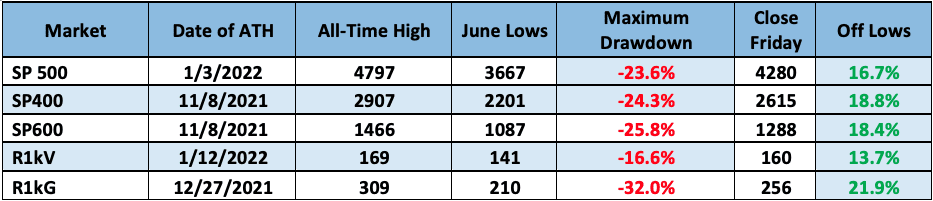

US equities posted strong gains this week, with the S&P 500 up for a fourth straight week and Nasdaq ending Friday above 13,000 for the first time since late April. The peak-inflation narrative was the key focus this week, gaining more traction after a batch of data showing softening price pressures.
July CPI was the big event for the week, coming in softer than expected with 0.0% growth m/m against estimates for 0.2%, the lowest print since May-20. July PPI also fell 0.5% m/m, the first decline since the pandemic drop in 0202, while Friday’s Michigan Consumer Sentiment saw one-year inflation expectations down 0.2pp to 5%. The latest New York Fed Survey of Consumer Expectations also saw inflation expectations fall at all time horizons, including the lowest one-year inflation outlook since February. However, analysts still had some cautious takeaways, including CPI’s further firmness in shelter prices and the potential for further cost-push inflation from tight labor market and wage increases, particularly in services.
In spite of the data, Fed officials say more work to do on inflation: the Fed highlight of the week was another batch of Fedspeak that pushed back against the peak-Fed narrative. A number of officials called for rate hikes through 2023 while Bullard called for 4% by the end of this year. A number of press articles (Bloomberg, WSJ) noted that Fed’s narrative highlights the tension between easing inflationary pressures and a still-strong economic outlook, which will likely support a tighter rate hike cycle. following the CPI print, the market odds for a 75bp September hike fell to around 25%, but rebounded to around 40%. The market is also pricing in a median peak Fed funds rate of 3.5-3.75%, up by one rate hike this week, though one rate cut still priced in by July-23 despite the rate path commentary.
Skepticism over rates, bear market bounce remain overhangs: Citi analysts this week warned of elevated recession risk, saying they expect the yield curve to continue to invert as the strength of the labor market and still-high inflation willg ive the Fed no reason to slow tightening (Bloomberg). Citi also write this week that they see their index of global sell side stock calls and back to peak billish levels last seen in 2000 and 2007, which preceded global equities falling by half, arguing that the market is near a complacency point with risk to the downside.
Earnings another worry despite Q2 outperformance: Morgan Stanley strategist Michael Wilson and Goldman Sachs strategist David Kostin both said this week they see corporate profit margins contracting next year given sticky price pressures and weakening demand. Goldman Sachs’ 2023 EPS forecast was cut to +3% from +6%. The worries come despite a better Q2 earnings season. With 92% of S&P 500 companies having reported, the blended earnings growth of 6.4% is ahead of the forecast for 4% at the end of the quarter.
Fixed Income
Yield Curve
June FOMC Statement Balance Sheet Reduction Plan Credit, Liquidity and Balance Sheet Federal Reserve Dot Plots
US Corporate Debt Tops 7 Trillion. Treasury.gov yields FOMC Policy Normalization Statement Longer Run Goals August 2020
Foreign Exchange Market
Europe travel looks really good these days as the USD/ Eur is almost level.
Energy Complex
The Baker Hughes rig count decreased by 1 this week. There are 763 oil and gas rigs operating in the US – Up 262 over last year.
Metals Complex
Employment Picture
Weekly Unemployment Claims – Released Thursday 8/11/2022 – The week ending August 6th observed an increased of 14k in initial claims increased to 262k. The four-week moving average of initial jobless claims increased 4.5k to 252k.
July Jobs Report – BLS Summary – Released 8/5/2022 – The US Economy added 528k nonfarm jobs in July and the Unemployment rate stayed declined to 3.5%. Average hourly earnings increased 15 to $32.27. Hiring highlights include +96k Leisure and Hospitality, +122k Education and Health Services, and +89 Professional and Business Services.
- Average hourly earnings increased 15 cents to $32.27.
- U3 unemployment rate remained declined 0.1% to 3.5%. U6 unemployment rate was unchanged at 6.7%.
- The labor force participation rate was little changed at 62.1%.
- Average work week was little changed at 34.6 hours.
Job Openings & Labor Turnover Survey – JOLTS – Released 8/2/2022 – The US Bureau of Labor Statistics reported the number and rate of job openings decreased to 10.7 million on the last business day of June. Over the month, hires were little changed at 6.4 million and separations were little changed at 5.9 million. Within separations, quits were little changed at 4.2 million. The layoffs and discharges were little changed at 1.3 million.
Employment Cost Index – Released 7/29/2022 – Compensation costs for civilian workers increased 1.3% for the 3-month period ending in June 2022. The 12-month period ending in June 2022 saw compensation costs increase by 5.1%. The 12-month period ending June 2021 increased 2.9%. Wages and salaries increased 5.3% over the year and increased 3.2% for the 12-month period ending in June 2021. Benefit costs increased 4.8% over the year and increased 2.2% for the 12-month period ending in June 2021. This report is published quarterly.
This Week’s Economic Data
Links take you to the data source
Producer Price Index – Released 8/11/2022 – The Producer Price Index for final demand decreased 0.5% in July. PPI less food and energy increased 0.2%. The change in PPI for final demand has increased 9.8% year/y.
Consumer Price Index – Released 8/10/2022 – Consumer prices were unchanged m/m in July following a 1.3% increase in June. Consumer prices are up 8.5% for the 12-month period ending in July. Core consumer prices increased 0.3% m/m in July.
Recent Economic Data
Links take you to the data source
Consumer Credit – Released 8/5/2022 – Consumer credit increased at a seasonally adjusted annual rate of 8.7% in the second quarter of 2022. Revolving credit increased at an annual rate of 14.6%, while nonrevolving credit increased at an annual rate of 6.9%.
U.S. Trade Balance – Released 8/4/2022 – According to the US Census Bureau of Economic Analysis, the goods and services deficit decreased in June by $5.3 billion to $79.6 billion. June exports were $260.8 billion, $4.3 billion more than May exports. June imports were $340.4 billion, $1 billion less than May imports. Year to date, the goods and services deficit increased $134.1 billion, or 33.4%, from the same period in 2021. Exports increased $246.2 billion or 20%. Imports increased $380.3 billion or 23.3%.
PMI Non-Manufacturing Index – Released 8/3/2022 – Economic activity in the non-manufacturing sector grew in July for the 26th consecutive month. ISM Non-Manufacturing registered 56.7%, which is 1.4 percentage points above the June reading of 55.3%.
PMI Manufacturing Index – Released 8/1/2022 – July PMI decreased 0.2% to 52.8% down from June’s reading of 53%. The New Orders Index was 48% down 1.2% from June’s reading of 49.2%. The Production Index registered 53.5%, down 1.4%.
U.S. Construction Spending – Released 8/1/2022 – Construction spending decreased 1.1% in June measuring at a seasonally adjusted annual rate of $1,762.3 billion. The June figure is 8.3% above the June 2021 estimate. Private construction spending declined 1.3$+% from the revised May estimate at $1,416.4 billion. Public construction spending was 0.5% below the revised May estimate at $345.9 billion.
US Light Vehicle Sales – Released 7/29/2022 – US light vehicle sales were at a seasonally adjusted annual rate of 13.016 million units of June.
Chicago PMI – Released 7/29/2022 – Chicago PMI decreased by 4.9 points in July to 51.1. All five of the main five indicators decreased. This reading marks the lowest reading since August 2020.
Personal Income – Released 7/29/2022 – Personal income increased $133.5 billion or 0.6% in June according to estimates released today by the Bureau of Economic Analysis. Disposable Personal Income (DPI) increased $120.4 billion or 0.7% and Personal Consumption Expenditures (PCE) increased 181.1 billion or 1.1%.
Advance Estimate of 2nd Quarter 2022 GDP – Released 7/28/2022 – Real Gross Domestic Product (GDP) decreased at an annual rate of 0.9% in the first quarter of 2022, according to the advance estimate released by the Bureau of Economic Analysis. GDP decreased 1.6% in the first quarter of 2022. Two quarters of negative GDP growth marks a technical recession. The GDP estimate released today is based on source data that are incomplete or subject to further revision by the source agency. The decreased in real GDP reflected decreases in private inventory investment, residential fixed investment, federal government spending, state and local government spending, and nonresidential fixed investment that were partly offset by increased in exports and Personal Consumption Expenditures (PCE). Imports, which are a subtraction in the calculation of GDP, increased.
Durable Goods – Released 7/27/2022 – New orders for manufactured durable goods in June increased $5 billion or 1.9% to $272.6 billion. Transportation equipment led the increased up $4.5 billion or 5.1% to $92.7 billion.
Consumer Confidence – Released 7/26/2022 – The consumer confidence index decreased in July following a decline in June. The index now stands at 95.7, down from 98.4 in June.
New Residential Sales – Released 7/26/2022 – Sales of new single-family homes decreased 8.1% to 590k, seasonally adjusted, in June. The median sales price of new homes sold in June was $402,400 with an average sales price of $456,800. At the end of June, the seasonally adjusted estimate of new homes for sale was 4457k. This represents a supply of 9.3 months at the current sales rate.
Existing Home Sales – Released 7/20/2022 – Existing home sales decreased in June, marking five consecutive months of declines. Sales declined 5.4% to a seasonally adjusted rate of 5.12 million in June. Sales decreased 14.2% year-over-year. Housing inventory sits at 1.26 million units, up 9.6% from May’s inventor and up 2.4% over last year. Unsold inventory sits at a 3-month supply. The median existing home price for all housing types was $416,000, which is up 13.4% from June 2021. This marks 124 consecutive months of year-over-year increases, the longest running streak on record.
Housing Starts – Released 7/19/2022 – New home starts in June were at a seasonally adjusted annual rate of 1.559 million; down 2% below May and 6.3% below last June’s rate. Building permits were at a seasonally adjusted annual rate of 1.685 million, down 0.6% compared to May, but up 1.4% over last year.
Industrial Production and Capacity Utilization – Released 7/15/2022 – In June, industrial production decreased 0.2%. Manufacturing decreased 0.5%. Utilities output decreased 1.4%. Mining output increased 1.7%. Total industrial production was 4.2% higher in June than a year ago. Total capacity utilization increased to 80% in June, which is 0.4% below its long run average.
Retail Sales – Released 7/15/2022 – US retail sales for June increased 1% to $680.6 billion and retail sales are 8.4% above June 2021. US retail sales for the April 2022 through June 2022 period were up 8.1% from the same period a year ago.
Next week we get data on Retail Sales, Industrial Production and Capacity Utilization, Housing Starts and Existing Home Sales.
Data Sources:
Bureau of Economic Analysis (BEA)
Congressional Budget Office (CBO)
U.S. Bureau of Labor Statistics (BLS)
Federal Reserve Economic Data (FRED Charts)
CME Fed Watch
U.S. Treasury – Yields
U.S. Census Bureau
Institute for Supply Management (ISM)
Weekly DOL Employment Data
BLS Monthly Jobs Report
JOLTS
US Energy Admin (EIA)
BLS Consumer Price Index CPI
BLS Producer Price Index PPI
Atlanta Fed GDPNOW
NY Fed Nowcast GDP
US Census Bureau Housing Starts
Consumer Credit
USCB Retail Sales
Construction Spending
Federal Reserve Dot Plots
NY Empire Index
Philadelphia Federal Reserve
P/E Ratio Data -Yardeni Research
Technical Analysis Info:
StockCharts.com – Financial Charts
Exponential vs Simple moving average
Other Links:
1973 Arab Oil Embargo
Hunt Brothers Silver
Long-Term Capital bailout


Week 31 Talking Points
Table of Contents
Good Life Advisors – Talking Points – Week 31
We started the year with the S&P at all-time highs. That didn’t last very long, and the Fed was quick to steal the punch bowl. Since them the S&P fell as much as 23.5% then re-gained over 600 points climbing back 16.7%.
US equities posted strong gains this week, with the S&P 500 up for a fourth straight week and Nasdaq ending Friday above 13,000 for the first time since late April. The peak-inflation narrative was the key focus this week, gaining more traction after a batch of data showing softening price pressures.
July CPI was the big event for the week, coming in softer than expected with 0.0% growth m/m against estimates for 0.2%, the lowest print since May-20. July PPI also fell 0.5% m/m, the first decline since the pandemic drop in 0202, while Friday’s Michigan Consumer Sentiment saw one-year inflation expectations down 0.2pp to 5%. The latest New York Fed Survey of Consumer Expectations also saw inflation expectations fall at all time horizons, including the lowest one-year inflation outlook since February. However, analysts still had some cautious takeaways, including CPI’s further firmness in shelter prices and the potential for further cost-push inflation from tight labor market and wage increases, particularly in services.
In spite of the data, Fed officials say more work to do on inflation: the Fed highlight of the week was another batch of Fedspeak that pushed back against the peak-Fed narrative. A number of officials called for rate hikes through 2023 while Bullard called for 4% by the end of this year. A number of press articles (Bloomberg, WSJ) noted that Fed’s narrative highlights the tension between easing inflationary pressures and a still-strong economic outlook, which will likely support a tighter rate hike cycle. following the CPI print, the market odds for a 75bp September hike fell to around 25%, but rebounded to around 40%. The market is also pricing in a median peak Fed funds rate of 3.5-3.75%, up by one rate hike this week, though one rate cut still priced in by July-23 despite the rate path commentary.
Skepticism over rates, bear market bounce remain overhangs: Citi analysts this week warned of elevated recession risk, saying they expect the yield curve to continue to invert as the strength of the labor market and still-high inflation willg ive the Fed no reason to slow tightening (Bloomberg). Citi also write this week that they see their index of global sell side stock calls and back to peak billish levels last seen in 2000 and 2007, which preceded global equities falling by half, arguing that the market is near a complacency point with risk to the downside.
Earnings another worry despite Q2 outperformance: Morgan Stanley strategist Michael Wilson and Goldman Sachs strategist David Kostin both said this week they see corporate profit margins contracting next year given sticky price pressures and weakening demand. Goldman Sachs’ 2023 EPS forecast was cut to +3% from +6%. The worries come despite a better Q2 earnings season. With 92% of S&P 500 companies having reported, the blended earnings growth of 6.4% is ahead of the forecast for 4% at the end of the quarter.
Fixed Income
Yield Curve
June FOMC Statement Balance Sheet Reduction Plan Credit, Liquidity and Balance Sheet Federal Reserve Dot Plots
US Corporate Debt Tops 7 Trillion. Treasury.gov yields FOMC Policy Normalization Statement Longer Run Goals August 2020
Foreign Exchange Market
Europe travel looks really good these days as the USD/ Eur is almost level.
Energy Complex
The Baker Hughes rig count decreased by 1 this week. There are 763 oil and gas rigs operating in the US – Up 262 over last year.
Metals Complex
Employment Picture
Weekly Unemployment Claims – Released Thursday 8/11/2022 – The week ending August 6th observed an increased of 14k in initial claims increased to 262k. The four-week moving average of initial jobless claims increased 4.5k to 252k.
July Jobs Report – BLS Summary – Released 8/5/2022 – The US Economy added 528k nonfarm jobs in July and the Unemployment rate stayed declined to 3.5%. Average hourly earnings increased 15 to $32.27. Hiring highlights include +96k Leisure and Hospitality, +122k Education and Health Services, and +89 Professional and Business Services.
Job Openings & Labor Turnover Survey – JOLTS – Released 8/2/2022 – The US Bureau of Labor Statistics reported the number and rate of job openings decreased to 10.7 million on the last business day of June. Over the month, hires were little changed at 6.4 million and separations were little changed at 5.9 million. Within separations, quits were little changed at 4.2 million. The layoffs and discharges were little changed at 1.3 million.
Employment Cost Index – Released 7/29/2022 – Compensation costs for civilian workers increased 1.3% for the 3-month period ending in June 2022. The 12-month period ending in June 2022 saw compensation costs increase by 5.1%. The 12-month period ending June 2021 increased 2.9%. Wages and salaries increased 5.3% over the year and increased 3.2% for the 12-month period ending in June 2021. Benefit costs increased 4.8% over the year and increased 2.2% for the 12-month period ending in June 2021. This report is published quarterly.
This Week’s Economic Data
Links take you to the data source
Producer Price Index – Released 8/11/2022 – The Producer Price Index for final demand decreased 0.5% in July. PPI less food and energy increased 0.2%. The change in PPI for final demand has increased 9.8% year/y.
Consumer Price Index – Released 8/10/2022 – Consumer prices were unchanged m/m in July following a 1.3% increase in June. Consumer prices are up 8.5% for the 12-month period ending in July. Core consumer prices increased 0.3% m/m in July.
Recent Economic Data
Links take you to the data source
Consumer Credit – Released 8/5/2022 – Consumer credit increased at a seasonally adjusted annual rate of 8.7% in the second quarter of 2022. Revolving credit increased at an annual rate of 14.6%, while nonrevolving credit increased at an annual rate of 6.9%.
U.S. Trade Balance – Released 8/4/2022 – According to the US Census Bureau of Economic Analysis, the goods and services deficit decreased in June by $5.3 billion to $79.6 billion. June exports were $260.8 billion, $4.3 billion more than May exports. June imports were $340.4 billion, $1 billion less than May imports. Year to date, the goods and services deficit increased $134.1 billion, or 33.4%, from the same period in 2021. Exports increased $246.2 billion or 20%. Imports increased $380.3 billion or 23.3%.
PMI Non-Manufacturing Index – Released 8/3/2022 – Economic activity in the non-manufacturing sector grew in July for the 26th consecutive month. ISM Non-Manufacturing registered 56.7%, which is 1.4 percentage points above the June reading of 55.3%.
PMI Manufacturing Index – Released 8/1/2022 – July PMI decreased 0.2% to 52.8% down from June’s reading of 53%. The New Orders Index was 48% down 1.2% from June’s reading of 49.2%. The Production Index registered 53.5%, down 1.4%.
U.S. Construction Spending – Released 8/1/2022 – Construction spending decreased 1.1% in June measuring at a seasonally adjusted annual rate of $1,762.3 billion. The June figure is 8.3% above the June 2021 estimate. Private construction spending declined 1.3$+% from the revised May estimate at $1,416.4 billion. Public construction spending was 0.5% below the revised May estimate at $345.9 billion.
US Light Vehicle Sales – Released 7/29/2022 – US light vehicle sales were at a seasonally adjusted annual rate of 13.016 million units of June.
Chicago PMI – Released 7/29/2022 – Chicago PMI decreased by 4.9 points in July to 51.1. All five of the main five indicators decreased. This reading marks the lowest reading since August 2020.
Personal Income – Released 7/29/2022 – Personal income increased $133.5 billion or 0.6% in June according to estimates released today by the Bureau of Economic Analysis. Disposable Personal Income (DPI) increased $120.4 billion or 0.7% and Personal Consumption Expenditures (PCE) increased 181.1 billion or 1.1%.
Advance Estimate of 2nd Quarter 2022 GDP – Released 7/28/2022 – Real Gross Domestic Product (GDP) decreased at an annual rate of 0.9% in the first quarter of 2022, according to the advance estimate released by the Bureau of Economic Analysis. GDP decreased 1.6% in the first quarter of 2022. Two quarters of negative GDP growth marks a technical recession. The GDP estimate released today is based on source data that are incomplete or subject to further revision by the source agency. The decreased in real GDP reflected decreases in private inventory investment, residential fixed investment, federal government spending, state and local government spending, and nonresidential fixed investment that were partly offset by increased in exports and Personal Consumption Expenditures (PCE). Imports, which are a subtraction in the calculation of GDP, increased.
Durable Goods – Released 7/27/2022 – New orders for manufactured durable goods in June increased $5 billion or 1.9% to $272.6 billion. Transportation equipment led the increased up $4.5 billion or 5.1% to $92.7 billion.
Consumer Confidence – Released 7/26/2022 – The consumer confidence index decreased in July following a decline in June. The index now stands at 95.7, down from 98.4 in June.
New Residential Sales – Released 7/26/2022 – Sales of new single-family homes decreased 8.1% to 590k, seasonally adjusted, in June. The median sales price of new homes sold in June was $402,400 with an average sales price of $456,800. At the end of June, the seasonally adjusted estimate of new homes for sale was 4457k. This represents a supply of 9.3 months at the current sales rate.
Existing Home Sales – Released 7/20/2022 – Existing home sales decreased in June, marking five consecutive months of declines. Sales declined 5.4% to a seasonally adjusted rate of 5.12 million in June. Sales decreased 14.2% year-over-year. Housing inventory sits at 1.26 million units, up 9.6% from May’s inventor and up 2.4% over last year. Unsold inventory sits at a 3-month supply. The median existing home price for all housing types was $416,000, which is up 13.4% from June 2021. This marks 124 consecutive months of year-over-year increases, the longest running streak on record.
Housing Starts – Released 7/19/2022 – New home starts in June were at a seasonally adjusted annual rate of 1.559 million; down 2% below May and 6.3% below last June’s rate. Building permits were at a seasonally adjusted annual rate of 1.685 million, down 0.6% compared to May, but up 1.4% over last year.
Industrial Production and Capacity Utilization – Released 7/15/2022 – In June, industrial production decreased 0.2%. Manufacturing decreased 0.5%. Utilities output decreased 1.4%. Mining output increased 1.7%. Total industrial production was 4.2% higher in June than a year ago. Total capacity utilization increased to 80% in June, which is 0.4% below its long run average.
Retail Sales – Released 7/15/2022 – US retail sales for June increased 1% to $680.6 billion and retail sales are 8.4% above June 2021. US retail sales for the April 2022 through June 2022 period were up 8.1% from the same period a year ago.
Next week we get data on Retail Sales, Industrial Production and Capacity Utilization, Housing Starts and Existing Home Sales.
Data Sources:
Bureau of Economic Analysis (BEA)
Congressional Budget Office (CBO)
U.S. Bureau of Labor Statistics (BLS)
Federal Reserve Economic Data (FRED Charts)
CME Fed Watch
U.S. Treasury – Yields
U.S. Census Bureau
Institute for Supply Management (ISM)
Weekly DOL Employment Data
BLS Monthly Jobs Report
JOLTS
US Energy Admin (EIA)
BLS Consumer Price Index CPI
BLS Producer Price Index PPI
Atlanta Fed GDPNOW
NY Fed Nowcast GDP
US Census Bureau Housing Starts
Consumer Credit
USCB Retail Sales
Construction Spending
Federal Reserve Dot Plots
NY Empire Index
Philadelphia Federal Reserve
P/E Ratio Data -Yardeni Research
Technical Analysis Info:
StockCharts.com – Financial Charts
Exponential vs Simple moving average
Other Links:
1973 Arab Oil Embargo
Hunt Brothers Silver
Long-Term Capital bailout
Categories:
Tags: