Good Life Advisors – Talking Points – Week 32
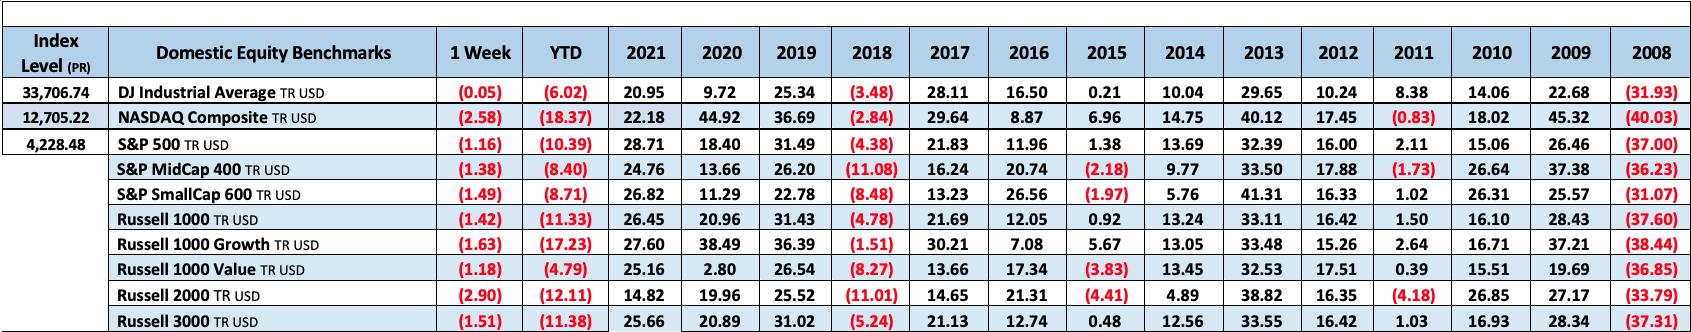
The major averages were all lower this week, with the S&P 500 and Nasdaq both down after four-straight weeks of gains. Growth a slight underperformer to value for a second-straight week. Treasuries were mostly weaker with the curve steepening; the 2Y/1-Y spread is now around -25 bp, down from more than -40 last week. Gold finished the week down 2.9%. Bitcoin futures were down over 12%. WTI crude ended the week down 1.8%, earlier falling to the lowest level since January.
One of the biggest themes this week was more Fed pushback against the dovish pivot. The July FOMC minutes reiterated the Fed’s heightened emphasis on data to determine pace of rate increased, while economist takeaways highlighted the commentary from some participants who said they believe policy would have to reach a “sufficiently restrictive” level to control inflation and remain there “for some time”. The week’s Fedspeak, including from voting members Bullard of St. Louis (WSJ) and George of Kansas City (Reuters) also echoed hawkish rhetoric, saying the Fed still has a ways to go on the rate hike cycle before it can be completely convinced inflation is coming down. Fed Chair Powell is set to speak at next week’s Jackson Hole symposium, though he is expected to repeat the latest hawkish bent of the Fed to pushback against the dovish pivot.
The week’s downside also brought some ongoing overhangs back into focus, including thoughts that recent strength has just been a bear market bounce, the potential for downward earnings revisions given a weaker macro backdrop and inflationary pressures, a strong dollar, stretched valuations, and geopolitical concerns. Bank of America analysts noted that short covering may be nearing its end, while low volumes may have exacerbated recent moves. Goldman Sachs analysts also highlighted the risks around the peak-Fed/peak-inflation themes, saying that there’s still little convincing progress so far in bringing down wages and consumer prices, which adds risk to tighter Fed policy for longer than the market is currently pricing in (CNBC).
However, though sentiment and positioning have improved in recent weeks, both remain at very low levels. This week’s AAII bullish sentiment rose 1.1 pp w/w to 33.3%, the highest since late 2021, though still below the long-term average for a 39th consecutive week. This week’s BofA Global Fund Manager Survey said that sentiment remains bearish, but no longer “apocalyptically” so (Reuters). JPMorgan analysts noted that long/short hedge fund net leverage is still only at the 31st percentile since 2017, up from 30th in mid-June. FT also noted that quant funds have closed out bearish positions taken in late 2021, adding over $100B of purchases since market low in June. JPMorgan also recently said that volatility-targeting and risk-parity funds have ramped up purchases of equities to ~$2-4B per day as the VIX has come well off recent highs. The retail results also came alongside this week’s July retail sales report which fell 0.8% m/m, missing estimates for a 0.2% increase. However, control group sales (which feed into GDP) rose 0.8% m/m, ahead of 0.4% consensus. JPMorgan analysts noted the headline figure was driven by the 1.8% decline in gasoline station sales, though the control group print shows more momentum for consumers than the Street had anticipated.
Data this week were a bit mixed, including an August Empire State Manufacturing index falling to the second lowest print on record, though the Philadelphia Fed index was the highest since April. However, both reports showed more easing of pricing pressures. Housing data was also weaker, with the August NAHB housing market index posting the lowest print since May-20, while housing starts was the slowest since Feb-21, building permits were the slowest since Sep-21, and existing home sales the slowest since Jun-20. Data next week include new home sales and August flash manufacturing and services PMIs on Tuesday and July PCE on Friday.

Fixed Income
Yield Curve
July Fed Minutes Balance Sheet Reduction Plan Credit, Liquidity and Balance Sheet Federal Reserve Dot Plots
US Corporate Debt Tops 7 Trillion. Treasury.gov yields FOMC Policy Normalization Statement Longer- Run Goals Jan 2022
Foreign Exchange Market
Europe travel looks really good these days as the USD/Eur is almost level.
Energy Complex
The Baker Hughes rig count decreased by 1 this week. There are 762 oil and gas rigs operating in the US – Up 259 over last year.
Metals Complex
Employment Picture
Weekly Unemployment Claims – Released Thursday 8/18/2022 – The week ending August 13th observed a decrease of 2k in initial claims increasing to 250k. The four-week moving average of initial jobless claims decreased 2.75k to 246.75k.
July Jobs Report – BLS Summary – Released 8/5/2022 – The US Economy added 528k nonfarm jobs in July and the Unemployment rate stayed declined to 3.5%. Average hourly earnings increased 15 to $32.27. Hiring highlights include +96k Leisure and Hospitality, +122k Education and Health Services, and +89 Professional and Business Services.
- Average hourly earnings increased 15 cents to $32.27.
- U3 unemployment rate remained declined 0.1% to 3.5%. U6 unemployment rate was unchanged at 6.7%.
- The labor force participation rate was little changed at 62.1%.
- Average work week was little changed at 34.6 hours.
Job Openings & Labor Turnover Survey – JOLTS – Released 8/2/2022 – The US Bureau of Labor Statistics reported the number and rate of job openings decreased to 10.7 million on the last business day of June. Over the month, hires were little changed at 6.4 million and separations were little changed at 5.9 million. Within separations, quits were little changed at 4.2 million. The layoffs and discharges rates were little changed at 1.3 million.
Employment Cost Index – Released 7/29/2022 – Compensation costs for civilian workers increased 1.3% for the 3-month period ending in June 2022. The 12-month period ending in June 2022 saw compensation costs increase by 5.1%. The 12-month period ending June 2021 increased 2.9%. Wages and salaries increased 5.3% over the year and increased 3.2% for the 12-month period ending in June 2021. Benefit costs increased 4.8% over the year and increased 2.2% for the 12-month period ending in June 2021. This report in published quarterly.
This Week’s Economic Data
Links take you to the data source
Existing Home Sales – Released 8/18/2022 – Existing home sales decreased in July marking six consecutive months of declines. Sales declined 5.9% to a seasonally adjusted rate of 4.81 million in July. Sales decreased 20.2% year-over-year. Housing inventory sits at 1.31 million units. Up 4.8% from June’s inventory. Unsold inventory sits at a 3.3-month supply. The median existing home price for all housing types was $403,800, which is up 10.8% from July 2021. This marks 125 consecutive months of year-over-year increases, the longest-running streak on record.
Retail Sales – Released 8/17/2022 – US retail sales for July were essentially unchanged at $682.8 billion and retail sales are 10.3% above July 2021. US retail sales for the May 2022 through July 2022 period were up 9.2% from the same period a year ago.
Housing Starts – Released 8/16/2022 – New home starts in July were at a seasonally adjusted annual rate of 1.446 million; down 9.6% below June, and 8.1% below last July’s rate. Building Permits were at a seasonally adjusted annual rate of 1.674 million, down 1.3% compared to June, but up 1.1% over last year.
Industrial Production and Capacity Utilization – Released 8/16/2022 – In June, Industrial production increased 0.6%, Manufacturing increased 0.7%, Utilities output decreased 0.8%, Mining output increased 07%, total industrial production was 3.9% higher in July than a year ago and total capacity utilization increased to 80.3% in July which is 0.7% above its long run average.
Recent Economic Data
Links take you to the data source
Producer Price Index – Released 8/11/2022 – The Producer Price Index for final demand decreased 0.5% in July. PPI less food and energy increased 0.2%. The change in PPI for final demand has increased 9.8% year/y.
Consumer Price Index – Released 8/10/2022 – Consumer prices were unchanged m/m in July following a 1.3% increase in June. Consumer prices are up 8.5% for the 12-month period ending in July. Core consumer prices increased 0.3% m/m in July.
Consumer Credit – Released 8/5/2022 – Consumer credit increased at a Seasonally Adjusted Annual Rate (SAAR) of 8.7% in the second quarter of 2022. Revolving credit increased at an annual rate of 14.6%, while nonrevolving credit increased at an annual rate of 6.9%.
US Light Vehicle Sales – Released 8/5/2022 – US light vehicle sales were at an SAAR of 13.345 million units in July.
U.S. Trade Balance – Released 8/4/2022 – According to the US Census Bureau of Economic Analysis, the goods and services deficit decreased in June by $5.3 billion to $79.6 billion. June exports were $260.8 billion, $4.3 billion more than May exports. June imports were $340.4 billion, $1 billion less than May imports. Year to date, the goods and services deficit increased $134.1 billion, or 33.4%, from the same period in 2021. Exports increased $246.2 billion, or 20%. Imports increased $380.3 billion or 23.3%.
PMI Non-Manufacturing Index – Released 8/3/2022 – Economic activity in the non-manufacturing sector grew in July for the 26th consecutive month. ISM Non-Manufacturing registered 56.7%, which is 1.4 percentage points above the June reading of 55.3%.
PMI Manufacturing Index – Released 8/1/2022 – July PMI decreased 0.2% to 52.8%, down from June’s reading of 52%. The New Orders Index was 48% down, 1.2% from June reading of 49.2%. The Production Index registered 53.5%, down 1.4%.
U.S. Construction Spending – Released 8/1/2022 – Construction spending decreased 1.1% in June, measuring at a Seasonally Adjusted Annual Rate of $1,762.3 billion. The June figure is 8.3% above the June 2021 estimate. Private construction spending declined 1.3% from the revised May estimate at $1,416.4 billion. Public construction spending was 0.5% below the revised May estimate at $345.9 billion.
Chicago PMI – Released 7/29/2022 – Chicago PMI decreased by 4.9 points in July to 51.1. All five of the main five indicators decreased. This reading marks the lowest reading since August 2020.
Personal Income – Released 7/29/2022 – Personal income increased $133.5 billion or 0.6% in June according to estimates released today by the Bureau of Economic Analysis. Disposable Personal Income (DPI) increased $120.4 billion, or 0.7% and Personal Consumption Expenditures (PCE) increased $181.1 billion, or 1.1%.
Advance Estimate of 2nd Quarter 2022 GDP – Released 7/28/2022 – Real Gross Domestic Product (GDP) decreased at an annual rate of 0.9% in the first quarter of 2022, according to the advance estimate released by the Bureau of Economic Analysis. GDP decreased 1.6% in the first quarter of 2022. Two quarters of negative GDP growth marks a technical recession. The GDP estimate released today is based on source data that are incomplete or subject to further revision by the source agency. The decrease in real GDP reflected decreases in private inventory investment, residential fixed investment, federal government spending, state and local government spending, and nonresidential fixed investment that were partly offset by increases in exports and Personal Consumption Expenditures (PCE). Imports, which are a subtraction in the calculation of GDP, increased.
Durable Goods – Released 7/27/2022 – New Orders for manufactured durable goods in June increased $5 billion or 1.9% to $272.6 billion. Transportation equipment led the increase up $4.5 billion or 5.1% to $92.7 billion.
Consumer Confidence – Released 7/26/2022 – The consumer confidence index decreased in July following a decline in June. The index now stands at 95.7, down from 98.4 in June.
New Residential Sales – Released 7/26/2022 – Sales fo new single-family homes decreased 8.1% to 590k, seasonally adjusted, in June. The median sales price of new homes sold in June was $402,400 with an average sales price of $456,800. At the end of June, the seasonally adjusted estimate of new homes for sale was 457k. This represents a supply of 9.3 months at the current sales rate.
Next week we get data on New Residential Sales, Durable Goods, the 2nd Estimate of 2nd Quarter GDP, and Personal Income.
Data Sources:
Bureau of Economic Analysis (BEA)
Congressional Budget Office (CBO)
U.S. Bureau of Labor Statistics (BLS)
Federal Reserve Economic Data (FRED Charts)
CME Fed Watch
U.S. Treasury – Yields
U.S. Census Bureau
Institute for Supply Management (ISM)
Weekly DOL Employment Data
BLS Monthly Jobs Report
JOLTS
US Energy Admin (EIA)
BLS Consumer Price Index CPI
BLS Producer Price Index PPI
Atlanta Fed GDPNOW
NY Fed Nowcast GDP
US Census Bureau Housing Starts
Consumer Credit
USCB Retail Sales
Construction Spending
Federal Reserve Dot Plots
NY Empire Index
Philadelphia Federal Reserve
P/E Ratio Data -Yardeni Research
Technical Analysis Info:
StockCharts.com – Financial Charts
Exponential vs Simple moving average
Other Links:
1973 Arab Oil Embargo
Hunt Brothers Silver
Long-Term Capital bailout


Week 32 Talking Points
Table of Contents
Good Life Advisors – Talking Points – Week 32
The major averages were all lower this week, with the S&P 500 and Nasdaq both down after four-straight weeks of gains. Growth a slight underperformer to value for a second-straight week. Treasuries were mostly weaker with the curve steepening; the 2Y/1-Y spread is now around -25 bp, down from more than -40 last week. Gold finished the week down 2.9%. Bitcoin futures were down over 12%. WTI crude ended the week down 1.8%, earlier falling to the lowest level since January.
One of the biggest themes this week was more Fed pushback against the dovish pivot. The July FOMC minutes reiterated the Fed’s heightened emphasis on data to determine pace of rate increased, while economist takeaways highlighted the commentary from some participants who said they believe policy would have to reach a “sufficiently restrictive” level to control inflation and remain there “for some time”. The week’s Fedspeak, including from voting members Bullard of St. Louis (WSJ) and George of Kansas City (Reuters) also echoed hawkish rhetoric, saying the Fed still has a ways to go on the rate hike cycle before it can be completely convinced inflation is coming down. Fed Chair Powell is set to speak at next week’s Jackson Hole symposium, though he is expected to repeat the latest hawkish bent of the Fed to pushback against the dovish pivot.
The week’s downside also brought some ongoing overhangs back into focus, including thoughts that recent strength has just been a bear market bounce, the potential for downward earnings revisions given a weaker macro backdrop and inflationary pressures, a strong dollar, stretched valuations, and geopolitical concerns. Bank of America analysts noted that short covering may be nearing its end, while low volumes may have exacerbated recent moves. Goldman Sachs analysts also highlighted the risks around the peak-Fed/peak-inflation themes, saying that there’s still little convincing progress so far in bringing down wages and consumer prices, which adds risk to tighter Fed policy for longer than the market is currently pricing in (CNBC).
However, though sentiment and positioning have improved in recent weeks, both remain at very low levels. This week’s AAII bullish sentiment rose 1.1 pp w/w to 33.3%, the highest since late 2021, though still below the long-term average for a 39th consecutive week. This week’s BofA Global Fund Manager Survey said that sentiment remains bearish, but no longer “apocalyptically” so (Reuters). JPMorgan analysts noted that long/short hedge fund net leverage is still only at the 31st percentile since 2017, up from 30th in mid-June. FT also noted that quant funds have closed out bearish positions taken in late 2021, adding over $100B of purchases since market low in June. JPMorgan also recently said that volatility-targeting and risk-parity funds have ramped up purchases of equities to ~$2-4B per day as the VIX has come well off recent highs. The retail results also came alongside this week’s July retail sales report which fell 0.8% m/m, missing estimates for a 0.2% increase. However, control group sales (which feed into GDP) rose 0.8% m/m, ahead of 0.4% consensus. JPMorgan analysts noted the headline figure was driven by the 1.8% decline in gasoline station sales, though the control group print shows more momentum for consumers than the Street had anticipated.
Data this week were a bit mixed, including an August Empire State Manufacturing index falling to the second lowest print on record, though the Philadelphia Fed index was the highest since April. However, both reports showed more easing of pricing pressures. Housing data was also weaker, with the August NAHB housing market index posting the lowest print since May-20, while housing starts was the slowest since Feb-21, building permits were the slowest since Sep-21, and existing home sales the slowest since Jun-20. Data next week include new home sales and August flash manufacturing and services PMIs on Tuesday and July PCE on Friday.
Fixed Income
Yield Curve
July Fed Minutes Balance Sheet Reduction Plan Credit, Liquidity and Balance Sheet Federal Reserve Dot Plots
US Corporate Debt Tops 7 Trillion. Treasury.gov yields FOMC Policy Normalization Statement Longer- Run Goals Jan 2022
Foreign Exchange Market
Europe travel looks really good these days as the USD/Eur is almost level.
Energy Complex
The Baker Hughes rig count decreased by 1 this week. There are 762 oil and gas rigs operating in the US – Up 259 over last year.
Metals Complex
Employment Picture
Weekly Unemployment Claims – Released Thursday 8/18/2022 – The week ending August 13th observed a decrease of 2k in initial claims increasing to 250k. The four-week moving average of initial jobless claims decreased 2.75k to 246.75k.
July Jobs Report – BLS Summary – Released 8/5/2022 – The US Economy added 528k nonfarm jobs in July and the Unemployment rate stayed declined to 3.5%. Average hourly earnings increased 15 to $32.27. Hiring highlights include +96k Leisure and Hospitality, +122k Education and Health Services, and +89 Professional and Business Services.
Job Openings & Labor Turnover Survey – JOLTS – Released 8/2/2022 – The US Bureau of Labor Statistics reported the number and rate of job openings decreased to 10.7 million on the last business day of June. Over the month, hires were little changed at 6.4 million and separations were little changed at 5.9 million. Within separations, quits were little changed at 4.2 million. The layoffs and discharges rates were little changed at 1.3 million.
Employment Cost Index – Released 7/29/2022 – Compensation costs for civilian workers increased 1.3% for the 3-month period ending in June 2022. The 12-month period ending in June 2022 saw compensation costs increase by 5.1%. The 12-month period ending June 2021 increased 2.9%. Wages and salaries increased 5.3% over the year and increased 3.2% for the 12-month period ending in June 2021. Benefit costs increased 4.8% over the year and increased 2.2% for the 12-month period ending in June 2021. This report in published quarterly.
This Week’s Economic Data
Links take you to the data source
Existing Home Sales – Released 8/18/2022 – Existing home sales decreased in July marking six consecutive months of declines. Sales declined 5.9% to a seasonally adjusted rate of 4.81 million in July. Sales decreased 20.2% year-over-year. Housing inventory sits at 1.31 million units. Up 4.8% from June’s inventory. Unsold inventory sits at a 3.3-month supply. The median existing home price for all housing types was $403,800, which is up 10.8% from July 2021. This marks 125 consecutive months of year-over-year increases, the longest-running streak on record.
Retail Sales – Released 8/17/2022 – US retail sales for July were essentially unchanged at $682.8 billion and retail sales are 10.3% above July 2021. US retail sales for the May 2022 through July 2022 period were up 9.2% from the same period a year ago.
Housing Starts – Released 8/16/2022 – New home starts in July were at a seasonally adjusted annual rate of 1.446 million; down 9.6% below June, and 8.1% below last July’s rate. Building Permits were at a seasonally adjusted annual rate of 1.674 million, down 1.3% compared to June, but up 1.1% over last year.
Industrial Production and Capacity Utilization – Released 8/16/2022 – In June, Industrial production increased 0.6%, Manufacturing increased 0.7%, Utilities output decreased 0.8%, Mining output increased 07%, total industrial production was 3.9% higher in July than a year ago and total capacity utilization increased to 80.3% in July which is 0.7% above its long run average.
Recent Economic Data
Links take you to the data source
Producer Price Index – Released 8/11/2022 – The Producer Price Index for final demand decreased 0.5% in July. PPI less food and energy increased 0.2%. The change in PPI for final demand has increased 9.8% year/y.
Consumer Price Index – Released 8/10/2022 – Consumer prices were unchanged m/m in July following a 1.3% increase in June. Consumer prices are up 8.5% for the 12-month period ending in July. Core consumer prices increased 0.3% m/m in July.
Consumer Credit – Released 8/5/2022 – Consumer credit increased at a Seasonally Adjusted Annual Rate (SAAR) of 8.7% in the second quarter of 2022. Revolving credit increased at an annual rate of 14.6%, while nonrevolving credit increased at an annual rate of 6.9%.
US Light Vehicle Sales – Released 8/5/2022 – US light vehicle sales were at an SAAR of 13.345 million units in July.
U.S. Trade Balance – Released 8/4/2022 – According to the US Census Bureau of Economic Analysis, the goods and services deficit decreased in June by $5.3 billion to $79.6 billion. June exports were $260.8 billion, $4.3 billion more than May exports. June imports were $340.4 billion, $1 billion less than May imports. Year to date, the goods and services deficit increased $134.1 billion, or 33.4%, from the same period in 2021. Exports increased $246.2 billion, or 20%. Imports increased $380.3 billion or 23.3%.
PMI Non-Manufacturing Index – Released 8/3/2022 – Economic activity in the non-manufacturing sector grew in July for the 26th consecutive month. ISM Non-Manufacturing registered 56.7%, which is 1.4 percentage points above the June reading of 55.3%.
PMI Manufacturing Index – Released 8/1/2022 – July PMI decreased 0.2% to 52.8%, down from June’s reading of 52%. The New Orders Index was 48% down, 1.2% from June reading of 49.2%. The Production Index registered 53.5%, down 1.4%.
U.S. Construction Spending – Released 8/1/2022 – Construction spending decreased 1.1% in June, measuring at a Seasonally Adjusted Annual Rate of $1,762.3 billion. The June figure is 8.3% above the June 2021 estimate. Private construction spending declined 1.3% from the revised May estimate at $1,416.4 billion. Public construction spending was 0.5% below the revised May estimate at $345.9 billion.
Chicago PMI – Released 7/29/2022 – Chicago PMI decreased by 4.9 points in July to 51.1. All five of the main five indicators decreased. This reading marks the lowest reading since August 2020.
Personal Income – Released 7/29/2022 – Personal income increased $133.5 billion or 0.6% in June according to estimates released today by the Bureau of Economic Analysis. Disposable Personal Income (DPI) increased $120.4 billion, or 0.7% and Personal Consumption Expenditures (PCE) increased $181.1 billion, or 1.1%.
Advance Estimate of 2nd Quarter 2022 GDP – Released 7/28/2022 – Real Gross Domestic Product (GDP) decreased at an annual rate of 0.9% in the first quarter of 2022, according to the advance estimate released by the Bureau of Economic Analysis. GDP decreased 1.6% in the first quarter of 2022. Two quarters of negative GDP growth marks a technical recession. The GDP estimate released today is based on source data that are incomplete or subject to further revision by the source agency. The decrease in real GDP reflected decreases in private inventory investment, residential fixed investment, federal government spending, state and local government spending, and nonresidential fixed investment that were partly offset by increases in exports and Personal Consumption Expenditures (PCE). Imports, which are a subtraction in the calculation of GDP, increased.
Durable Goods – Released 7/27/2022 – New Orders for manufactured durable goods in June increased $5 billion or 1.9% to $272.6 billion. Transportation equipment led the increase up $4.5 billion or 5.1% to $92.7 billion.
Consumer Confidence – Released 7/26/2022 – The consumer confidence index decreased in July following a decline in June. The index now stands at 95.7, down from 98.4 in June.
New Residential Sales – Released 7/26/2022 – Sales fo new single-family homes decreased 8.1% to 590k, seasonally adjusted, in June. The median sales price of new homes sold in June was $402,400 with an average sales price of $456,800. At the end of June, the seasonally adjusted estimate of new homes for sale was 457k. This represents a supply of 9.3 months at the current sales rate.
Next week we get data on New Residential Sales, Durable Goods, the 2nd Estimate of 2nd Quarter GDP, and Personal Income.
Data Sources:
Bureau of Economic Analysis (BEA)
Congressional Budget Office (CBO)
U.S. Bureau of Labor Statistics (BLS)
Federal Reserve Economic Data (FRED Charts)
CME Fed Watch
U.S. Treasury – Yields
U.S. Census Bureau
Institute for Supply Management (ISM)
Weekly DOL Employment Data
BLS Monthly Jobs Report
JOLTS
US Energy Admin (EIA)
BLS Consumer Price Index CPI
BLS Producer Price Index PPI
Atlanta Fed GDPNOW
NY Fed Nowcast GDP
US Census Bureau Housing Starts
Consumer Credit
USCB Retail Sales
Construction Spending
Federal Reserve Dot Plots
NY Empire Index
Philadelphia Federal Reserve
P/E Ratio Data -Yardeni Research
Technical Analysis Info:
StockCharts.com – Financial Charts
Exponential vs Simple moving average
Other Links:
1973 Arab Oil Embargo
Hunt Brothers Silver
Long-Term Capital bailout
Categories:
Tags: