Good Life Advisors – Talking Points – Week 30
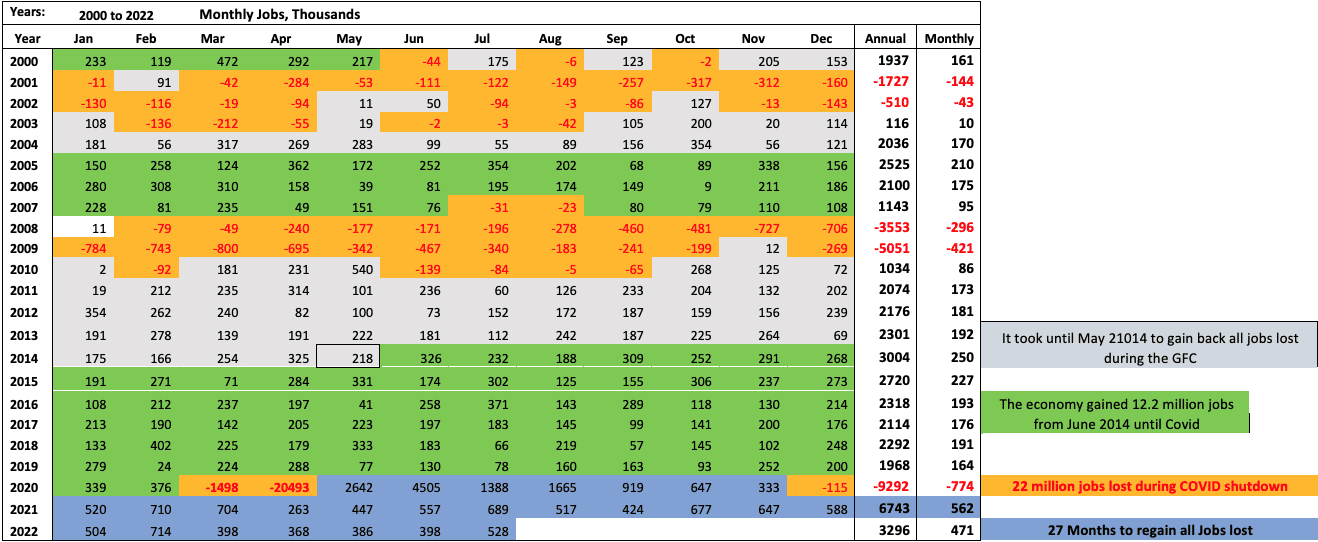
It took 27 months, but the economy gained back all the jobs lost during the nation shutdown.
US equities were mixed this week, following last week’s big gains (and despite the S&P logging declines in four out of five sessions). Growth was an out performer to value. Treasuries were notably weaker with the curve flattening in an extremely volatile week of trading that saw the 10Y yield drop as low as 2.50% on Tuesday before finishing the week at 2.84%. The 2/10 spread continued to move deeper into negative territory on Thursday, setting a fresh post-2000 low. The dollar was stronger across the board, particularly on the yen cross, with the DXY +.08%. Gold was higher, rising 0.5% in its third consecutive week of gains (that followed five straight weeks lower). Oil was lower, with concerns about weaker demand ahead outweighing ongoing geopolitical uncertainties. WTI settled down 9.7%, more than erasing last week’s gain and ending below $90/barrel. OPEC+’s token 100k bpd output increase for September had little impact.
The peak Fed theme was a notable thread in the conversation this week, though multiple Fed speakers used their appearances to push back on the notion there may be a dovish policy pivot ahead. For instance, SF Fed’s Daly said the Fed’s fight against inflation was “nowhere near almost done”, Cleveland’s Mester said she is still waiting on compelling evidence that inflation is moderating, and Minneapolis’s Kashkari argued the market is getting ahead of itself. By week’s end, market expectations pushed out expectations for a rate cut into July 2023.
A major component of this shift (and the impetus for September rate-hike forecasts moving to 75bp from 50bp) was Friday’s unexpectedly strong nonfarm payrolls release. Some 528k jobs were created in July, faster than June’s upwardly revised 398k and topping expectations for a slowdown to 250k. Despite the recent parade of announcements of layoffs and hiring slowdowns, employment (and the unemployment rate) returned to pre-pandemic levels for the month. Moreover, average hourly earnings were up 0.5% m/m, hotter than consensus expectations for 0.3% (which was also June’s pace). Despite a still-tight job market and signs of persistent wage pressures, “peak inflation” remained part of the conversation this week. July’s ISM manufacturing report came in at its lowest level since June 2020, but there was also a big decline in its prices-paid component; for the ISM services report, the prices-paid slide was its largest since May 2017. The employment components of these indices also remained in contractionary territory, and initial jobless claims continued to rise off its April trough, seemingly at odds with the nonfarm payrolls report.
The market processed large numbers of earnings reports, a last big burst before the pace slackens next week. With 87% of S&P 500 constituents having reported, the blended earnings growth rate now sits at 6.7%– better than the 4% expected at the end of the quarter. While fewer companies are reporting beats than longer-term averages (and the magnitude of those beats has been smaller than average), revenue beats have been better. Nevertheless, analysts continue to voice concerns about earnings cuts moving forward against a more challenging growth backdrop.
There were a few political headlines in focus this week. Sen. Sinema (D-AZ) agreed to support the Democrats’ ~$740B spending bill after lobbying for changes (including a new 1% tax on buybacks). The measure is expected to pass the Senate this weekend provided the Senate Parliamentarian deems it eligible for the party-line reconciliation method. There was also a lot of attention on Speaker Pelosi’s visit to Taiwan. However, despite warnings from China she arrived and departed without incident (though the diplomatic fallout is likely to persist).
There will be several economic releases relevant to the inflation picture, particularly July CPI on Wednesday. There, consensus is looking for core-price growth to slow to 05% m/m from June;s 0.7% monthly pace. Thursday will bring July PPI (forecasts for 0.4% m/m core price growth), while the preliminary August UMich consumer sentiment report, and its inflation expectations, will be out Friday.

Fixed Income
Yield Curve
June FOMC Statement Balance Sheet Reduction Plan Credit, Liquidity and Balance Sheet Federal Reserve Dot Plots
US Corporate Debt Tops 7 Trillion. Treasury.gov yields FOMC Policy Normalization Statement Longer Run Goals August 2020
Foreign Exchange Market
Europe travel looks really good these days as the USD/Eur is almost level.
Energy Complex
The Baker Hughes rig count decreased by 3 this week. There are 764 oil and gas rigs operating in the US – Up 273 over last year.
Metals Complex
Employment Picture
July Jobs Report – BLS Summary – Released 8/5/2022 – The US Economy added 528k nonfarm jobs in July and the Unemployment rate stayed declined to 3.5%. Average hourly earnings increased 15 to $32.27. Hiring highlights include +96k Leisure and Hospitality, +122k Education and Health Services, and +89 Professional and Business Services.
- Average hourly earnings increased 15 cents to $32.27.
- U3 unemployment rate remained declined 0.1% to 3.5%. U6 unemployment rate was unchanged at 6.7%.
- The labor force participation rate was little changed at 62.1%.
- Average work week was little changed at 34.6 hours.
Weekly Unemployment Claims – Released Thursday 8/4/2022 – The week ending July 30th observed an increase of 6k in initial claims increased to 260k. The four-week moving average of initial jobless claims increased 6k to 254.75k.
Job Openings & Labor Turnover Survey JOLTS – Released 8/2/2022 – The US Bureau of Labor Statistics reported the number and rate of job openings decreased to 10.7 million on the last business day of June. Over the month, hires were little changed at 6.4 million and separations were little changed at 5.9 million. Within separations, quits were little changed at 4.2 million. The layoffs and discharges rates were little changed at 1.3 million.
Employment Cost Index – Released 7/29/2022 – Compensation costs for civilian workers increased 1.3% for the 3-month period ending in June 2022. The 12-month period ending in June 2022 saw compensation costs increase by 5.1%. The 12-month period ending June 2021 increased 2.9%. Wages and salaries increased 5.3% over the year and increased 3.2% for the 12-month period ending in June 2021. Benefit costs increased 4.8% over the year and increased 2.2% for the 12-month period ending in June 2021. This report is published quarterly.
This Week’s Economic Data
Links take you to the data source
Consumer Credit – Released 8/5/2022 – Consumer credit increased at a seasonally adjusted annual rate of 8.7% in the second quarter of 2022. Revolving credit increased at an annual rate of 14.6%, while nonrevolving credit increased at an annual rate of 6.9%.
U.S. Trade Balance – Released 8/4/2022 – According to the US Census Bureau of Economic Analysis, the goods and services deficit decreased in June by $5.3 billion to $79.6 billion. June exports were $260.8 billion, $4.3 billion more than May exports. June imports were $340.4 billion, $1 billion less than May imports. Year to date, the goods and services deficit increased $134.1 billion, or 33.4%. from the same period in 2021. Exports increased $246.2 billion or 20%. IMports increased $380.3 billion or 23.3%.
PMI Non-Manufacturing Index – Released 8/3/2022 – Economic activity in the non-manufacturing sector grew in July for the 26th consecutive month. ISM Non-Manufacturing registered 56.7%, which is 1.4 percentage points about the JUne reading of 55.3%.
PMI Manufacturing Index – Released 8/1/2022 – July PMI decreased 0.2% to 52.8%, down from June’s reading of 52%. The New Orders Index was 48%, down 1.2% from June’s reading of 49.2%. The Production Index registered 52.5%, down 1.4%.
U.S. Construction Spending – Released 8/1/2022 – Construction spending decreased 1.1% in June, measuring at a seasonally adjusted annual rate of $1,762.3 billion. The June figure is 8.3% about the June 2021 estimate. Private construction spending declined 1.3% from the revised May estimate at $1,416.4 billion. Public construction spending was 0.5% below the revised May estimate at $345.9 billion.
Recent Economic Data
Links take you to the data source
US Light Vehicle Sales – Released 7/29/2022 – US Light vehicle sales were at a seasonally adjusted annual rate of 13.016 million units in June.
Chicago PMI – Released 7/29/2022 – Chicago PMI decreased by 4.9 points in July to 51.1. All five of the main five indicators decreased. This reading marks the lowest reading since August 2020.
Personal Income – Released 7/29/2022 – Personal income increased $133.5 billion or 0.6% in June according to estimates released today by the Bureau of Economic Analysis. Disposable Personal Income (DPI) increased $120.4 billion or 0.7% and Personal Consumption Expenditures (PCE) increased $181.1 billion or 1.1%.
Advance Estimate of 2nd Quarter 2022 GDP – Released 7/28/2022 – Real Gross Domestic Product (GDP) decreased at an annual rate of 0.9% in the first quarter of 2022. according to the advance estimate released by the Bureau of Economic Analysis. GDP decreased 1.6% in the first quarter of 2022. Two quarters of negative GDP growth marks a technical recession. The GDP estimate released today is based on source data that are incomplete or subject to further revision by the source agency. The decrease in real GDP reflects decreased in private inventory investment, residential fixed investment, federal government spending, state and local government spending, and nonresidential fixed investment that were partly offset by increases in exports and Personal Consumption Expenditures (PCE). Imports, which are a subtraction in the calculation of GDP, increased.
Durable Goods – Released 7/27/2022 – New orders for manufactured durable goods in June increased $5 billion or 1.9% to $272.6 billion. Transportation equipment led the increased up $4.5 billion or 5.1% to $92.7 billion.
Consumer Confidence – Released 7/26/2022 – The Consumer Confidence Index decreased in July following a decline in June. The Index now stands at 95.7, down from 98.4 in June.
New Residential Sales – Released 7/26/2022 – Sales of new single-family homes decreased 8.1% to 590k. seasonally adjusted, in June. The median sales price of new homes sold in June was $402,400 with an average sales price of $456,800. At the end of June, the seasonally adjusted estimate of new homes for sale was 457k. This represents a supply of 9.3 months at the current sales rate.
Existing Home Sales – Released 7/20/2022 – Existing home sales decreased in June marking five consecutive months of declines. Sales declined 5.4% to a seasonally adjusted rate of 5.12 million in June. Sales decreased 14.2% year-over-year. Housing inventory sits at 1.26 million units, Up 9.6% from May’s inventory, up 2.4% over last year. Unsold inventory sits at a 3-month supply. The median existing home price for all housing types was $416,000, which is up 13.4% form June 2021. This marks 124 consecutive months of year-over-year increased. the longest-running streak on record.
Housing Starts – Released 7/19/2022 – New home starts in June were at a seasonally adjusted annual rate of 1.559 million; down 2% below May, and 6.3% below last June’s rate. Building Permits were at a seasonally adjusted annual rate of 1.685 million, down 0.6% compared to May, but up 1.4% over last year.
Industrial Production and Capacity Utilization – Released 7/15/2022 – In June, Industrial Production decreased 0.2%. Manufacturing decreased 0.5%. Utilities output decreased 1.4%. Mining output increased 1.7%. Total industrial production was 4.2% higher in June than a year ago. Total capacity utilization increased to 80% in June which is 0.4% below its long run average.
Retail Sales – Released 7/15/2022 – US retail sales for June increased 1% to $680.6 billion and retail sales are 8.4% above June 2021. US retail sales for the April 2022 through June 2022 period were up 8.1% from the same period a year ago.
Producer Price Index – Released 7/14/2022 – The Producer Price Index for final demand increased 1.1% in June. PPI less food and energy increased 0.5%. The change in PPI for final demand has increased 11.3% year/y.
Consumer Price Index – Released 7/13/2022 – Consumer prices rose 1.3% m/m in June following a 1% increase in May. Consumer prices are up 9.1% for the 12-month period ending in June. Core consumer prices increased 0.7% m/m in June.
Next week we get data on CPI and PPI.
Data Sources:
Bureau of Economic Analysis (BEA)
Congressional Budget Office (CBO)
U.S. Bureau of Labor Statistics (BLS)
Federal Reserve Economic Data (FRED Charts)
CME Fed Watch
U.S. Treasury – Yields
U.S. Census Bureau
Institute for Supply Management (ISM)
Weekly DOL Employment Data
BLS Monthly Jobs Report
JOLTS
US Energy Admin (EIA)
BLS Consumer Price Index CPI
BLS Producer Price Index PPI
Atlanta Fed GDPNOW
NY Fed Nowcast GDP
US Census Bureau Housing Starts
Consumer Credit
USCB Retail Sales
Construction Spending
Federal Reserve Dot Plots
NY Empire Index
Philadelphia Federal Reserve
P/E Ratio Data -Yardeni Research
Technical Analysis Info:
StockCharts.com – Financial Charts
Exponential vs Simple moving average
Other Links:
1973 Arab Oil Embargo
Hunt Brothers Silver
Long-Term Capital bailout


Week 30 Talking Points
Good Life Advisors – Talking Points – Week 30
It took 27 months, but the economy gained back all the jobs lost during the nation shutdown.
US equities were mixed this week, following last week’s big gains (and despite the S&P logging declines in four out of five sessions). Growth was an out performer to value. Treasuries were notably weaker with the curve flattening in an extremely volatile week of trading that saw the 10Y yield drop as low as 2.50% on Tuesday before finishing the week at 2.84%. The 2/10 spread continued to move deeper into negative territory on Thursday, setting a fresh post-2000 low. The dollar was stronger across the board, particularly on the yen cross, with the DXY +.08%. Gold was higher, rising 0.5% in its third consecutive week of gains (that followed five straight weeks lower). Oil was lower, with concerns about weaker demand ahead outweighing ongoing geopolitical uncertainties. WTI settled down 9.7%, more than erasing last week’s gain and ending below $90/barrel. OPEC+’s token 100k bpd output increase for September had little impact.
The peak Fed theme was a notable thread in the conversation this week, though multiple Fed speakers used their appearances to push back on the notion there may be a dovish policy pivot ahead. For instance, SF Fed’s Daly said the Fed’s fight against inflation was “nowhere near almost done”, Cleveland’s Mester said she is still waiting on compelling evidence that inflation is moderating, and Minneapolis’s Kashkari argued the market is getting ahead of itself. By week’s end, market expectations pushed out expectations for a rate cut into July 2023.
A major component of this shift (and the impetus for September rate-hike forecasts moving to 75bp from 50bp) was Friday’s unexpectedly strong nonfarm payrolls release. Some 528k jobs were created in July, faster than June’s upwardly revised 398k and topping expectations for a slowdown to 250k. Despite the recent parade of announcements of layoffs and hiring slowdowns, employment (and the unemployment rate) returned to pre-pandemic levels for the month. Moreover, average hourly earnings were up 0.5% m/m, hotter than consensus expectations for 0.3% (which was also June’s pace). Despite a still-tight job market and signs of persistent wage pressures, “peak inflation” remained part of the conversation this week. July’s ISM manufacturing report came in at its lowest level since June 2020, but there was also a big decline in its prices-paid component; for the ISM services report, the prices-paid slide was its largest since May 2017. The employment components of these indices also remained in contractionary territory, and initial jobless claims continued to rise off its April trough, seemingly at odds with the nonfarm payrolls report.
The market processed large numbers of earnings reports, a last big burst before the pace slackens next week. With 87% of S&P 500 constituents having reported, the blended earnings growth rate now sits at 6.7%– better than the 4% expected at the end of the quarter. While fewer companies are reporting beats than longer-term averages (and the magnitude of those beats has been smaller than average), revenue beats have been better. Nevertheless, analysts continue to voice concerns about earnings cuts moving forward against a more challenging growth backdrop.
There were a few political headlines in focus this week. Sen. Sinema (D-AZ) agreed to support the Democrats’ ~$740B spending bill after lobbying for changes (including a new 1% tax on buybacks). The measure is expected to pass the Senate this weekend provided the Senate Parliamentarian deems it eligible for the party-line reconciliation method. There was also a lot of attention on Speaker Pelosi’s visit to Taiwan. However, despite warnings from China she arrived and departed without incident (though the diplomatic fallout is likely to persist).
There will be several economic releases relevant to the inflation picture, particularly July CPI on Wednesday. There, consensus is looking for core-price growth to slow to 05% m/m from June;s 0.7% monthly pace. Thursday will bring July PPI (forecasts for 0.4% m/m core price growth), while the preliminary August UMich consumer sentiment report, and its inflation expectations, will be out Friday.
Table of Contents
Fixed Income
Yield Curve
June FOMC Statement Balance Sheet Reduction Plan Credit, Liquidity and Balance Sheet Federal Reserve Dot Plots
US Corporate Debt Tops 7 Trillion. Treasury.gov yields FOMC Policy Normalization Statement Longer Run Goals August 2020
Foreign Exchange Market
Europe travel looks really good these days as the USD/Eur is almost level.
Energy Complex
The Baker Hughes rig count decreased by 3 this week. There are 764 oil and gas rigs operating in the US – Up 273 over last year.
Metals Complex
Employment Picture
July Jobs Report – BLS Summary – Released 8/5/2022 – The US Economy added 528k nonfarm jobs in July and the Unemployment rate stayed declined to 3.5%. Average hourly earnings increased 15 to $32.27. Hiring highlights include +96k Leisure and Hospitality, +122k Education and Health Services, and +89 Professional and Business Services.
Weekly Unemployment Claims – Released Thursday 8/4/2022 – The week ending July 30th observed an increase of 6k in initial claims increased to 260k. The four-week moving average of initial jobless claims increased 6k to 254.75k.
Job Openings & Labor Turnover Survey JOLTS – Released 8/2/2022 – The US Bureau of Labor Statistics reported the number and rate of job openings decreased to 10.7 million on the last business day of June. Over the month, hires were little changed at 6.4 million and separations were little changed at 5.9 million. Within separations, quits were little changed at 4.2 million. The layoffs and discharges rates were little changed at 1.3 million.
Employment Cost Index – Released 7/29/2022 – Compensation costs for civilian workers increased 1.3% for the 3-month period ending in June 2022. The 12-month period ending in June 2022 saw compensation costs increase by 5.1%. The 12-month period ending June 2021 increased 2.9%. Wages and salaries increased 5.3% over the year and increased 3.2% for the 12-month period ending in June 2021. Benefit costs increased 4.8% over the year and increased 2.2% for the 12-month period ending in June 2021. This report is published quarterly.
This Week’s Economic Data
Links take you to the data source
Consumer Credit – Released 8/5/2022 – Consumer credit increased at a seasonally adjusted annual rate of 8.7% in the second quarter of 2022. Revolving credit increased at an annual rate of 14.6%, while nonrevolving credit increased at an annual rate of 6.9%.
U.S. Trade Balance – Released 8/4/2022 – According to the US Census Bureau of Economic Analysis, the goods and services deficit decreased in June by $5.3 billion to $79.6 billion. June exports were $260.8 billion, $4.3 billion more than May exports. June imports were $340.4 billion, $1 billion less than May imports. Year to date, the goods and services deficit increased $134.1 billion, or 33.4%. from the same period in 2021. Exports increased $246.2 billion or 20%. IMports increased $380.3 billion or 23.3%.
PMI Non-Manufacturing Index – Released 8/3/2022 – Economic activity in the non-manufacturing sector grew in July for the 26th consecutive month. ISM Non-Manufacturing registered 56.7%, which is 1.4 percentage points about the JUne reading of 55.3%.
PMI Manufacturing Index – Released 8/1/2022 – July PMI decreased 0.2% to 52.8%, down from June’s reading of 52%. The New Orders Index was 48%, down 1.2% from June’s reading of 49.2%. The Production Index registered 52.5%, down 1.4%.
U.S. Construction Spending – Released 8/1/2022 – Construction spending decreased 1.1% in June, measuring at a seasonally adjusted annual rate of $1,762.3 billion. The June figure is 8.3% about the June 2021 estimate. Private construction spending declined 1.3% from the revised May estimate at $1,416.4 billion. Public construction spending was 0.5% below the revised May estimate at $345.9 billion.
Recent Economic Data
Links take you to the data source
US Light Vehicle Sales – Released 7/29/2022 – US Light vehicle sales were at a seasonally adjusted annual rate of 13.016 million units in June.
Chicago PMI – Released 7/29/2022 – Chicago PMI decreased by 4.9 points in July to 51.1. All five of the main five indicators decreased. This reading marks the lowest reading since August 2020.
Personal Income – Released 7/29/2022 – Personal income increased $133.5 billion or 0.6% in June according to estimates released today by the Bureau of Economic Analysis. Disposable Personal Income (DPI) increased $120.4 billion or 0.7% and Personal Consumption Expenditures (PCE) increased $181.1 billion or 1.1%.
Advance Estimate of 2nd Quarter 2022 GDP – Released 7/28/2022 – Real Gross Domestic Product (GDP) decreased at an annual rate of 0.9% in the first quarter of 2022. according to the advance estimate released by the Bureau of Economic Analysis. GDP decreased 1.6% in the first quarter of 2022. Two quarters of negative GDP growth marks a technical recession. The GDP estimate released today is based on source data that are incomplete or subject to further revision by the source agency. The decrease in real GDP reflects decreased in private inventory investment, residential fixed investment, federal government spending, state and local government spending, and nonresidential fixed investment that were partly offset by increases in exports and Personal Consumption Expenditures (PCE). Imports, which are a subtraction in the calculation of GDP, increased.
Durable Goods – Released 7/27/2022 – New orders for manufactured durable goods in June increased $5 billion or 1.9% to $272.6 billion. Transportation equipment led the increased up $4.5 billion or 5.1% to $92.7 billion.
Consumer Confidence – Released 7/26/2022 – The Consumer Confidence Index decreased in July following a decline in June. The Index now stands at 95.7, down from 98.4 in June.
New Residential Sales – Released 7/26/2022 – Sales of new single-family homes decreased 8.1% to 590k. seasonally adjusted, in June. The median sales price of new homes sold in June was $402,400 with an average sales price of $456,800. At the end of June, the seasonally adjusted estimate of new homes for sale was 457k. This represents a supply of 9.3 months at the current sales rate.
Existing Home Sales – Released 7/20/2022 – Existing home sales decreased in June marking five consecutive months of declines. Sales declined 5.4% to a seasonally adjusted rate of 5.12 million in June. Sales decreased 14.2% year-over-year. Housing inventory sits at 1.26 million units, Up 9.6% from May’s inventory, up 2.4% over last year. Unsold inventory sits at a 3-month supply. The median existing home price for all housing types was $416,000, which is up 13.4% form June 2021. This marks 124 consecutive months of year-over-year increased. the longest-running streak on record.
Housing Starts – Released 7/19/2022 – New home starts in June were at a seasonally adjusted annual rate of 1.559 million; down 2% below May, and 6.3% below last June’s rate. Building Permits were at a seasonally adjusted annual rate of 1.685 million, down 0.6% compared to May, but up 1.4% over last year.
Industrial Production and Capacity Utilization – Released 7/15/2022 – In June, Industrial Production decreased 0.2%. Manufacturing decreased 0.5%. Utilities output decreased 1.4%. Mining output increased 1.7%. Total industrial production was 4.2% higher in June than a year ago. Total capacity utilization increased to 80% in June which is 0.4% below its long run average.
Retail Sales – Released 7/15/2022 – US retail sales for June increased 1% to $680.6 billion and retail sales are 8.4% above June 2021. US retail sales for the April 2022 through June 2022 period were up 8.1% from the same period a year ago.
Producer Price Index – Released 7/14/2022 – The Producer Price Index for final demand increased 1.1% in June. PPI less food and energy increased 0.5%. The change in PPI for final demand has increased 11.3% year/y.
Consumer Price Index – Released 7/13/2022 – Consumer prices rose 1.3% m/m in June following a 1% increase in May. Consumer prices are up 9.1% for the 12-month period ending in June. Core consumer prices increased 0.7% m/m in June.
Next week we get data on CPI and PPI.
Data Sources:
Bureau of Economic Analysis (BEA)
Congressional Budget Office (CBO)
U.S. Bureau of Labor Statistics (BLS)
Federal Reserve Economic Data (FRED Charts)
CME Fed Watch
U.S. Treasury – Yields
U.S. Census Bureau
Institute for Supply Management (ISM)
Weekly DOL Employment Data
BLS Monthly Jobs Report
JOLTS
US Energy Admin (EIA)
BLS Consumer Price Index CPI
BLS Producer Price Index PPI
Atlanta Fed GDPNOW
NY Fed Nowcast GDP
US Census Bureau Housing Starts
Consumer Credit
USCB Retail Sales
Construction Spending
Federal Reserve Dot Plots
NY Empire Index
Philadelphia Federal Reserve
P/E Ratio Data -Yardeni Research
Technical Analysis Info:
StockCharts.com – Financial Charts
Exponential vs Simple moving average
Other Links:
1973 Arab Oil Embargo
Hunt Brothers Silver
Long-Term Capital bailout
Categories:
Tags: