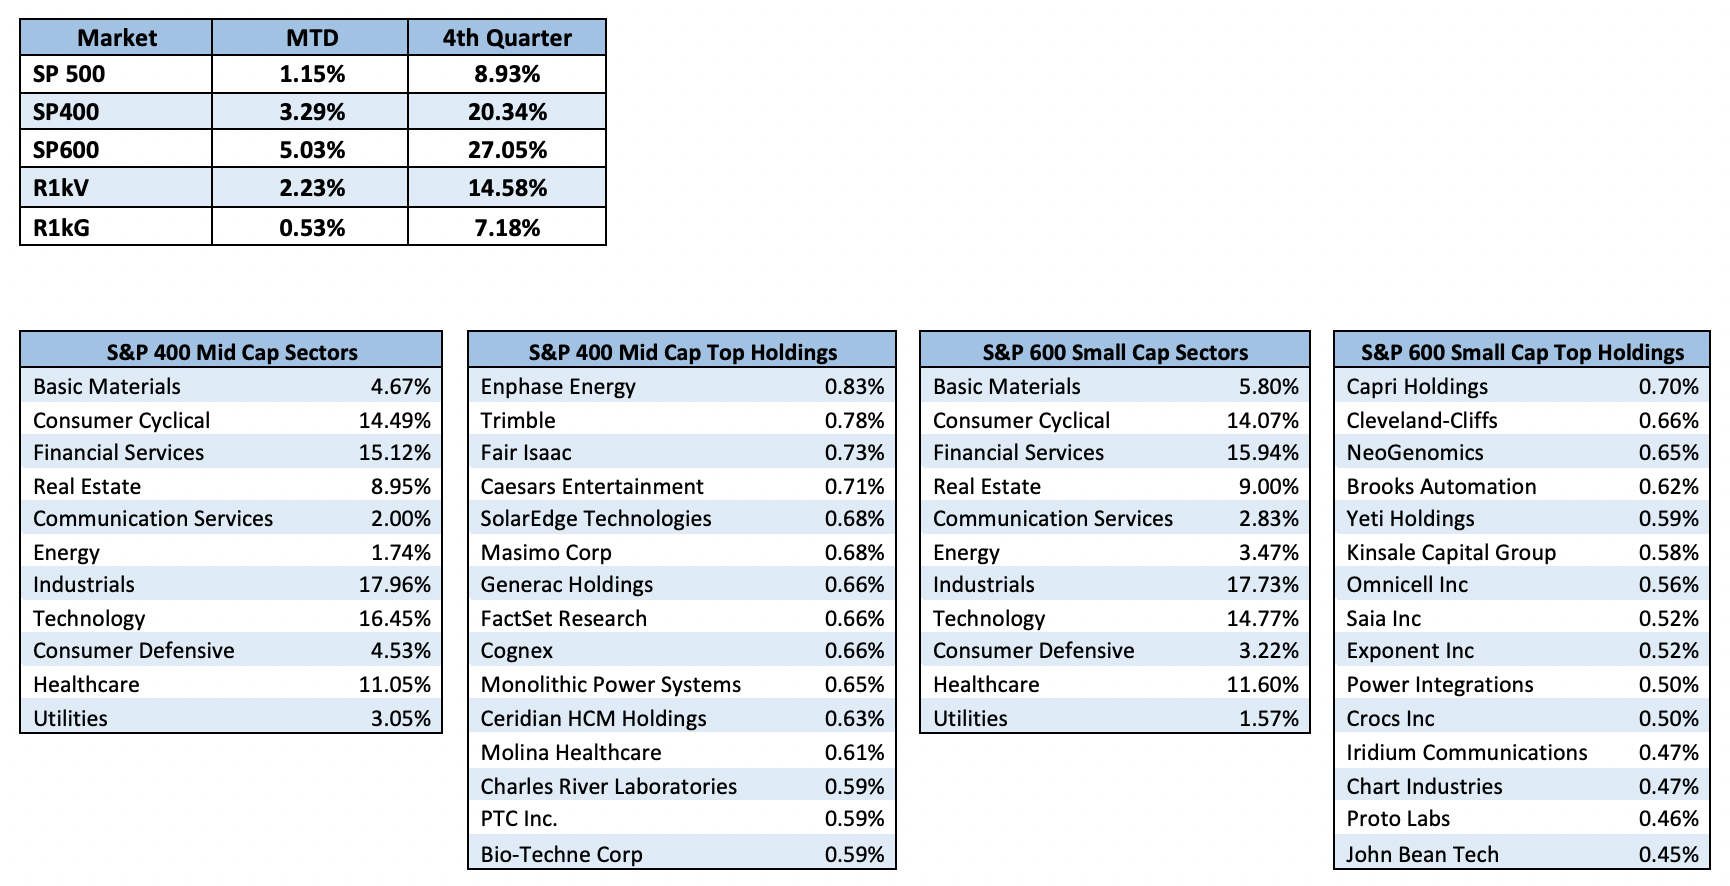
The Rotation Continues
As we close in on the end of the year, there some notable differences in the current trends. The rally has started to include smaller and non-tech companies. Even value is positive for the year now.

.
Fixed Income
11/5/20 FOMC Statement FOMC Minutes Credit, Liquidity and Balance Sheet Federal Reserve Dot Plots US Debt Measurement US Corporate Debt Tops 7 Trillion Treasury.gov yields FOMC Policy Normalization Statement Longer Run Goals August 2020
Global Bond Yields
Daily US Treasury Yields
Foreign Exchange Market
Energy Complex
The Baker Hughes rig count gained 15 this week. There are 338 oil and gas rigs operating in the US – down 461 over last year.
- Brent Crude Oil gained 1.52% this week closing at $50.00/bbl
- WTI Crude Oil gained 0.67% this week to close at $46.57/bbl
- Heating Oil gained 2.42% this week closing at $1.44/gallon
- Natural Gas gained 0.62% this week closing at $2.59 per million BTUs
- Unleaded Gas gained 3.09% this week closing at $1.31/gallon
Metals Complex
- Gold gained 0.20% this week closing at $1886.20/oz
- Silver lost 0.66% on the week closing at $24.09/oz
- Palladium lost 1.05% this week closing at $2333.10/oz
- Platinum lost 4.75% this week closing at $1021.80/oz
- Copper gained 0.10% this week closing at $3.53/lb
Employment Picture
Weekly Unemployment Claims – Released Thursday 12/10/2020 – Initial jobless claims for the week ending December 5th increased 137k to 853k. The 4-week moving average was 776k, an increase of 35.5k.
Job Openings & Labor Turnover Survey JOLTS – Released 12/9/2020 – The U.S. Bureau of Labor Statistics reported the number and rate of job openings was little changed at 6.7 million on the last business day of October. Over the month, hires were little changed at 5.8 million and separations increased to 5.1 million. Within separations, the quits rate was unchanged at 2.2%. The layoffs and discharges rates increased to 1.2%.
November Jobs Report – BLS Summary – Released 12/4/2020 – The US Economy gained 245k nonfarm jobs in November and the Unemployment rate declined to 6.7%. Average hourly earnings increased 9 cents to $29.58. Hiring highlights include +145k Transportation and Warehousing, +60k Professional and Business Services, and +54k Education and Health Services.
- Average hourly earnings increased 9 cents to $29.58.
- U3 unemployment rate declined to 6.7%. U6 unemployment rate declined to 12.0%.
- The labor force participation rate decreased 0.2% to 61.5%.
- Average work week was unchanged at 34.8 hours.
Employment Cost Index – Released 10/30/2020 – Compensation costs for civilian workers increased 0.5% for the 3-month period ending in June 2020. The 12 month period ending on September 2020 saw compensation costs increase by 2.4%. The 12 month period ending September 2019 increased 2.8%. Wages and salaries increased 2.5 percent over the year and increased 2.9 percent for the 12-month period ending in September 2019. Benefit costs increased 2.3 percent for the 12-month period ending in September 2020. In September 2019, the increase was also 2.3 percent. This report is published quarterly.
This Week’s Economic Data
Links take you to the data source
Producer Price Index – Released 12/11/2020 – The Producer Price Index for final demand increased 0.1% in November. PPI less food and energy increased 0.2% in November.
Consumer Price Index – Released 12/10/2020 – The Consumer Price Index increased 0.2% in November. Core CPI, which excludes food and energy was also up 0.2%. The monthly changes left total CPI up 1.2% year-over-year and core CPI up 1.6%.
Consumer Credit – Released 12/7/2020 – In October, consumer credit increased at a seasonally adjusted rate of 2.0%. Revolving credit decreased at an annual rate of 6.75%, while nonrevolving credit increased at an annual rate of 4.75%. Total Outstanding consumer credit is currently at $4.164 trillion.
Recent Economic Data
Links take you to the data source
U.S. Trade Balance – Released 12/4/2020 – According to the U.S. Census Bureau of Economic Analysis the goods and services deficit increased in October by $1.0 billion to $63.1 billion. October exports were $182.0 billion, $4.0 billion more than September exports. October imports were $245.1 billion, $5.0 billion more than September imports. The goods and services deficit increased $46.6 billion or 9.5% year-to-date, from the same period in 2019. Year – over – year exports and imports decreased $345.9 billion or 16.4% and decreased $299.4 billion or 11.5% respectively.
PMI Non-Manufacturing Index (ISM Services) – Released 12/3/2020 – Economic activity in the non-manufacturing sector grew in November for the sixth consecutive month. ISM Non-Manufacturing registered 55.9 percent, which is 0.7 percentage points below the adjusted October reading of 56.6 percent.
PMI Manufacturing ISM Index – Released 12/1/2020 – November PMI declined 1.8% to 57.5% from October’s reading of 59.3%. The New Orders Index was down 2.8% from October’s reading of 67.9% to 65.1%. The Production Index registered 60.8%, down 2.2%.
U.S. Construction Spending – Released 12/1/2020 – Construction spending increased 1.3% in October measuring at a seasonally adjusted annual rate of $1,438.5 billion. The October figure is 3.7% above the October 2019 estimate. Private construction spending was 1.4% above the revised September estimate at $1,078.9 billion. Public construction spending was 1.0% above the revised September estimate at $344.8 billion.
Chicago PMI – Released 11/30/2020 – Chicago PMI declined to 58.2 points in November following a decline in October. This marks five consecutive months above the 50-mark following a full year under it. Supplier Deliveries saw the larges gain while New Orders and Production posted the only declines.
Personal Income – Released 11/25/2020 – Personal income decreased $130.1 billion or 0.7 percent in October according to estimates released today by the Bureau of Economic Analysis. Disposable personal income (DPI) decreased $134.8 billion or 0.8 percent and personal consumption expenditures (PCE) increased $70.9 billion or 0.5 percent.
Second Estimate of 3rd Quarter 2020 GDP – Released 11/25/2020 – Real gross domestic product (GDP) increased at an annual rate of 33.1 percent in the third quarter of 2020, according to the second estimate released by the Bureau of Economic Analysis. This increase follows a 31.4% decline in GDP in the second quarter of 2020. The GDP second estimate is based on source data that are more complete than that of the advance estimate. The increase in real GDP reflected increases in personal consumption expenditures (PCE), private inventory investment, exports, nonresidential fixed investment, and residential fixed investment that were partly offset by decreases in federal government spending (reflecting fewer fees paid to administer the Paycheck Protection Program loans), state and local government spending, and imports. With the second estimate, upward revisions to nonresidential fixed investment, residential investment, and exports were offset by downward revisions to state and local government spending, private inventory investment, imports, and personal consumption expenditures (PCE).
Durable Goods – Released 11/25/2020 – New orders for manufactured durable goods in October increased for the sixth consecutive month up $3.0 billion or 1.3% to $240.8 billion. Transportation equipment led the increase rising $0.9 billion or 1.2% to $77.1 billion.
New Residential Sales – Released 11/25/2020 – Sales of new single-family homes declined 0.3% to 999k, seasonally adjusted, in October. The median sales price of new homes sold in October was $330,600 with an average sales price of $386,200. At the end of October the seasonally adjusted estimate of new homes for sale was 278k. This represents a supply of 3.3 months at the current sales rate.
Consumer Confidence – Released 11/24/2020 – The Consumer confidence index declined 5.3% in November following a minimal change in October. The Index now shows a reading of 96.1, down from 101.4 in October.
Existing Home Sales – Released 11/19/2020 – Existing home sales increased in October making five consecutive months of sales gains. Sales increased 4.3% to a seasonally adjusted rate of 6.85 million in October. Sales are currently up 26.6% from one year ago. Housing inventory sits at 1.42 million units. Down 2.7% over last month. Down 19.8% over last year. Unsold inventory sits at an all-time low 2.5 month supply. The median existing home price for all housing types was $313,000.
Housing Starts – Released 11/18/2020 – New home starts in October were at a seasonally adjusted annual rate of 1.530 million; up 4.9% above September and 14.2% above last October’s rate. Building Permits were at a seasonally adjusted annual rate of 1.545 million, unchanged compared to September and up 2.8% over last year.
Retail Sales – Released 11/17/2020 – U.S. retail sales for October increased 0.3% to $553.3 billion. U.S. retail sales are up 5.7% year/y.
Industrial Production and Capacity Utilization – Released 11/17/2020 – In October Industrial production increased 1.1%. Total Industrial production is still 5.6% below its pre-pandemic February level. Manufacturing increased 1.0%. The output of utilities increased 3.9%. Total industrial production was 103.2% of its 2012 average which is 5.3% lower in October than a year ago. Total capacity utilization increased 0.8% to 72.8% in October which is 7.0% below its long run average.
US Light Vehicle Sales – Released 11/6/2020 – U.S. light vehicle sales were at a seasonally adjusted annual rate (SAAR) of 16.209 million units in October.
Next week we get data on Consumer Credit, CPI, PPI, and JOLTS.
Data Sources:
Bureau of Economic Analysis (BEA)
Congressional Budget Office (CBO)
U.S. Bureau of Labor Statistics (BLS)
Federal Reserve Economic Data (FRED Charts)
CME Fed Watch
U.S. Treasury – Yields
U.S. Census Bureau
Institute for Supply Management (ISM)
Weekly DOL Employment Data
BLS Monthly Jobs Report
JOLTS
US Energy Admin (EIA)
BLS Consumer Price Index CPI
BLS Producer Price Index PPI
Atlanta Fed GDPNOW
NY Fed Nowcast GDP
US Census Bureau Housing Starts
Consumer Credit
USCB Retail Sales
Construction Spending
Federal Reserve Dot Plots
NY Empire Index
Philadelphia Federal Reserve
P/E Ratio Data -Yardeni Research
Technical Analysis Info:
StockCharts.com – Financial Charts
Exponential vs Simple moving average
Other Links:
1973 Arab Oil Embargo
Hunt Brothers Silver
Long-Term Capital bailout


Week 50 Talking Points
The Rotation Continues
As we close in on the end of the year, there some notable differences in the current trends. The rally has started to include smaller and non-tech companies. Even value is positive for the year now.
.
Table of Contents
Fixed Income
11/5/20 FOMC Statement FOMC Minutes Credit, Liquidity and Balance Sheet Federal Reserve Dot Plots US Debt Measurement US Corporate Debt Tops 7 Trillion Treasury.gov yields FOMC Policy Normalization Statement Longer Run Goals August 2020
Global Bond Yields
Daily US Treasury Yields
Foreign Exchange Market
Energy Complex
The Baker Hughes rig count gained 15 this week. There are 338 oil and gas rigs operating in the US – down 461 over last year.
Metals Complex
Employment Picture
Weekly Unemployment Claims – Released Thursday 12/10/2020 – Initial jobless claims for the week ending December 5th increased 137k to 853k. The 4-week moving average was 776k, an increase of 35.5k.
Job Openings & Labor Turnover Survey JOLTS – Released 12/9/2020 – The U.S. Bureau of Labor Statistics reported the number and rate of job openings was little changed at 6.7 million on the last business day of October. Over the month, hires were little changed at 5.8 million and separations increased to 5.1 million. Within separations, the quits rate was unchanged at 2.2%. The layoffs and discharges rates increased to 1.2%.
November Jobs Report – BLS Summary – Released 12/4/2020 – The US Economy gained 245k nonfarm jobs in November and the Unemployment rate declined to 6.7%. Average hourly earnings increased 9 cents to $29.58. Hiring highlights include +145k Transportation and Warehousing, +60k Professional and Business Services, and +54k Education and Health Services.
Employment Cost Index – Released 10/30/2020 – Compensation costs for civilian workers increased 0.5% for the 3-month period ending in June 2020. The 12 month period ending on September 2020 saw compensation costs increase by 2.4%. The 12 month period ending September 2019 increased 2.8%. Wages and salaries increased 2.5 percent over the year and increased 2.9 percent for the 12-month period ending in September 2019. Benefit costs increased 2.3 percent for the 12-month period ending in September 2020. In September 2019, the increase was also 2.3 percent. This report is published quarterly.
This Week’s Economic Data
Links take you to the data source
Producer Price Index – Released 12/11/2020 – The Producer Price Index for final demand increased 0.1% in November. PPI less food and energy increased 0.2% in November.
Consumer Price Index – Released 12/10/2020 – The Consumer Price Index increased 0.2% in November. Core CPI, which excludes food and energy was also up 0.2%. The monthly changes left total CPI up 1.2% year-over-year and core CPI up 1.6%.
Consumer Credit – Released 12/7/2020 – In October, consumer credit increased at a seasonally adjusted rate of 2.0%. Revolving credit decreased at an annual rate of 6.75%, while nonrevolving credit increased at an annual rate of 4.75%. Total Outstanding consumer credit is currently at $4.164 trillion.
Recent Economic Data
Links take you to the data source
U.S. Trade Balance – Released 12/4/2020 – According to the U.S. Census Bureau of Economic Analysis the goods and services deficit increased in October by $1.0 billion to $63.1 billion. October exports were $182.0 billion, $4.0 billion more than September exports. October imports were $245.1 billion, $5.0 billion more than September imports. The goods and services deficit increased $46.6 billion or 9.5% year-to-date, from the same period in 2019. Year – over – year exports and imports decreased $345.9 billion or 16.4% and decreased $299.4 billion or 11.5% respectively.
PMI Non-Manufacturing Index (ISM Services) – Released 12/3/2020 – Economic activity in the non-manufacturing sector grew in November for the sixth consecutive month. ISM Non-Manufacturing registered 55.9 percent, which is 0.7 percentage points below the adjusted October reading of 56.6 percent.
PMI Manufacturing ISM Index – Released 12/1/2020 – November PMI declined 1.8% to 57.5% from October’s reading of 59.3%. The New Orders Index was down 2.8% from October’s reading of 67.9% to 65.1%. The Production Index registered 60.8%, down 2.2%.
U.S. Construction Spending – Released 12/1/2020 – Construction spending increased 1.3% in October measuring at a seasonally adjusted annual rate of $1,438.5 billion. The October figure is 3.7% above the October 2019 estimate. Private construction spending was 1.4% above the revised September estimate at $1,078.9 billion. Public construction spending was 1.0% above the revised September estimate at $344.8 billion.
Chicago PMI – Released 11/30/2020 – Chicago PMI declined to 58.2 points in November following a decline in October. This marks five consecutive months above the 50-mark following a full year under it. Supplier Deliveries saw the larges gain while New Orders and Production posted the only declines.
Personal Income – Released 11/25/2020 – Personal income decreased $130.1 billion or 0.7 percent in October according to estimates released today by the Bureau of Economic Analysis. Disposable personal income (DPI) decreased $134.8 billion or 0.8 percent and personal consumption expenditures (PCE) increased $70.9 billion or 0.5 percent.
Second Estimate of 3rd Quarter 2020 GDP – Released 11/25/2020 – Real gross domestic product (GDP) increased at an annual rate of 33.1 percent in the third quarter of 2020, according to the second estimate released by the Bureau of Economic Analysis. This increase follows a 31.4% decline in GDP in the second quarter of 2020. The GDP second estimate is based on source data that are more complete than that of the advance estimate. The increase in real GDP reflected increases in personal consumption expenditures (PCE), private inventory investment, exports, nonresidential fixed investment, and residential fixed investment that were partly offset by decreases in federal government spending (reflecting fewer fees paid to administer the Paycheck Protection Program loans), state and local government spending, and imports. With the second estimate, upward revisions to nonresidential fixed investment, residential investment, and exports were offset by downward revisions to state and local government spending, private inventory investment, imports, and personal consumption expenditures (PCE).
Durable Goods – Released 11/25/2020 – New orders for manufactured durable goods in October increased for the sixth consecutive month up $3.0 billion or 1.3% to $240.8 billion. Transportation equipment led the increase rising $0.9 billion or 1.2% to $77.1 billion.
New Residential Sales – Released 11/25/2020 – Sales of new single-family homes declined 0.3% to 999k, seasonally adjusted, in October. The median sales price of new homes sold in October was $330,600 with an average sales price of $386,200. At the end of October the seasonally adjusted estimate of new homes for sale was 278k. This represents a supply of 3.3 months at the current sales rate.
Consumer Confidence – Released 11/24/2020 – The Consumer confidence index declined 5.3% in November following a minimal change in October. The Index now shows a reading of 96.1, down from 101.4 in October.
Existing Home Sales – Released 11/19/2020 – Existing home sales increased in October making five consecutive months of sales gains. Sales increased 4.3% to a seasonally adjusted rate of 6.85 million in October. Sales are currently up 26.6% from one year ago. Housing inventory sits at 1.42 million units. Down 2.7% over last month. Down 19.8% over last year. Unsold inventory sits at an all-time low 2.5 month supply. The median existing home price for all housing types was $313,000.
Housing Starts – Released 11/18/2020 – New home starts in October were at a seasonally adjusted annual rate of 1.530 million; up 4.9% above September and 14.2% above last October’s rate. Building Permits were at a seasonally adjusted annual rate of 1.545 million, unchanged compared to September and up 2.8% over last year.
Retail Sales – Released 11/17/2020 – U.S. retail sales for October increased 0.3% to $553.3 billion. U.S. retail sales are up 5.7% year/y.
Industrial Production and Capacity Utilization – Released 11/17/2020 – In October Industrial production increased 1.1%. Total Industrial production is still 5.6% below its pre-pandemic February level. Manufacturing increased 1.0%. The output of utilities increased 3.9%. Total industrial production was 103.2% of its 2012 average which is 5.3% lower in October than a year ago. Total capacity utilization increased 0.8% to 72.8% in October which is 7.0% below its long run average.
US Light Vehicle Sales – Released 11/6/2020 – U.S. light vehicle sales were at a seasonally adjusted annual rate (SAAR) of 16.209 million units in October.
Next week we get data on Consumer Credit, CPI, PPI, and JOLTS.
Data Sources:
Bureau of Economic Analysis (BEA)
Congressional Budget Office (CBO)
U.S. Bureau of Labor Statistics (BLS)
Federal Reserve Economic Data (FRED Charts)
CME Fed Watch
U.S. Treasury – Yields
U.S. Census Bureau
Institute for Supply Management (ISM)
Weekly DOL Employment Data
BLS Monthly Jobs Report
JOLTS
US Energy Admin (EIA)
BLS Consumer Price Index CPI
BLS Producer Price Index PPI
Atlanta Fed GDPNOW
NY Fed Nowcast GDP
US Census Bureau Housing Starts
Consumer Credit
USCB Retail Sales
Construction Spending
Federal Reserve Dot Plots
NY Empire Index
Philadelphia Federal Reserve
P/E Ratio Data -Yardeni Research
Technical Analysis Info:
StockCharts.com – Financial Charts
Exponential vs Simple moving average
Other Links:
1973 Arab Oil Embargo
Hunt Brothers Silver
Long-Term Capital bailout
Categories:
Tags: