Good Life Advisors – Talking Points – Week 5
Fed Hikes 25 bp as Expected, but a Gangbuster Jobs Report Complicates the Feds Path
Despite forecasts looking for a continued softening along the lines of recent months, the headline January nonfarm payrolls showed the Economy created 517k jobs in January (vs a 190k consensus). The unemployment rate unexpectedly dropped to 3.4%, hitting the lowest mark since 1969. Average hourly earnings came in at 0.3% m/m (+4.3% y/y), in line with consensus. While multiple analysts had discussed upside risks into the report (including the return of striking California University workers and warmer weather0, the magnitude of the headline increase seemed to take the market by surprise and sparked a vigorous conversation about how much of the surprise was due to seasonal adjustment factors. That said, the report did provide evidence for a labor market that has remained resilient despite the Fed’s hiking campaign, which may be supportive of the soft-landing thesis. At the same time, the report heightened market expectations for the Fed to raise rates above 5% before pausing. The report also dampened expectations of a Fed cut later this year.
The FOMC raised rates by 25 bp to 4.5-4.75% at its 3-Feb meeting, as had been widely expected. There were few changes to the statement, retaining language about ongoing increases being appropriate but shifting a reference to the future from discussing the “pace” of hikes to their “extent”. But the biggest surprise was Chair Powell’s more-dovish tone in the follow-up press conference. While the market had expected a hawkish tone, with Powell actively pushing back on market expectations amid the recent loosening of financial conditions, this was not a major focus of his commentary. Instead, there were notes that the disinflationary process has started, that the Fed is not watching short-term market moves, and that a soft landing remains his base case. The meeting seemed to cement market expectations for rates to top out at 5% at the March meeting, and the market staged a rally in its wake.
US equities were mostly higher this week, with several major indices continuing to rally off their 2022 lows. The S&P 500 is now up 15.6% since 12-Oct and the Nasdaq is up 17.6% since just 28-Dec. Treasuries were mostly weaker with the curve flattening; strength from earlier in the week was offset by a big slide in the wake of a stronger-than-expected January nonfarm payrolls report. The dollar was stronger on the major crosses, particularly vs the yen; again, Friday’s rally was a major factor in the greenback’s outperformance. Gold was down 2.4%, its largest weekly loss since October and following six consecutive week;y gains. Oil was lower, with WTI settling down 7.9% for the week amid some persistent concerns about the path toward increased China demand.
The path of least resistance remained to the upside this week despite continued concerns about the underpinnings of the recent rally. COntinued evidence of disinflation, a resilient labor market, and the Fed nearing the end of its rate-hiking campaign served to bolster expectations for a soft landing ahead. And while corporate earnings have continued to come in below expectations, the market seems to have meaningfully lowered the bar. Positioning and sentiment have also played into the market mood, and there has been more discussion of FOMO as a supportive factor. Nevertheless, there have also been calls for caution, with some sense the market may be overbought at current levels and may require some period of digestion before moving higher. The resilience of the labor market (reflected in this week’s January payrolls report) has also lifted expectations for the Fed’s terminal rate, and it remains very uncertain that policymakers will be eager to make the H2 rate cuts that are currently priced in. Recession signals (such as the deeply inverted yield curve) continue to blare, and it remains to be seen ow much Fed tightening is really being reflected in the data given the oft-cited long and variable lags. Geopolitical worries are also coming back into the mix with building operations in Ukraine and some tensions with China coming to the fore on Friday amid a spy-balloon squabble.
It was a big week for Q4 earnings, with 107 S&P constituents on the calendar including several megacap names. And with ~50% of S&P companies now having reported, the blended earnings growth rate stands at 5.3% y/y, well below the 3.2% expected at the end of the quarter. Some 70% of Q4 reporters have beaten consensus earnings expectations, though this is below the one- and five-year averages (the magnitude of earnings beats has also been well below recent history). But at the same time, the market has been rewarding earnings beats more than average, lending further support to the idea that despite recent worries about earnings resilience, the bar has been lowered. Given this week’s surprisingly robust January payrolls report, there is likely to be a lot of attention on Fedspeak as it resumes next week after the recent pre-FOMC quiet period. Fed Chair Powell himself will be in the spotlight for comments on Tuesday 7-Feb before the Economic Club of New York. There are also scheduled appearances from Vice Chair Barr, Governor Waller, and regional Presidents Williams, Bullard, Bostic, and Harker (and likely other media appearances). It will be a fairly light week on the economic front, with only jobless claims (Thursday) and the initial UMich February consumer sentiment reading (Friday) of note. The q4 earnings season continues rolling forward next week, with 95 S&P constituents to report in a slight downtick from this past week’s pace.

Fixed Income
Yield Curve
December FOMC Statement December Fed Minutes Balance Sheet Reduction Plan Credit, Liquidity and Balance Sheet Federal Reserve Dot Plots
Treasury.gov yields FOMC Policy Normalization Statement Longer- Run Goals Jan 2022
Foreign Exchange Market
Energy Complex
The Baker Hughes rig count was down by 12 this week. There are 759 oil and gas rigs operating in the US – Up 146 over last year.
Metals Complex
Employment Picture
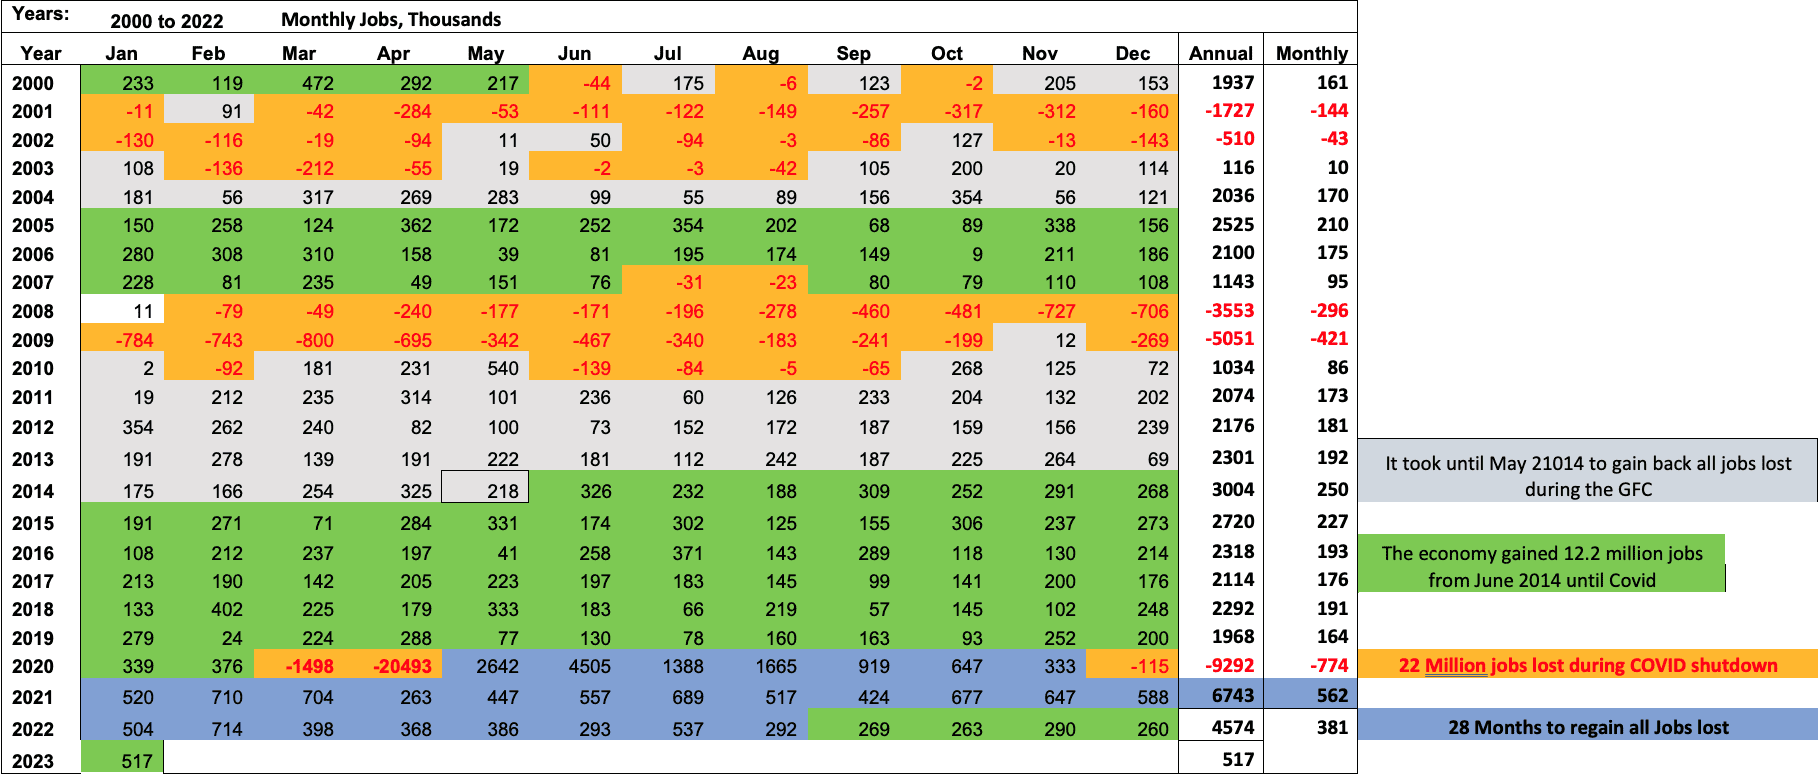
January Jobs Report – BLS Summary – Released 2/3/2023 – The US Economy added 517k nonfarm jobs in January and the Unemployment rate declined to 3.4%. Average hourly earnings increased 10 cents to $33.03. Hiring highlights include +128k Leisure and Hospitality, +105k Education and Health Services, and +82 Professional and Business Services.
- Average hourly earnings increased 10 cents/0.3% to $33.03.
- U3 unemployment rate declined 0.1% to 3.4%. U6 unemployment rate increased 0.1% to 6.6%.
- The labor force participation rate was little changed at 62.4%.
- Average work week increased by 0.3 to 34.7 hours.
Weekly Unemployment Claims – Released Thursday 2/2/2023 – The week ending January 28th observed a decrease of 3k in initial claims decreasing to 183k. The four-week moving average of initial jobless claims was down 5.75k to 191.75k.
Job Openings & Labor Turnover Survey JOLTS – Released 2/1/2023 – The number of job openings increased to 11 million on the last business day of December, the US Bureau of Labor Statistics reported. Over the month, the number of hires and total separations changed little at 6.2 million and 5.9 million, respectively. Within separations, quits (4.1 million) and layoffs and discharges (1.5 million) changed little.
Employment Cost Index – Released 1/31/2023 – Compensation costs for civilian workers increased 1% for the 3-month period ending in December 2022. The 12-month period ending in December 2022 saw compensation costs increase by 5.1%. The 12-month period ending December 2021 increased 4%. Wages and salaries increased 5.1% over the year and increased 4.5% for the 12-month period ending in December 2021. Benefit costs increased 4.9% over the year and increased 2.8% for the 12-month period ending in December 2021. This report is published quarterly.
This Week’s Economic Data
Links take you to the data source
PMI Non-Manufacturing Index – Released 2/3/2023 – Economic activity grew in January after entering contraction territory in December. The Services PMI® registered 55.2%, 6 percentage points higher than December. In December the Services PMI® registered 49.2%.
PMI Manufacturing Index – Released 2/1/2023 – The January Manufacturing PMI® registered 47.4%, 1 percentage point lower than the 48.4% recorded in December, REgarding the overall economy, this figure indicates two months of contraction following 30 months of expansion. The Manufacturing PMI® figure is the lowest since May 2020, when it registered 43.5%. The New Orders Index remained in contraction territory at 42.5%, 2.6 percentage points lower than the 45.1% recorded in December.
U.S. Construction Spending – Released 2/1/2023 – Construction spending during December 2022 was estimated at a seasonally adjusted annual rate of $1,809.8 billion, 0.4% above the revised November estimate of $1,817.3 billion. The December figure is 7.7% above the December 2021 estimate of $1,681 billion. Over the year, construction spending amounted to $1,792.9 billion, 10.2% above the $1,626.4 billion for the same period in 2021.
Chicago PMI – Released 1/31/2023 – Chicago PMI remained in contraction territory but decreased in January to 44.3 points from 44.9 points in December.
Consumer Confidence – Released 1/31/2023 – The Conference Board Consumer COnfidence Index® decreased in January. The Index now stands at 107.1 (1985=100), down from 109 in December.
Recent Economic Date
Links take you to the data source
US Light Vehicle Sales – Released 1/27/2023 – US light vehicle sales were at a seasonally adjusted annual rate of 13.314 million units in December.
Personal Income – Released 1/27/2023 – Personal income increased $49.5 billion, or 0.2% in December. Disposable Personal Income increased $49.2 billion or 0.3%. Personal COnsumption Expenditure decreased $41.6 billion or 0.2%.
Durable Goods – Released 1/26/2023 – New orders for manufactured durable goods in December increased $15.3 billion or 5.6% to $286.9 billion. Transportation equipment increased up $15.5 billion or 16.7% to $108.1 billion.
New Residential Sales – Released 1/26/2023 – Sales of new single-family homes increased 2.3% to 616k, seasonally adjusted, in December. The median sales price of new homes sold in December was $442,100 with an average sales price of $528,400. At the end of December, the seasonally adjusted estimate of new homes for sale was 461k. This represents a supply of 9 months at the current sales rate.
First Estimate of 4th Quarter 2022 GDP – Released 1/26/2023 – Real Gross Domestic Product (GDP) increased at an annual rate of 2.9% in the fourth quarter of 2022 according to the advanced estimate released by the Bureau of Economic Analysis, following an increase of 3.2% in the third quarter of 2022. The GDP estimate released today is based on source data that are incomplete or subject to further revision. The increase in real GDP reflected increases in private inventory investment, consumer spending, federal government spending, state and local government spending, and nonresidential fixed investment that were partly offset by decreases in residential fixed investment and exports. Imports, which are a subtraction in the calculation of GDP, decreased.
Existing Home Sales – Released 1/20/2023 – Existing home sales decreased in December marking eleven consecutive months of declines. Sales declined 1.5% to a seasonally adjusted rate of 4.02 million in December. Sales decreased 34% year-over-year. Housing inventory sits at 970k units. Down 13.4% from November’s inventory. Up 10.2% over last year. Unsold inventory sits at a 2.9-month supply. The median existing home price for all housing types was $366,900 which is up 2.3% from December 2021. This marks 130 consecutive months of year-over-year increases, the longest-running streak on record.
Housing Starts – Released 1/19/2023 – New home starts in December were at a seasonally adjusted annual rate of 1.382 million; down 1.4% below November, and 21.8% below last December’s rate. Building Permits were at a seasonally adjusted annual rate of 1.33 million, down 1.6% compared to November, and down 29.9% over last year.
Industrial Production and Capacity Utilization – Released 1/18/2023 – In December, Industrial production decreased 0.7%. Manufacturing decreased 1.3%. Utilities output increased 38%. Mining output decreased 0.9%. Total industrial production was 1.6% higher in December than a year ago. Total capacity utilization decreased 0.6% in December to 78.8% which is 0.8% below its long run average.
Retail Sales – Released 1/18/2023 – US retail sales for December decreased 1.1% to $677.1 billion but retail sales are 6% above December 2021. US retail sales for the October 2022 through December 2022 period were up 6.7% from the same period a year ago.
Producer Price Index – Released 1/18/2023 – The PPI for final demand declined 0.5% in December, seasonally adjusted, the US Bureau of Labor Statistics reposted. Final demand prices advanced 0.2% in November and 0.4% in October, On an unadjusted basis, the index for final demand increased 6.2% in 2022 after rising 10% in 2021.
Consumer Price Index – Released 1/12/2023 – Consumer prices decreased 0.1% m/m in December following a 0.1% increase in November. Consumer prices are up 6.5% for the 12-month period ending in December. Core consumer prices increased 0.3% m/m in December.
Consumer Credit – Released 1/9/2023 – In November, consumer credit increased at a seasonally adjusted annual rate of 7.1%. Revolving credit increased at an annual rate of 16.9%, while nonrevolving credit increased at an annual rate of 3.9%.
U.S. Trade Balance – Released 1/5/2023 – The US monthly international trade deficit decreased in NOvember 2022 according to the US Bureau of Economic Analysis and the US Census Bureau. The deficit decreased from $77.8 billion in Octember (revised) to $61.5 billion in November. November exports were $251.9 billion, $5.1 billion less than October exports. November imports were $313.4 billion, $21.5 billion less than October imports. Year-to-date, the goods and services deficit increased $120.1 billion, or 15.7%, from the same period in 2021. Exports increased $439.4 billion or 18.9%. Imports increased $559.5 billion or 18.1%.
Next week we get data on US Trade Balance and Consumer Credit.
Data Sources:
Bureau of Economic Analysis (BEA)
Congressional Budget Office (CBO)
U.S. Bureau of Labor Statistics (BLS)
Federal Reserve Economic Data (FRED Charts)
CME Fed Watch
U.S. Treasury – Yields
U.S. Census Bureau
Institute for Supply Management (ISM)
Weekly DOL Employment Data
BLS Monthly Jobs Report
JOLTS
US Energy Admin (EIA)
BLS Consumer Price Index CPI
BLS Producer Price Index PPI
Atlanta Fed GDPNOW
NY Fed Nowcast GDP
US Census Bureau Housing Starts
Consumer Credit
USCB Retail Sales
Construction Spending
Federal Reserve Dot Plots
NY Empire Index
Philadelphia Federal Reserve
P/E Ratio Data -Yardeni Research
Technical Analysis Info:
StockCharts.com – Financial Charts
Exponential vs Simple moving average
Other Links:
1973 Arab Oil Embargo
Hunt Brothers Silver
Long-Term Capital bailout


Week 5 Talking Points
Table of Contents
Good Life Advisors – Talking Points – Week 5
Fed Hikes 25 bp as Expected, but a Gangbuster Jobs Report Complicates the Feds Path
Despite forecasts looking for a continued softening along the lines of recent months, the headline January nonfarm payrolls showed the Economy created 517k jobs in January (vs a 190k consensus). The unemployment rate unexpectedly dropped to 3.4%, hitting the lowest mark since 1969. Average hourly earnings came in at 0.3% m/m (+4.3% y/y), in line with consensus. While multiple analysts had discussed upside risks into the report (including the return of striking California University workers and warmer weather0, the magnitude of the headline increase seemed to take the market by surprise and sparked a vigorous conversation about how much of the surprise was due to seasonal adjustment factors. That said, the report did provide evidence for a labor market that has remained resilient despite the Fed’s hiking campaign, which may be supportive of the soft-landing thesis. At the same time, the report heightened market expectations for the Fed to raise rates above 5% before pausing. The report also dampened expectations of a Fed cut later this year.
The FOMC raised rates by 25 bp to 4.5-4.75% at its 3-Feb meeting, as had been widely expected. There were few changes to the statement, retaining language about ongoing increases being appropriate but shifting a reference to the future from discussing the “pace” of hikes to their “extent”. But the biggest surprise was Chair Powell’s more-dovish tone in the follow-up press conference. While the market had expected a hawkish tone, with Powell actively pushing back on market expectations amid the recent loosening of financial conditions, this was not a major focus of his commentary. Instead, there were notes that the disinflationary process has started, that the Fed is not watching short-term market moves, and that a soft landing remains his base case. The meeting seemed to cement market expectations for rates to top out at 5% at the March meeting, and the market staged a rally in its wake.
US equities were mostly higher this week, with several major indices continuing to rally off their 2022 lows. The S&P 500 is now up 15.6% since 12-Oct and the Nasdaq is up 17.6% since just 28-Dec. Treasuries were mostly weaker with the curve flattening; strength from earlier in the week was offset by a big slide in the wake of a stronger-than-expected January nonfarm payrolls report. The dollar was stronger on the major crosses, particularly vs the yen; again, Friday’s rally was a major factor in the greenback’s outperformance. Gold was down 2.4%, its largest weekly loss since October and following six consecutive week;y gains. Oil was lower, with WTI settling down 7.9% for the week amid some persistent concerns about the path toward increased China demand.
The path of least resistance remained to the upside this week despite continued concerns about the underpinnings of the recent rally. COntinued evidence of disinflation, a resilient labor market, and the Fed nearing the end of its rate-hiking campaign served to bolster expectations for a soft landing ahead. And while corporate earnings have continued to come in below expectations, the market seems to have meaningfully lowered the bar. Positioning and sentiment have also played into the market mood, and there has been more discussion of FOMO as a supportive factor. Nevertheless, there have also been calls for caution, with some sense the market may be overbought at current levels and may require some period of digestion before moving higher. The resilience of the labor market (reflected in this week’s January payrolls report) has also lifted expectations for the Fed’s terminal rate, and it remains very uncertain that policymakers will be eager to make the H2 rate cuts that are currently priced in. Recession signals (such as the deeply inverted yield curve) continue to blare, and it remains to be seen ow much Fed tightening is really being reflected in the data given the oft-cited long and variable lags. Geopolitical worries are also coming back into the mix with building operations in Ukraine and some tensions with China coming to the fore on Friday amid a spy-balloon squabble.
It was a big week for Q4 earnings, with 107 S&P constituents on the calendar including several megacap names. And with ~50% of S&P companies now having reported, the blended earnings growth rate stands at 5.3% y/y, well below the 3.2% expected at the end of the quarter. Some 70% of Q4 reporters have beaten consensus earnings expectations, though this is below the one- and five-year averages (the magnitude of earnings beats has also been well below recent history). But at the same time, the market has been rewarding earnings beats more than average, lending further support to the idea that despite recent worries about earnings resilience, the bar has been lowered. Given this week’s surprisingly robust January payrolls report, there is likely to be a lot of attention on Fedspeak as it resumes next week after the recent pre-FOMC quiet period. Fed Chair Powell himself will be in the spotlight for comments on Tuesday 7-Feb before the Economic Club of New York. There are also scheduled appearances from Vice Chair Barr, Governor Waller, and regional Presidents Williams, Bullard, Bostic, and Harker (and likely other media appearances). It will be a fairly light week on the economic front, with only jobless claims (Thursday) and the initial UMich February consumer sentiment reading (Friday) of note. The q4 earnings season continues rolling forward next week, with 95 S&P constituents to report in a slight downtick from this past week’s pace.
Fixed Income
Yield Curve
December FOMC Statement December Fed Minutes Balance Sheet Reduction Plan Credit, Liquidity and Balance Sheet Federal Reserve Dot Plots
Treasury.gov yields FOMC Policy Normalization Statement Longer- Run Goals Jan 2022
Foreign Exchange Market
Energy Complex
The Baker Hughes rig count was down by 12 this week. There are 759 oil and gas rigs operating in the US – Up 146 over last year.
Metals Complex
Employment Picture
January Jobs Report – BLS Summary – Released 2/3/2023 – The US Economy added 517k nonfarm jobs in January and the Unemployment rate declined to 3.4%. Average hourly earnings increased 10 cents to $33.03. Hiring highlights include +128k Leisure and Hospitality, +105k Education and Health Services, and +82 Professional and Business Services.
Weekly Unemployment Claims – Released Thursday 2/2/2023 – The week ending January 28th observed a decrease of 3k in initial claims decreasing to 183k. The four-week moving average of initial jobless claims was down 5.75k to 191.75k.
Job Openings & Labor Turnover Survey JOLTS – Released 2/1/2023 – The number of job openings increased to 11 million on the last business day of December, the US Bureau of Labor Statistics reported. Over the month, the number of hires and total separations changed little at 6.2 million and 5.9 million, respectively. Within separations, quits (4.1 million) and layoffs and discharges (1.5 million) changed little.
Employment Cost Index – Released 1/31/2023 – Compensation costs for civilian workers increased 1% for the 3-month period ending in December 2022. The 12-month period ending in December 2022 saw compensation costs increase by 5.1%. The 12-month period ending December 2021 increased 4%. Wages and salaries increased 5.1% over the year and increased 4.5% for the 12-month period ending in December 2021. Benefit costs increased 4.9% over the year and increased 2.8% for the 12-month period ending in December 2021. This report is published quarterly.
This Week’s Economic Data
Links take you to the data source
PMI Non-Manufacturing Index – Released 2/3/2023 – Economic activity grew in January after entering contraction territory in December. The Services PMI® registered 55.2%, 6 percentage points higher than December. In December the Services PMI® registered 49.2%.
PMI Manufacturing Index – Released 2/1/2023 – The January Manufacturing PMI® registered 47.4%, 1 percentage point lower than the 48.4% recorded in December, REgarding the overall economy, this figure indicates two months of contraction following 30 months of expansion. The Manufacturing PMI® figure is the lowest since May 2020, when it registered 43.5%. The New Orders Index remained in contraction territory at 42.5%, 2.6 percentage points lower than the 45.1% recorded in December.
U.S. Construction Spending – Released 2/1/2023 – Construction spending during December 2022 was estimated at a seasonally adjusted annual rate of $1,809.8 billion, 0.4% above the revised November estimate of $1,817.3 billion. The December figure is 7.7% above the December 2021 estimate of $1,681 billion. Over the year, construction spending amounted to $1,792.9 billion, 10.2% above the $1,626.4 billion for the same period in 2021.
Chicago PMI – Released 1/31/2023 – Chicago PMI remained in contraction territory but decreased in January to 44.3 points from 44.9 points in December.
Consumer Confidence – Released 1/31/2023 – The Conference Board Consumer COnfidence Index® decreased in January. The Index now stands at 107.1 (1985=100), down from 109 in December.
Recent Economic Date
Links take you to the data source
US Light Vehicle Sales – Released 1/27/2023 – US light vehicle sales were at a seasonally adjusted annual rate of 13.314 million units in December.
Personal Income – Released 1/27/2023 – Personal income increased $49.5 billion, or 0.2% in December. Disposable Personal Income increased $49.2 billion or 0.3%. Personal COnsumption Expenditure decreased $41.6 billion or 0.2%.
Durable Goods – Released 1/26/2023 – New orders for manufactured durable goods in December increased $15.3 billion or 5.6% to $286.9 billion. Transportation equipment increased up $15.5 billion or 16.7% to $108.1 billion.
New Residential Sales – Released 1/26/2023 – Sales of new single-family homes increased 2.3% to 616k, seasonally adjusted, in December. The median sales price of new homes sold in December was $442,100 with an average sales price of $528,400. At the end of December, the seasonally adjusted estimate of new homes for sale was 461k. This represents a supply of 9 months at the current sales rate.
First Estimate of 4th Quarter 2022 GDP – Released 1/26/2023 – Real Gross Domestic Product (GDP) increased at an annual rate of 2.9% in the fourth quarter of 2022 according to the advanced estimate released by the Bureau of Economic Analysis, following an increase of 3.2% in the third quarter of 2022. The GDP estimate released today is based on source data that are incomplete or subject to further revision. The increase in real GDP reflected increases in private inventory investment, consumer spending, federal government spending, state and local government spending, and nonresidential fixed investment that were partly offset by decreases in residential fixed investment and exports. Imports, which are a subtraction in the calculation of GDP, decreased.
Existing Home Sales – Released 1/20/2023 – Existing home sales decreased in December marking eleven consecutive months of declines. Sales declined 1.5% to a seasonally adjusted rate of 4.02 million in December. Sales decreased 34% year-over-year. Housing inventory sits at 970k units. Down 13.4% from November’s inventory. Up 10.2% over last year. Unsold inventory sits at a 2.9-month supply. The median existing home price for all housing types was $366,900 which is up 2.3% from December 2021. This marks 130 consecutive months of year-over-year increases, the longest-running streak on record.
Housing Starts – Released 1/19/2023 – New home starts in December were at a seasonally adjusted annual rate of 1.382 million; down 1.4% below November, and 21.8% below last December’s rate. Building Permits were at a seasonally adjusted annual rate of 1.33 million, down 1.6% compared to November, and down 29.9% over last year.
Industrial Production and Capacity Utilization – Released 1/18/2023 – In December, Industrial production decreased 0.7%. Manufacturing decreased 1.3%. Utilities output increased 38%. Mining output decreased 0.9%. Total industrial production was 1.6% higher in December than a year ago. Total capacity utilization decreased 0.6% in December to 78.8% which is 0.8% below its long run average.
Retail Sales – Released 1/18/2023 – US retail sales for December decreased 1.1% to $677.1 billion but retail sales are 6% above December 2021. US retail sales for the October 2022 through December 2022 period were up 6.7% from the same period a year ago.
Producer Price Index – Released 1/18/2023 – The PPI for final demand declined 0.5% in December, seasonally adjusted, the US Bureau of Labor Statistics reposted. Final demand prices advanced 0.2% in November and 0.4% in October, On an unadjusted basis, the index for final demand increased 6.2% in 2022 after rising 10% in 2021.
Consumer Price Index – Released 1/12/2023 – Consumer prices decreased 0.1% m/m in December following a 0.1% increase in November. Consumer prices are up 6.5% for the 12-month period ending in December. Core consumer prices increased 0.3% m/m in December.
Consumer Credit – Released 1/9/2023 – In November, consumer credit increased at a seasonally adjusted annual rate of 7.1%. Revolving credit increased at an annual rate of 16.9%, while nonrevolving credit increased at an annual rate of 3.9%.
U.S. Trade Balance – Released 1/5/2023 – The US monthly international trade deficit decreased in NOvember 2022 according to the US Bureau of Economic Analysis and the US Census Bureau. The deficit decreased from $77.8 billion in Octember (revised) to $61.5 billion in November. November exports were $251.9 billion, $5.1 billion less than October exports. November imports were $313.4 billion, $21.5 billion less than October imports. Year-to-date, the goods and services deficit increased $120.1 billion, or 15.7%, from the same period in 2021. Exports increased $439.4 billion or 18.9%. Imports increased $559.5 billion or 18.1%.
Next week we get data on US Trade Balance and Consumer Credit.
Data Sources:
Bureau of Economic Analysis (BEA)
Congressional Budget Office (CBO)
U.S. Bureau of Labor Statistics (BLS)
Federal Reserve Economic Data (FRED Charts)
CME Fed Watch
U.S. Treasury – Yields
U.S. Census Bureau
Institute for Supply Management (ISM)
Weekly DOL Employment Data
BLS Monthly Jobs Report
JOLTS
US Energy Admin (EIA)
BLS Consumer Price Index CPI
BLS Producer Price Index PPI
Atlanta Fed GDPNOW
NY Fed Nowcast GDP
US Census Bureau Housing Starts
Consumer Credit
USCB Retail Sales
Construction Spending
Federal Reserve Dot Plots
NY Empire Index
Philadelphia Federal Reserve
P/E Ratio Data -Yardeni Research
Technical Analysis Info:
StockCharts.com – Financial Charts
Exponential vs Simple moving average
Other Links:
1973 Arab Oil Embargo
Hunt Brothers Silver
Long-Term Capital bailout
Categories:
Tags: