Good Life Advisors – Talking Points – Week 6
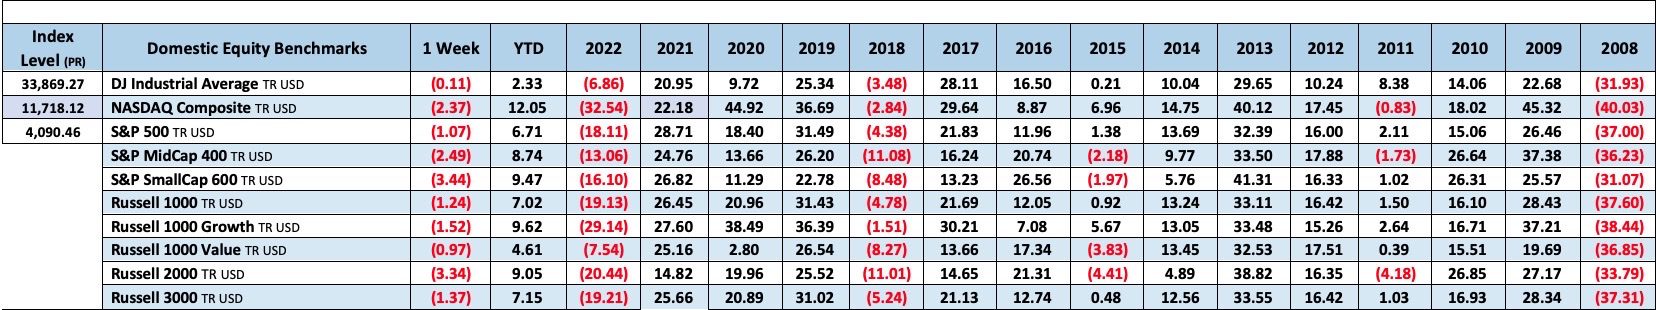
Stocks give back some of the strong YTD gains amid big backup in yields with a number of moving pieces in play.
The S&P and Nasdaq also both posted the worst weekly performances since mid-December. Value beat growth and large beat small. Some of the worst performers included FANMAGs internet, media, homebuilders, apparel, department stores, trucking, airlines, specialty chemicals, steel, and precious metals miners. Semis and banks were in line. Outperformers included A&D ( China tensions), grocers, beverages, insurance, exchanges, managed care, pharma, healthcare distributors, ag chemicals, oil majors, and E&Ps. Treasuries saw a big backup in yields with the curve flattening. The dollar index was up 0.6%, with the biggest gains against the euro and ending modestly firmer on the yen cross in a volatile week. Gold was down 0.2% for the week. WTI crude was up 8.6%, reversing last week’s 7.9% decline and the best week since early October.
Treasuries turned into a headwind amid a repricing of the Fed rate path. The move was driven in part by some updates that added uncertainty around the disinflation narrative, including a rise in January used vehicle prices and Friday’s February Michigan consumer sentiment report that showed a 0.3pp increase in 1Y inflation expectations to 4.2%. The policy-sensitive 2Y yield rose to the highest levels since November, while markets are now pricing in a peak fed funds rate of `5.15% and one rate cut by year-end, up from around 4.9% last Thursday and two 2023 cuts. Yield curve signaling also reflected more recession fears, with the 2Y/10Y spread hitting -80 bp, its most inverted point since the early 1980s.
There has also been more focus on the waning tailwind from seasonality and positioning, with noting that the market is now closest to neutral positioning since Q2-22 after cutting $300B of bearish bets. JPMorgan also noted hedge fund de-grossing may also be nearing an end and coincide with a near-term reversal of recent strength, However, some positioning and sentiment tailwinds were also seen in latest AAII survey, which showed investors net bullish for the first time in almost a year, and the most bullish since Nov-21. JPMorgan also pointed out net flows to TMT and Consumer Discretionary still have plenty of room to turn more positive over the next few months. Some of the other bullish narratives included the “no landing” argument given resilient economic and labor market data, as well as thoughts on an artificially-inflated payrolls print, Powell’s acknowledgement that data dependence can work in both directions, and corporate cost-cutting actions helping offset underwhelming earnings and guidance metrics.
In his appearance at the Economic Club of Washington, Fed Chair Powell mostly repeated his post-FOMC press conference remarks. Powell again said that disinflation has begun but has a long way to go, and more rate increases are probably needed. He also noted that the labor market is at least at maximum employment, while he thinks it will be into next year before inflation is down close to 2%. Powell also said the Fed isn’t looking at changes to conditions after last week’s January payrolls report. However, some takeaways highlighted the hawkish, relentless “higher-for-longer” messaging, which was reiterated by other Fed officials this week including Fed Governor Waller and Minneapolis’ Kaskhari.
Earnings and guidance metrics have continued to broadly underwhelm, though the bar has been substantially lowered and strategists have highlighted positive takeaways around cost cutting, moderating input prices pressures, better supply chain dynamics, and FX and China swinging from a headwind to a tailwind throughout the year.
Next week brinds a much busier slate of macro data. January CPI is expected to show a headline acceleration to 0.5% m/m after December’s 0.1%, though the annualized increase is expected to drop 0.3pp to 6.2%. Core prices expected tick down 0.1pp to 0.3% m/m. The report will be particularly meaningful given the growing doubts around about a smooth disinflationary path. January retail sales is expected to rebound to a 0.7% m/m rise following December’s 1.1% contraction. A number of regional manufacturing indexes are also set for release, including Empire State index and Philly Fed index.

Fixed Income
Yield Curve
December FOMC Statement December Fed Minutes Balance Sheet Reduction Plan Credit, Liquidity and Balance Sheet Federal Reserve Dot Plots
Treasury.gov yields FOMC Policy Normalization Statement Longer- Run Goals Jan 2022
Foreign Exchange Market
Energy Complex
The Baker Hughes rig count was up by 2 this week. There are 761 oil and gas rigs operating in the US – Up 126 over last year.
Metals Complex
Employment Picture
Weekly Unemployment Claims – Released Thursday 2/9/2023 – The week ending February 4th observed an increase of 13k in initial claims increasing to 196k. The four-week moving average of initial jobless claims was down 2.5k to 189.25k.
January Jobs Report – BLS Summary – Released 2/3/2023 – The US Economy added 517k nonfarm jobs in January and the Unemployment rate declined to 3.4%. Average hourly earnings increased 10 cents to $33.03. Hiring highlights include +128k Leisure and Hospitality, +105k Education and Health Services, and +82 Professional and Business Services.
- Average hourly earnings increased 10 cents/0.3% to $33.03.
- U3 unemployment rate declined 0.1% to 3.4%. U6 unemployment rate increased 0.1% to 6.6%.
- The labor force participation rate was little changed at 62.4%.
- The labor force participation rate was little changed at 62.4%.
- Average work week increased by 0.3 to 34.7 hours.
Job Openings & Labor Turnover Survey JOLTS – Released 2/1/2023 – The number of job openings increased to 11 million on the last business day of December, the US Bureau of Labor Statistics reported. Over the month, the number of hires and total separations changed little at 6.2 million and 5.9 million, respectively. Within separations, quits (4.1 million) and layoffs and discharges (1.5 million) changed little.
Employment Cost Index – Released 1/31/2023 – Compensation costs for civilian workers increased 1% for the 3-month period ending in December 2022. The 12-month period ending in December 2022 saw compensation costs increase by 5.1%. The 12-month period ending December 2021 increased 4%. Wages and salaries increased 5.1% over the year and increased 4.5% for the 12-month period ending in December 2021. Benefit costs increased 4.9% over the year and increased 2.8% for the 12-month period ending in December 2021. This report is published quarterly.
This Week’s Economic Data
Links take you to the data source
Consumer Credit – Released 2/7/2023 – In December, consumer credit increased at a seasonally adjusted annual rate of 7.8%. revolving credit increased at an annual rate of 14.8%, while nonrevolving credit increased at an annual rate of 5.6%.
U.S. Trade Balance – Released 2/7/2023 – The US monthly international trade deficit increased in December 2022 according to the US Bureau of Economic Analysis and the US Census BUreau. The deficit increased from $61 billion in November (revised) to $67.4 billion in December. December exports were $250.2 billion, $2.2 billion less than November exports. December imports were $317.6 billion, $4.2 billion more than November imports. In 2022, the goods and services deficit increased $103 billion, or 12.2%, from 2021. Exports increased $453.1 billion or 17.7%. Imports increased $556.1 billion or 16.3%.
Recent Economic Date
Links take you to the data source
PMI Non-Manufacturing Index – Released 2/3/2023 – Economic activity grew in January after entering contraction territory in December. The Services PMI® registered 55.2%, 6 percentage points higher than December. In December the Services PMI® registered 49.2%.
PMI Manufacturing Index – Released 2/1/2023 – The January Manufacturing PMI® registered 47.4%, 1 percentage point lower than the 48.4% recorded in December, Regarding the overall economy, this figure indicates two months of contraction following 30 months of expansion. The Manufacturing PMI® figure is the lowest since May 2020, when it registered 43.5%. The New Orders Index remained in contraction territory at 42.5%, 2.6 percentage points lower than the 45.1% recorded in December.
U.S. Construction Spending – Released 2/1/2023 – Construction spending during december 2022 was estimated at a seasonally adjusted annual rate of $1,809.8 billion, 0.4% above the revised November estimate of $1,817.3 billion. The December figure is 7.7% above the December 2021 estimate of $1,681 billion. Over the year, construction spending amounted to $1,792.9billion, 10.2% above the $1,626.4 billion for the same period in 2021.
Chicago PMI – Released 1/31/2023 – Chicago PMI remained in contraction territory but decreased in January to 44.3 points from 44.9 points in December.
Consumer Confidence – Released 1/31/2023 – The Conference Board Consumer Confidence Index® decreased in January. The Index now stands at 107.1 (1985=100), down from 109 in December.
US Light Vehicle Sales – Released 1/27/2023 – US light vehicle sales were at a seasonally adjusted annual rate of 13.314 million units in December.
Personal Income – Released 1/27/2023 – Personal income increased $49.5 billion, or 0.2% in December, Disposable Personal Income increased $49.2 billion or 0.3%. Personal Consumption Expenditure decreased $41.6 billion or 0.2%.
Durable Goods – Released 1/26/2023 – New orders for manufactured durable goods in December increased $15.3 billion or 5.6% to $286.9 billion. Transportation equipment increased up $15.5 billion or 16.7% to $108.1 billion.
New Residential Sales – Released 1/26/2023 – Sales of new single-family homes increased 2.3% to 616k, seasonally adjusted, in December. The median sales price of new homes sold in December was $442, 100 with an average sales price of $528,400. At the end of December, the seasonally adjusted estimate of new homes soles in December was $442,100 with an average sales price of $528,400. At the end of December, the seasonally adjusted estimate of new homes for sale was 461k. This represents a supply of 9 months at the current sales rate.
First Estimate of 4th Quarter 2022 GDP – Released 1/26/2023 – Real gross domestic product (GDP) increased at an annual rate of 2.9% in the fourth quarter of 2022 according to the advanced estimate released by the Bureau of Economic Analysis, following an increase of 3.2% in the third quarter of 2022. The GDP estimate released today is based on source data that are incomplete or subject to further revision. The increase in real GDP reflected increases in private inventory investment, consumer spending, federal government spending, state and local government spending, and nonresidential fixed investment that were partly offset by decreases in residential fixed investment and exports. Imports, which are a subtraction in the calculation of GDP, decreased.
Existing Home Sales – Released 1/20/2023 – Existing home sales decreased in December marking eleven consecutive months of declines. Sales declined 1.5% to a seasonally adjusted rate of 4.02 million in December. Sales decreased 34% year-over-year. Housing inventory sits at 970k units, down 13.4% from November’s inventory, up 10.2% over last year. Unsold inventory sits at a 2.9-month supply. The median existing home price for all housing types was $366,900 which is up 2.3% from December 2021. This marks 130 consecutive months of year-over-year increases, the longest-running streak of record.
Housing Starts – Released 1/19/2023 – New home starts in December were at a seasonally adjusted annual rate of 1.382 million; down 1.4% below November, and 21.8% below last December’s rate. Building Permits were at a seasonally adjusted annual rate of 1.33 million, down 1.6% compared to November, and down 29.9% over last year.
Industrial Production and Capacity Utilization – Released 1/18/2023 – In December, Industrial production decreased 0.7%. Manufacturing decreased 1.3%. Utilities output increased 3.8%. Mining output decreased 0.9%. Total industrial production was 1.6% higher in December than a year ago. Total capacity utilization decreased 0.6% in December to 78.8% which is 0.8% below its long run average.
Retail Sales – Released 1/18/2023 – US retail sales for December decreased 1.1% to $677.1 billion but retail sales are 6% above December 2021. US retail sales for the October 2022 through December 2022 period were up 6.7% from the same period a year ago.
Producer Price Index – Released 1/18/2023 – The PPI for final demand declined 0.5% in December, seasonally adjusted, the US Bureau of Labor Statistics reported. Final demand prices advanced 0.2% in November and 0.4% in October. On an unadjusted basis, the index for final demand increased 6.2% in 2022 after rising 10% in 2021.
Consumer Price Index – Released 1/12/2023 – Consumer prices decreased 0.1% m/m in December following a 0.1% increase in November. Consumer prices are up 6.5% for the 12-month period ending in December. Core consumer prices increased 0.3% m/m in December.
Next week we get data on CPI, PPI, Retail Sales, Industrial Production and Capacity Utilization, and Housing Starts.
Data Sources:
Bureau of Economic Analysis (BEA)
Congressional Budget Office (CBO)
U.S. Bureau of Labor Statistics (BLS)
Federal Reserve Economic Data (FRED Charts)
CME Fed Watch
U.S. Treasury – Yields
U.S. Census Bureau
Institute for Supply Management (ISM)
Weekly DOL Employment Data
BLS Monthly Jobs Report
JOLTS
US Energy Admin (EIA)
BLS Consumer Price Index CPI
BLS Producer Price Index PPI
Atlanta Fed GDPNOW
NY Fed Nowcast GDP
US Census Bureau Housing Starts
Consumer Credit
USCB Retail Sales
Construction Spending
Federal Reserve Dot Plots
NY Empire Index
Philadelphia Federal Reserve
P/E Ratio Data -Yardeni Research
Technical Analysis Info:
StockCharts.com – Financial Charts
Exponential vs Simple moving average
Other Links:
1973 Arab Oil Embargo
Hunt Brothers Silver
Long-Term Capital bailout


Week 6 Talking Points
Table of Contents
Good Life Advisors – Talking Points – Week 6
Stocks give back some of the strong YTD gains amid big backup in yields with a number of moving pieces in play.
The S&P and Nasdaq also both posted the worst weekly performances since mid-December. Value beat growth and large beat small. Some of the worst performers included FANMAGs internet, media, homebuilders, apparel, department stores, trucking, airlines, specialty chemicals, steel, and precious metals miners. Semis and banks were in line. Outperformers included A&D ( China tensions), grocers, beverages, insurance, exchanges, managed care, pharma, healthcare distributors, ag chemicals, oil majors, and E&Ps. Treasuries saw a big backup in yields with the curve flattening. The dollar index was up 0.6%, with the biggest gains against the euro and ending modestly firmer on the yen cross in a volatile week. Gold was down 0.2% for the week. WTI crude was up 8.6%, reversing last week’s 7.9% decline and the best week since early October.
Treasuries turned into a headwind amid a repricing of the Fed rate path. The move was driven in part by some updates that added uncertainty around the disinflation narrative, including a rise in January used vehicle prices and Friday’s February Michigan consumer sentiment report that showed a 0.3pp increase in 1Y inflation expectations to 4.2%. The policy-sensitive 2Y yield rose to the highest levels since November, while markets are now pricing in a peak fed funds rate of `5.15% and one rate cut by year-end, up from around 4.9% last Thursday and two 2023 cuts. Yield curve signaling also reflected more recession fears, with the 2Y/10Y spread hitting -80 bp, its most inverted point since the early 1980s.
There has also been more focus on the waning tailwind from seasonality and positioning, with noting that the market is now closest to neutral positioning since Q2-22 after cutting $300B of bearish bets. JPMorgan also noted hedge fund de-grossing may also be nearing an end and coincide with a near-term reversal of recent strength, However, some positioning and sentiment tailwinds were also seen in latest AAII survey, which showed investors net bullish for the first time in almost a year, and the most bullish since Nov-21. JPMorgan also pointed out net flows to TMT and Consumer Discretionary still have plenty of room to turn more positive over the next few months. Some of the other bullish narratives included the “no landing” argument given resilient economic and labor market data, as well as thoughts on an artificially-inflated payrolls print, Powell’s acknowledgement that data dependence can work in both directions, and corporate cost-cutting actions helping offset underwhelming earnings and guidance metrics.
In his appearance at the Economic Club of Washington, Fed Chair Powell mostly repeated his post-FOMC press conference remarks. Powell again said that disinflation has begun but has a long way to go, and more rate increases are probably needed. He also noted that the labor market is at least at maximum employment, while he thinks it will be into next year before inflation is down close to 2%. Powell also said the Fed isn’t looking at changes to conditions after last week’s January payrolls report. However, some takeaways highlighted the hawkish, relentless “higher-for-longer” messaging, which was reiterated by other Fed officials this week including Fed Governor Waller and Minneapolis’ Kaskhari.
Earnings and guidance metrics have continued to broadly underwhelm, though the bar has been substantially lowered and strategists have highlighted positive takeaways around cost cutting, moderating input prices pressures, better supply chain dynamics, and FX and China swinging from a headwind to a tailwind throughout the year.
Next week brinds a much busier slate of macro data. January CPI is expected to show a headline acceleration to 0.5% m/m after December’s 0.1%, though the annualized increase is expected to drop 0.3pp to 6.2%. Core prices expected tick down 0.1pp to 0.3% m/m. The report will be particularly meaningful given the growing doubts around about a smooth disinflationary path. January retail sales is expected to rebound to a 0.7% m/m rise following December’s 1.1% contraction. A number of regional manufacturing indexes are also set for release, including Empire State index and Philly Fed index.
Fixed Income
Yield Curve
December FOMC Statement December Fed Minutes Balance Sheet Reduction Plan Credit, Liquidity and Balance Sheet Federal Reserve Dot Plots
Treasury.gov yields FOMC Policy Normalization Statement Longer- Run Goals Jan 2022
Foreign Exchange Market
Energy Complex
The Baker Hughes rig count was up by 2 this week. There are 761 oil and gas rigs operating in the US – Up 126 over last year.
Metals Complex
Employment Picture
Weekly Unemployment Claims – Released Thursday 2/9/2023 – The week ending February 4th observed an increase of 13k in initial claims increasing to 196k. The four-week moving average of initial jobless claims was down 2.5k to 189.25k.
January Jobs Report – BLS Summary – Released 2/3/2023 – The US Economy added 517k nonfarm jobs in January and the Unemployment rate declined to 3.4%. Average hourly earnings increased 10 cents to $33.03. Hiring highlights include +128k Leisure and Hospitality, +105k Education and Health Services, and +82 Professional and Business Services.
Job Openings & Labor Turnover Survey JOLTS – Released 2/1/2023 – The number of job openings increased to 11 million on the last business day of December, the US Bureau of Labor Statistics reported. Over the month, the number of hires and total separations changed little at 6.2 million and 5.9 million, respectively. Within separations, quits (4.1 million) and layoffs and discharges (1.5 million) changed little.
Employment Cost Index – Released 1/31/2023 – Compensation costs for civilian workers increased 1% for the 3-month period ending in December 2022. The 12-month period ending in December 2022 saw compensation costs increase by 5.1%. The 12-month period ending December 2021 increased 4%. Wages and salaries increased 5.1% over the year and increased 4.5% for the 12-month period ending in December 2021. Benefit costs increased 4.9% over the year and increased 2.8% for the 12-month period ending in December 2021. This report is published quarterly.
This Week’s Economic Data
Links take you to the data source
Consumer Credit – Released 2/7/2023 – In December, consumer credit increased at a seasonally adjusted annual rate of 7.8%. revolving credit increased at an annual rate of 14.8%, while nonrevolving credit increased at an annual rate of 5.6%.
U.S. Trade Balance – Released 2/7/2023 – The US monthly international trade deficit increased in December 2022 according to the US Bureau of Economic Analysis and the US Census BUreau. The deficit increased from $61 billion in November (revised) to $67.4 billion in December. December exports were $250.2 billion, $2.2 billion less than November exports. December imports were $317.6 billion, $4.2 billion more than November imports. In 2022, the goods and services deficit increased $103 billion, or 12.2%, from 2021. Exports increased $453.1 billion or 17.7%. Imports increased $556.1 billion or 16.3%.
Recent Economic Date
Links take you to the data source
PMI Non-Manufacturing Index – Released 2/3/2023 – Economic activity grew in January after entering contraction territory in December. The Services PMI® registered 55.2%, 6 percentage points higher than December. In December the Services PMI® registered 49.2%.
PMI Manufacturing Index – Released 2/1/2023 – The January Manufacturing PMI® registered 47.4%, 1 percentage point lower than the 48.4% recorded in December, Regarding the overall economy, this figure indicates two months of contraction following 30 months of expansion. The Manufacturing PMI® figure is the lowest since May 2020, when it registered 43.5%. The New Orders Index remained in contraction territory at 42.5%, 2.6 percentage points lower than the 45.1% recorded in December.
U.S. Construction Spending – Released 2/1/2023 – Construction spending during december 2022 was estimated at a seasonally adjusted annual rate of $1,809.8 billion, 0.4% above the revised November estimate of $1,817.3 billion. The December figure is 7.7% above the December 2021 estimate of $1,681 billion. Over the year, construction spending amounted to $1,792.9billion, 10.2% above the $1,626.4 billion for the same period in 2021.
Chicago PMI – Released 1/31/2023 – Chicago PMI remained in contraction territory but decreased in January to 44.3 points from 44.9 points in December.
Consumer Confidence – Released 1/31/2023 – The Conference Board Consumer Confidence Index® decreased in January. The Index now stands at 107.1 (1985=100), down from 109 in December.
US Light Vehicle Sales – Released 1/27/2023 – US light vehicle sales were at a seasonally adjusted annual rate of 13.314 million units in December.
Personal Income – Released 1/27/2023 – Personal income increased $49.5 billion, or 0.2% in December, Disposable Personal Income increased $49.2 billion or 0.3%. Personal Consumption Expenditure decreased $41.6 billion or 0.2%.
Durable Goods – Released 1/26/2023 – New orders for manufactured durable goods in December increased $15.3 billion or 5.6% to $286.9 billion. Transportation equipment increased up $15.5 billion or 16.7% to $108.1 billion.
New Residential Sales – Released 1/26/2023 – Sales of new single-family homes increased 2.3% to 616k, seasonally adjusted, in December. The median sales price of new homes sold in December was $442, 100 with an average sales price of $528,400. At the end of December, the seasonally adjusted estimate of new homes soles in December was $442,100 with an average sales price of $528,400. At the end of December, the seasonally adjusted estimate of new homes for sale was 461k. This represents a supply of 9 months at the current sales rate.
First Estimate of 4th Quarter 2022 GDP – Released 1/26/2023 – Real gross domestic product (GDP) increased at an annual rate of 2.9% in the fourth quarter of 2022 according to the advanced estimate released by the Bureau of Economic Analysis, following an increase of 3.2% in the third quarter of 2022. The GDP estimate released today is based on source data that are incomplete or subject to further revision. The increase in real GDP reflected increases in private inventory investment, consumer spending, federal government spending, state and local government spending, and nonresidential fixed investment that were partly offset by decreases in residential fixed investment and exports. Imports, which are a subtraction in the calculation of GDP, decreased.
Existing Home Sales – Released 1/20/2023 – Existing home sales decreased in December marking eleven consecutive months of declines. Sales declined 1.5% to a seasonally adjusted rate of 4.02 million in December. Sales decreased 34% year-over-year. Housing inventory sits at 970k units, down 13.4% from November’s inventory, up 10.2% over last year. Unsold inventory sits at a 2.9-month supply. The median existing home price for all housing types was $366,900 which is up 2.3% from December 2021. This marks 130 consecutive months of year-over-year increases, the longest-running streak of record.
Housing Starts – Released 1/19/2023 – New home starts in December were at a seasonally adjusted annual rate of 1.382 million; down 1.4% below November, and 21.8% below last December’s rate. Building Permits were at a seasonally adjusted annual rate of 1.33 million, down 1.6% compared to November, and down 29.9% over last year.
Industrial Production and Capacity Utilization – Released 1/18/2023 – In December, Industrial production decreased 0.7%. Manufacturing decreased 1.3%. Utilities output increased 3.8%. Mining output decreased 0.9%. Total industrial production was 1.6% higher in December than a year ago. Total capacity utilization decreased 0.6% in December to 78.8% which is 0.8% below its long run average.
Retail Sales – Released 1/18/2023 – US retail sales for December decreased 1.1% to $677.1 billion but retail sales are 6% above December 2021. US retail sales for the October 2022 through December 2022 period were up 6.7% from the same period a year ago.
Producer Price Index – Released 1/18/2023 – The PPI for final demand declined 0.5% in December, seasonally adjusted, the US Bureau of Labor Statistics reported. Final demand prices advanced 0.2% in November and 0.4% in October. On an unadjusted basis, the index for final demand increased 6.2% in 2022 after rising 10% in 2021.
Consumer Price Index – Released 1/12/2023 – Consumer prices decreased 0.1% m/m in December following a 0.1% increase in November. Consumer prices are up 6.5% for the 12-month period ending in December. Core consumer prices increased 0.3% m/m in December.
Next week we get data on CPI, PPI, Retail Sales, Industrial Production and Capacity Utilization, and Housing Starts.
Data Sources:
Bureau of Economic Analysis (BEA)
Congressional Budget Office (CBO)
U.S. Bureau of Labor Statistics (BLS)
Federal Reserve Economic Data (FRED Charts)
CME Fed Watch
U.S. Treasury – Yields
U.S. Census Bureau
Institute for Supply Management (ISM)
Weekly DOL Employment Data
BLS Monthly Jobs Report
JOLTS
US Energy Admin (EIA)
BLS Consumer Price Index CPI
BLS Producer Price Index PPI
Atlanta Fed GDPNOW
NY Fed Nowcast GDP
US Census Bureau Housing Starts
Consumer Credit
USCB Retail Sales
Construction Spending
Federal Reserve Dot Plots
NY Empire Index
Philadelphia Federal Reserve
P/E Ratio Data -Yardeni Research
Technical Analysis Info:
StockCharts.com – Financial Charts
Exponential vs Simple moving average
Other Links:
1973 Arab Oil Embargo
Hunt Brothers Silver
Long-Term Capital bailout
Categories:
Tags: