Good Life Advisors – Talking Points – Week 4
The Economy is a Tough Read
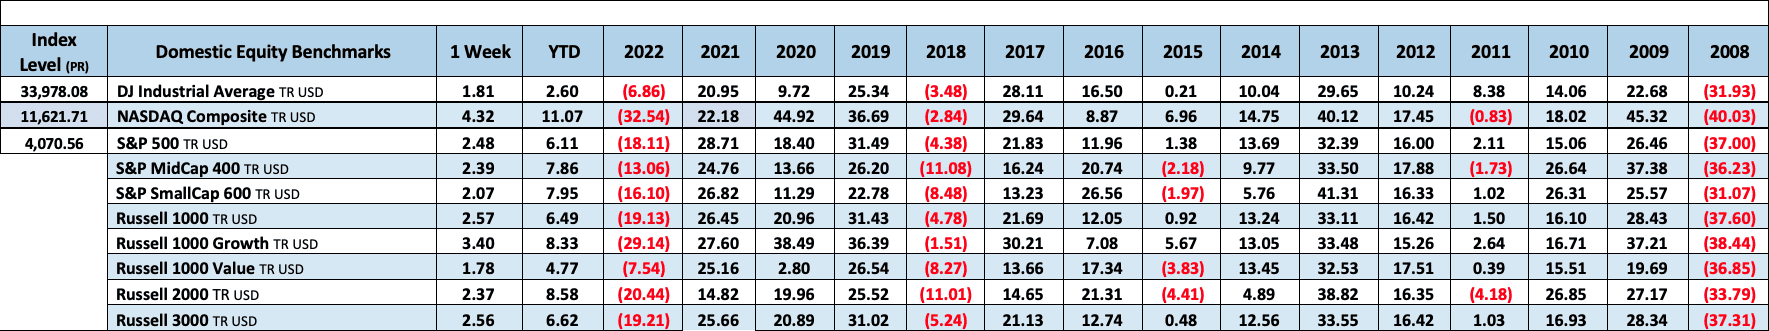
It was a broadly positive week for the market, with the path of least resistance remaining higher despite a relative lull on Tuesday/ WEdnesday. Depressed positioning and technicals were frequently cited this week as supportive, with some attention on the S&P breaking above its 200dma and closing back above the 4000 level for the first time since early December. Treasuries were weaker, particularly in the belly of the curve. The dollar was flat on the week while gold was marginally lower, pulling back 0.1% after five consecutive weeks of gains. Oil ended the week lower after a Friday slide, with WTI settling down 2.5%.
There was little truly surprising about this week’s economic releases, and certainly nothing to jar expectations for coming disinflation or upset the consensus for the Fed to continue toward an eventual pause with a 25bp hike next week. There was a large volume of Q4 earnings reporters this week and the season continued to undershoot expectations; but at the same time the bar seems to have been lowered, and there was little in the corporate commentary to suggest flipping expectations to a hard-landing scenario. Reduced FX pressures, the ongoing China reopening, easing supply strains, and the lack of an energy crisis in Europe all remained elements of the bull case.
That said, the bearish case has not gone away and at a minimum, many analysts argue a rising market may not have much room to run. THe possibility of a hard landing remains in view and the yield curve still remains profoundly inverted. This was also a week where layoff news moved beyond tech: 3M, Dow, Hasbro and Newell all announced workforce reductions. There also remains a wide divergence between market expectations for Fed rate cuts beginning sometime in H2 and fairly consistent Fedspeak advocating a higher-for-longer approach to bring inflation back down to the 2% target. There is a murky path ahead for negotiations about the debt ceiling, and an impasse could theoretically lead to a debt downgrade or even a default. And while this has not been a daily driver of the market mood, concerns about a broadening war in Ukraine were fanned this week by the decision by NATO allies to provide Kiev with dozens of tanks for its spring offensive.
The Fed remained in its quiet period ahead of its 1-Feb policy announcement, so there was little for the market to do but continue debating the likely policy trajectory. While a 25bp hike next week is very broadly expected, there still remains some doubt about where and when the Fed mat pause. The WSJ’s Timiraos drew some attention last weekend with an article suggesting Fed officials could use this meeting to begin discussing the criteria for a pause later this spring, though it is not expected they will issue specific guidance. Analyst previews expect next Wednesday’s statement to continue saying that ongoing rate increases may be appropriate depending on progress in the inflation fight as well as broader economic conditions.
The economic centerpiece of the week was the release of preliminary Q4 GDP, which rose at a 2.9% SAAR (better than consensus but still a downtick from Q3’s 3.2%). December core PCE prices logged their lowest annual rise since April 2020 (+4.4%), though personal spending slowed more than expected. December’s headline durable-goods orders were stronger than expected but on a significant transportation component. COre capital-goods orders dropped 0.2% m/m, though in line with consensus. Weekly initial jobless claims continued to recede, hitting 186k (the lowest since April 2022). January’s final UMich consumer sentiment report showed a slight downtick in inflation expectations at both the nearer and long term. December new- and pending-home sales both came in better than consensus, with easing 30-year mortgage rates likely supportive.
The Q4 earnings season continued to ramp this week, with the market digesting reports from 93 S&P constituents. According to FactSet’s Earnings Insight report, this far (with 29% of index components reporting) the blended y/y earnings growth rate for the S&P is (5%), weaker than at the end of last week and well below the (3.2%) expected at the end of the quarter. Of the companies that have already reported, 69% have beaten consensus estimates, but that figure is lagging.
Next Wednesday’s Fed meeting will be the highlight of the week. The much-anticipated FOMC meeting will issue its statement at 2pm Eastern time on Wednesday 1-Feb, followed by a press conference from Chair Powell at 2:30. The key economic release will be the December nonfarm payrolls report at 8:30 am Eastern. Consensus is looking for a step-down to a 190K pace of job growth vs November’s 223K while hourly earnings growth is seen holding at +0.3% m/m. The week will also see January consumer confidence (Tuesday); January ISM manufacturing and December JOLTS (Wednesday); and January ISM services (Friday). It will also be a big week for corporate earnings with some of the largest companies reporting.

Fixed Income
Yield Curve
December FOMC Statement December Fed Minutes Balance Sheet Reduction Plan Credit, Liquidity and Balance Sheet Federal Reserve Dot Plots
Treasury.gov yields FOMC Policy Normalization Statement Longer- Run Goals Jan 2022
Foreign Exchange Market
Energy Complex
The Baker Hughes rig count was flat this week. There are 771 oil and gas rigs operating in the US – Up 161 over last year.
Metals Complex
Employment Picture
Weekly Unemployment Claims – Released Thursday 1/26/2023 – The week ending January 21st observed a decrease of 6k in initial claims decreasing to 186k. The four-week moving average of initial jobless claims was down 9.25k to 197.5k.
December Jobs Report – BLS Summary Released 1/6/2023 – The US Economy added 223k nonfarm jobs in December and the Unemployment rate was declined to 3.5%. Average hourly earnings increased 9 cents to $32.82. Hiring highlights include +78k Education and Health Services, +67k Leisure and Hospitality, and +28 Construction.
- Average hourly earnings increased 9 cents/ 0.3% to $32.82.
- U3 unemployment rate declined 0.2% to 3.5%. U6 unemployment rate decreased 0.2% to 6.5%.
- The labor force participation rate was little changed at 62.3%.
- Average work week was declined 0.1 to 34.3 hours.
Job Openings & Labor Turnover Survey JOLTS – Released 1/4/2023 – The number of job openings was little changed at 10.5 million on the last business day of November, the US Bureau of Labor Statistics reported. Over the month the number of hires and total separations changed little at 6.1 million and 5.9 million, respectively. Within separations, quits (4.2 million) and layoffs and discharges (1.4 million) changed little.
Employment Cost Index – Released 10/28/2022 – Compensation costs for civilian workers increased 1.2% for the 3-month period ending in September 2022. THe 12-month period ending in September 2022 saw compensation costs increase by 5%. The 12-month period ending September 2021 increased 3.7%. Wages and salaries increased 5.1% over the year and increased 4.2% for the 12-month period ending in September 2021. Benefit costs increased 4.9% over the year and increased 2.5% for the 12-month period ending in September 2021. This report is published quarterly.
This Week’s Economic Data
Links take you to the data source
Personal Income – Released 1/27/2023 – Personal income increased $49.5 billion, or 0.2% in December. Disposable Personal Income increased $49.2 billion or 0.3%. Personal Consumption Expenditure decreased $41.6 billion or 0.2%.
Durable Goods – Released 1/26/2023 – New orders for manufactured durable goods in December increased $15.3 billion or 5.6% to $286.9 billion Transportation equipment increased up $15.5 billion or 16.7% to $108.1 billion.
New Residential Sales – Released 1/26/2023 – Sales of new single-family homes increased 2.3% to 616k, seasonally adjusted, in December. The median sales price of new homes sold in December was $442,100 with an average sales price of $528,400. At the end of December, the seasonally adjusted estimate of new homes for sale was 461k. This represents a supply of 9 months at the current sales rate.
First Estimate of 4th Quarter 2022 GDP – Released 1/26/2023 – Real Gross Domestic Product (GDP) increased at an annual rate of 2.9% in the fourth quarter of 2022 according to the advanced estimate released by the Bureau of Economic Analysis, following an increase of 3.2% in the third quarter of 2022. The GDP estimate released today is based on source data that are incomplete or subject to further revision. The increase in real GDP reflected increases in private inventory investment, consumer spending, federal government spending, state and local government spending, and nonresidential fixed investment that were partly offset by decreases in residential fixed investment and exports. Imports, which are a subtraction in the calculation of GDP, decreased.
Recent Economic Date
Links take you to the data source
Existing Home Sales – Released 1/20/2023 – Existing home sales decreased in December marking eleven consecutive months of declines. Sales declined 1.5% to a seasonally adjusted rate of 4.02 million in December. Sales decreased 34% year-over-year. Housing inventory sits at 970k units, down 13.4% from November’s inventory, up 10.2% over last year. Unsold inventory sits at a 2.9-month supply. The median existing home price for all housing types was $366,900 which is up 2.3% from December 2021. This marks 130 consecutive months of year-over-year increases, the longest-running streak on record.
Housing Starts – Released 1/19/2023 – New home starts in December were at a seasonally adjusted annual rate of 1.382 million; down 1.4% below November, and 21.8% below last December’s rate. Building Permits were at a seasonally adjusted annual rate of 1.33 million, down 1.6% compared to November, and down 29.9% over last year.
Industrial Production and Capacity Utilization – Released 1/18/2023 – In December, Industrial production decreased 0.7%. Manufacturing decreased 1.3%. Utilities output increased 3.8%. Mining output decreased 0.9%. Total industrial production was 1.6% higher in December than a year ago. Total capacity utilization decreased 0.6% in December to 78.8% which is 0.8% below its long run average.
Retail Sales – Released 1/18/2023 – US retail sales for December decreased 1.1% to $677,1 billion but retail sales are 6% above December 2021. US retail sales for the October 2022 through December 2022 period were up 6.7% from the same period a year ago.
Producer Price Index – Released 1/18/2023 – The PPI for final demand declined 0.5% in December, seasonally adjusted, the US Bureau of Labor Statistics reported. Final demand prices advanced 0.2% in November and 0.4% in October. In an unadjusted basis, the index for final demand increased 6.2% in 2022 after rising 10% in 2021.
Consumer Price Index – Released 1/12/2023 – Consumer prices decreased 0.1% m/m in December following a 0.1% increase in November. Consumer prices are up 6.5% for the 12-month period ending in December. Core consumer prices increased 0.3% m/m in December.
Consumer Credit – Released 1/9/2023 – In November, consumer credit increased at a seasonally adjusted annual rate of 7.1%. Revolving credit increased at an annual rate of 16.9%, while nonrevolving credit increased at an annual rate of 3.9%.
U.S. Trade Balance – Released 1/5/2023 – The US monthly international trade deficit decreased in November 2022 according to the US Bureau of Economic Analysis and the US Census Bureau. The deficit decreased from $77.8 billion in October (revised) to $61.5 billion in November. November exports were $251.9 billion, $5.1 billion less than October exports. November imports were $313.4 billion, $21.5 billion less than October imports. Year-to-date, the goods and services deficit increased $120.1 billion, or 15.7%, from the saem period in 2021. Exports increased $439.4 billion or 18.9%. Imports increased $559.5 billion or 18.1%.
PMI Non-Manufacturing Index – Released 1/5/2023 – Economic activity entered contraction territory in December ending 30 months of expansion – with the Services PMI® registering 49.6% – In December, the Services PMI® registered 49.6%, 6.9 percentage points lower than November’s reading of 56.5%.
PMI Manufacturing Index – Released 1/3/2023 – The December Manufacturing PMI® registered 48.4%, 0.6 percentage points lower than the 49% recorded in November. Regarding the overall economy, this figure indicates contraction following 30 months of expansion. The Manufacturing PMI® figure is the lowest since May 2020, when it registered 43.5%. The New Orders Index remained in contraction territory at 45.2%, 2 percentage points lower than the 47.2% recorded in November.
U.S. Construction Spending – Released 1/3/2023 – Construction spending during November 2022 was estimated at a seasonally adjusted annual rate of $1,807.5 billion, 0.2% above the revised October estimate of $1,803.2 billion. The November figure is 8.5% above the November 2021 estimate of $1,665.2 billion. During the first eleven months of this year, construction spending amounted to $1,657.6 billion, 10.5% above the $1,499.8 billion for the same period in 2021.
Chicago PMI – Released 12/30/2022 – Chicago PMI remained in contraction territory but increased in December by 7.7 points to 44.9.
US Light Vehicle Sales – Released 12/23/2022 – US light vehicle sales were at a seasonally adjusted annual rate of 14.134 million units in November.
Consumer Confidence – Released 12/21/2022 – The Conference Board Consumer Confidence Index® increased in December. The Idex now stands at 108.3 (1985=100), up from 101.4 in November.
Next week we get data on Consumer Confidence, Chicago PMI, US Construction Spending, Manufacturing PMI, Services PMI, JOLTS, the Employment Cost Index, and the January Jobs Report.
Data Sources:
Bureau of Economic Analysis (BEA)
Congressional Budget Office (CBO)
U.S. Bureau of Labor Statistics (BLS)
Federal Reserve Economic Data (FRED Charts)
CME Fed Watch
U.S. Treasury – Yields
U.S. Census Bureau
Institute for Supply Management (ISM)
Weekly DOL Employment Data
BLS Monthly Jobs Report
JOLTS
US Energy Admin (EIA)
BLS Consumer Price Index CPI
BLS Producer Price Index PPI
Atlanta Fed GDPNOW
NY Fed Nowcast GDP
US Census Bureau Housing Starts
Consumer Credit
USCB Retail Sales
Construction Spending
Federal Reserve Dot Plots
NY Empire Index
Philadelphia Federal Reserve
P/E Ratio Data -Yardeni Research
Technical Analysis Info:
StockCharts.com – Financial Charts
Exponential vs Simple moving average
Other Links:
1973 Arab Oil Embargo
Hunt Brothers Silver
Long-Term Capital bailout


Week 4 Talking Points
Table of Contents
Good Life Advisors – Talking Points – Week 4
The Economy is a Tough Read
It was a broadly positive week for the market, with the path of least resistance remaining higher despite a relative lull on Tuesday/ WEdnesday. Depressed positioning and technicals were frequently cited this week as supportive, with some attention on the S&P breaking above its 200dma and closing back above the 4000 level for the first time since early December. Treasuries were weaker, particularly in the belly of the curve. The dollar was flat on the week while gold was marginally lower, pulling back 0.1% after five consecutive weeks of gains. Oil ended the week lower after a Friday slide, with WTI settling down 2.5%.
There was little truly surprising about this week’s economic releases, and certainly nothing to jar expectations for coming disinflation or upset the consensus for the Fed to continue toward an eventual pause with a 25bp hike next week. There was a large volume of Q4 earnings reporters this week and the season continued to undershoot expectations; but at the same time the bar seems to have been lowered, and there was little in the corporate commentary to suggest flipping expectations to a hard-landing scenario. Reduced FX pressures, the ongoing China reopening, easing supply strains, and the lack of an energy crisis in Europe all remained elements of the bull case.
That said, the bearish case has not gone away and at a minimum, many analysts argue a rising market may not have much room to run. THe possibility of a hard landing remains in view and the yield curve still remains profoundly inverted. This was also a week where layoff news moved beyond tech: 3M, Dow, Hasbro and Newell all announced workforce reductions. There also remains a wide divergence between market expectations for Fed rate cuts beginning sometime in H2 and fairly consistent Fedspeak advocating a higher-for-longer approach to bring inflation back down to the 2% target. There is a murky path ahead for negotiations about the debt ceiling, and an impasse could theoretically lead to a debt downgrade or even a default. And while this has not been a daily driver of the market mood, concerns about a broadening war in Ukraine were fanned this week by the decision by NATO allies to provide Kiev with dozens of tanks for its spring offensive.
The Fed remained in its quiet period ahead of its 1-Feb policy announcement, so there was little for the market to do but continue debating the likely policy trajectory. While a 25bp hike next week is very broadly expected, there still remains some doubt about where and when the Fed mat pause. The WSJ’s Timiraos drew some attention last weekend with an article suggesting Fed officials could use this meeting to begin discussing the criteria for a pause later this spring, though it is not expected they will issue specific guidance. Analyst previews expect next Wednesday’s statement to continue saying that ongoing rate increases may be appropriate depending on progress in the inflation fight as well as broader economic conditions.
The economic centerpiece of the week was the release of preliminary Q4 GDP, which rose at a 2.9% SAAR (better than consensus but still a downtick from Q3’s 3.2%). December core PCE prices logged their lowest annual rise since April 2020 (+4.4%), though personal spending slowed more than expected. December’s headline durable-goods orders were stronger than expected but on a significant transportation component. COre capital-goods orders dropped 0.2% m/m, though in line with consensus. Weekly initial jobless claims continued to recede, hitting 186k (the lowest since April 2022). January’s final UMich consumer sentiment report showed a slight downtick in inflation expectations at both the nearer and long term. December new- and pending-home sales both came in better than consensus, with easing 30-year mortgage rates likely supportive.
The Q4 earnings season continued to ramp this week, with the market digesting reports from 93 S&P constituents. According to FactSet’s Earnings Insight report, this far (with 29% of index components reporting) the blended y/y earnings growth rate for the S&P is (5%), weaker than at the end of last week and well below the (3.2%) expected at the end of the quarter. Of the companies that have already reported, 69% have beaten consensus estimates, but that figure is lagging.
Next Wednesday’s Fed meeting will be the highlight of the week. The much-anticipated FOMC meeting will issue its statement at 2pm Eastern time on Wednesday 1-Feb, followed by a press conference from Chair Powell at 2:30. The key economic release will be the December nonfarm payrolls report at 8:30 am Eastern. Consensus is looking for a step-down to a 190K pace of job growth vs November’s 223K while hourly earnings growth is seen holding at +0.3% m/m. The week will also see January consumer confidence (Tuesday); January ISM manufacturing and December JOLTS (Wednesday); and January ISM services (Friday). It will also be a big week for corporate earnings with some of the largest companies reporting.
Fixed Income
Yield Curve
December FOMC Statement December Fed Minutes Balance Sheet Reduction Plan Credit, Liquidity and Balance Sheet Federal Reserve Dot Plots
Treasury.gov yields FOMC Policy Normalization Statement Longer- Run Goals Jan 2022
Foreign Exchange Market
Energy Complex
The Baker Hughes rig count was flat this week. There are 771 oil and gas rigs operating in the US – Up 161 over last year.
Metals Complex
Employment Picture
Weekly Unemployment Claims – Released Thursday 1/26/2023 – The week ending January 21st observed a decrease of 6k in initial claims decreasing to 186k. The four-week moving average of initial jobless claims was down 9.25k to 197.5k.
December Jobs Report – BLS Summary Released 1/6/2023 – The US Economy added 223k nonfarm jobs in December and the Unemployment rate was declined to 3.5%. Average hourly earnings increased 9 cents to $32.82. Hiring highlights include +78k Education and Health Services, +67k Leisure and Hospitality, and +28 Construction.
Job Openings & Labor Turnover Survey JOLTS – Released 1/4/2023 – The number of job openings was little changed at 10.5 million on the last business day of November, the US Bureau of Labor Statistics reported. Over the month the number of hires and total separations changed little at 6.1 million and 5.9 million, respectively. Within separations, quits (4.2 million) and layoffs and discharges (1.4 million) changed little.
Employment Cost Index – Released 10/28/2022 – Compensation costs for civilian workers increased 1.2% for the 3-month period ending in September 2022. THe 12-month period ending in September 2022 saw compensation costs increase by 5%. The 12-month period ending September 2021 increased 3.7%. Wages and salaries increased 5.1% over the year and increased 4.2% for the 12-month period ending in September 2021. Benefit costs increased 4.9% over the year and increased 2.5% for the 12-month period ending in September 2021. This report is published quarterly.
This Week’s Economic Data
Links take you to the data source
Personal Income – Released 1/27/2023 – Personal income increased $49.5 billion, or 0.2% in December. Disposable Personal Income increased $49.2 billion or 0.3%. Personal Consumption Expenditure decreased $41.6 billion or 0.2%.
Durable Goods – Released 1/26/2023 – New orders for manufactured durable goods in December increased $15.3 billion or 5.6% to $286.9 billion Transportation equipment increased up $15.5 billion or 16.7% to $108.1 billion.
New Residential Sales – Released 1/26/2023 – Sales of new single-family homes increased 2.3% to 616k, seasonally adjusted, in December. The median sales price of new homes sold in December was $442,100 with an average sales price of $528,400. At the end of December, the seasonally adjusted estimate of new homes for sale was 461k. This represents a supply of 9 months at the current sales rate.
First Estimate of 4th Quarter 2022 GDP – Released 1/26/2023 – Real Gross Domestic Product (GDP) increased at an annual rate of 2.9% in the fourth quarter of 2022 according to the advanced estimate released by the Bureau of Economic Analysis, following an increase of 3.2% in the third quarter of 2022. The GDP estimate released today is based on source data that are incomplete or subject to further revision. The increase in real GDP reflected increases in private inventory investment, consumer spending, federal government spending, state and local government spending, and nonresidential fixed investment that were partly offset by decreases in residential fixed investment and exports. Imports, which are a subtraction in the calculation of GDP, decreased.
Recent Economic Date
Links take you to the data source
Existing Home Sales – Released 1/20/2023 – Existing home sales decreased in December marking eleven consecutive months of declines. Sales declined 1.5% to a seasonally adjusted rate of 4.02 million in December. Sales decreased 34% year-over-year. Housing inventory sits at 970k units, down 13.4% from November’s inventory, up 10.2% over last year. Unsold inventory sits at a 2.9-month supply. The median existing home price for all housing types was $366,900 which is up 2.3% from December 2021. This marks 130 consecutive months of year-over-year increases, the longest-running streak on record.
Housing Starts – Released 1/19/2023 – New home starts in December were at a seasonally adjusted annual rate of 1.382 million; down 1.4% below November, and 21.8% below last December’s rate. Building Permits were at a seasonally adjusted annual rate of 1.33 million, down 1.6% compared to November, and down 29.9% over last year.
Industrial Production and Capacity Utilization – Released 1/18/2023 – In December, Industrial production decreased 0.7%. Manufacturing decreased 1.3%. Utilities output increased 3.8%. Mining output decreased 0.9%. Total industrial production was 1.6% higher in December than a year ago. Total capacity utilization decreased 0.6% in December to 78.8% which is 0.8% below its long run average.
Retail Sales – Released 1/18/2023 – US retail sales for December decreased 1.1% to $677,1 billion but retail sales are 6% above December 2021. US retail sales for the October 2022 through December 2022 period were up 6.7% from the same period a year ago.
Producer Price Index – Released 1/18/2023 – The PPI for final demand declined 0.5% in December, seasonally adjusted, the US Bureau of Labor Statistics reported. Final demand prices advanced 0.2% in November and 0.4% in October. In an unadjusted basis, the index for final demand increased 6.2% in 2022 after rising 10% in 2021.
Consumer Price Index – Released 1/12/2023 – Consumer prices decreased 0.1% m/m in December following a 0.1% increase in November. Consumer prices are up 6.5% for the 12-month period ending in December. Core consumer prices increased 0.3% m/m in December.
Consumer Credit – Released 1/9/2023 – In November, consumer credit increased at a seasonally adjusted annual rate of 7.1%. Revolving credit increased at an annual rate of 16.9%, while nonrevolving credit increased at an annual rate of 3.9%.
U.S. Trade Balance – Released 1/5/2023 – The US monthly international trade deficit decreased in November 2022 according to the US Bureau of Economic Analysis and the US Census Bureau. The deficit decreased from $77.8 billion in October (revised) to $61.5 billion in November. November exports were $251.9 billion, $5.1 billion less than October exports. November imports were $313.4 billion, $21.5 billion less than October imports. Year-to-date, the goods and services deficit increased $120.1 billion, or 15.7%, from the saem period in 2021. Exports increased $439.4 billion or 18.9%. Imports increased $559.5 billion or 18.1%.
PMI Non-Manufacturing Index – Released 1/5/2023 – Economic activity entered contraction territory in December ending 30 months of expansion – with the Services PMI® registering 49.6% – In December, the Services PMI® registered 49.6%, 6.9 percentage points lower than November’s reading of 56.5%.
PMI Manufacturing Index – Released 1/3/2023 – The December Manufacturing PMI® registered 48.4%, 0.6 percentage points lower than the 49% recorded in November. Regarding the overall economy, this figure indicates contraction following 30 months of expansion. The Manufacturing PMI® figure is the lowest since May 2020, when it registered 43.5%. The New Orders Index remained in contraction territory at 45.2%, 2 percentage points lower than the 47.2% recorded in November.
U.S. Construction Spending – Released 1/3/2023 – Construction spending during November 2022 was estimated at a seasonally adjusted annual rate of $1,807.5 billion, 0.2% above the revised October estimate of $1,803.2 billion. The November figure is 8.5% above the November 2021 estimate of $1,665.2 billion. During the first eleven months of this year, construction spending amounted to $1,657.6 billion, 10.5% above the $1,499.8 billion for the same period in 2021.
Chicago PMI – Released 12/30/2022 – Chicago PMI remained in contraction territory but increased in December by 7.7 points to 44.9.
US Light Vehicle Sales – Released 12/23/2022 – US light vehicle sales were at a seasonally adjusted annual rate of 14.134 million units in November.
Consumer Confidence – Released 12/21/2022 – The Conference Board Consumer Confidence Index® increased in December. The Idex now stands at 108.3 (1985=100), up from 101.4 in November.
Next week we get data on Consumer Confidence, Chicago PMI, US Construction Spending, Manufacturing PMI, Services PMI, JOLTS, the Employment Cost Index, and the January Jobs Report.
Data Sources:
Bureau of Economic Analysis (BEA)
Congressional Budget Office (CBO)
U.S. Bureau of Labor Statistics (BLS)
Federal Reserve Economic Data (FRED Charts)
CME Fed Watch
U.S. Treasury – Yields
U.S. Census Bureau
Institute for Supply Management (ISM)
Weekly DOL Employment Data
BLS Monthly Jobs Report
JOLTS
US Energy Admin (EIA)
BLS Consumer Price Index CPI
BLS Producer Price Index PPI
Atlanta Fed GDPNOW
NY Fed Nowcast GDP
US Census Bureau Housing Starts
Consumer Credit
USCB Retail Sales
Construction Spending
Federal Reserve Dot Plots
NY Empire Index
Philadelphia Federal Reserve
P/E Ratio Data -Yardeni Research
Technical Analysis Info:
StockCharts.com – Financial Charts
Exponential vs Simple moving average
Other Links:
1973 Arab Oil Embargo
Hunt Brothers Silver
Long-Term Capital bailout
Categories:
Tags: