Good Life Advisors – Talking Points – Week 44
Fed Hikes By Another 75 bp as Expected
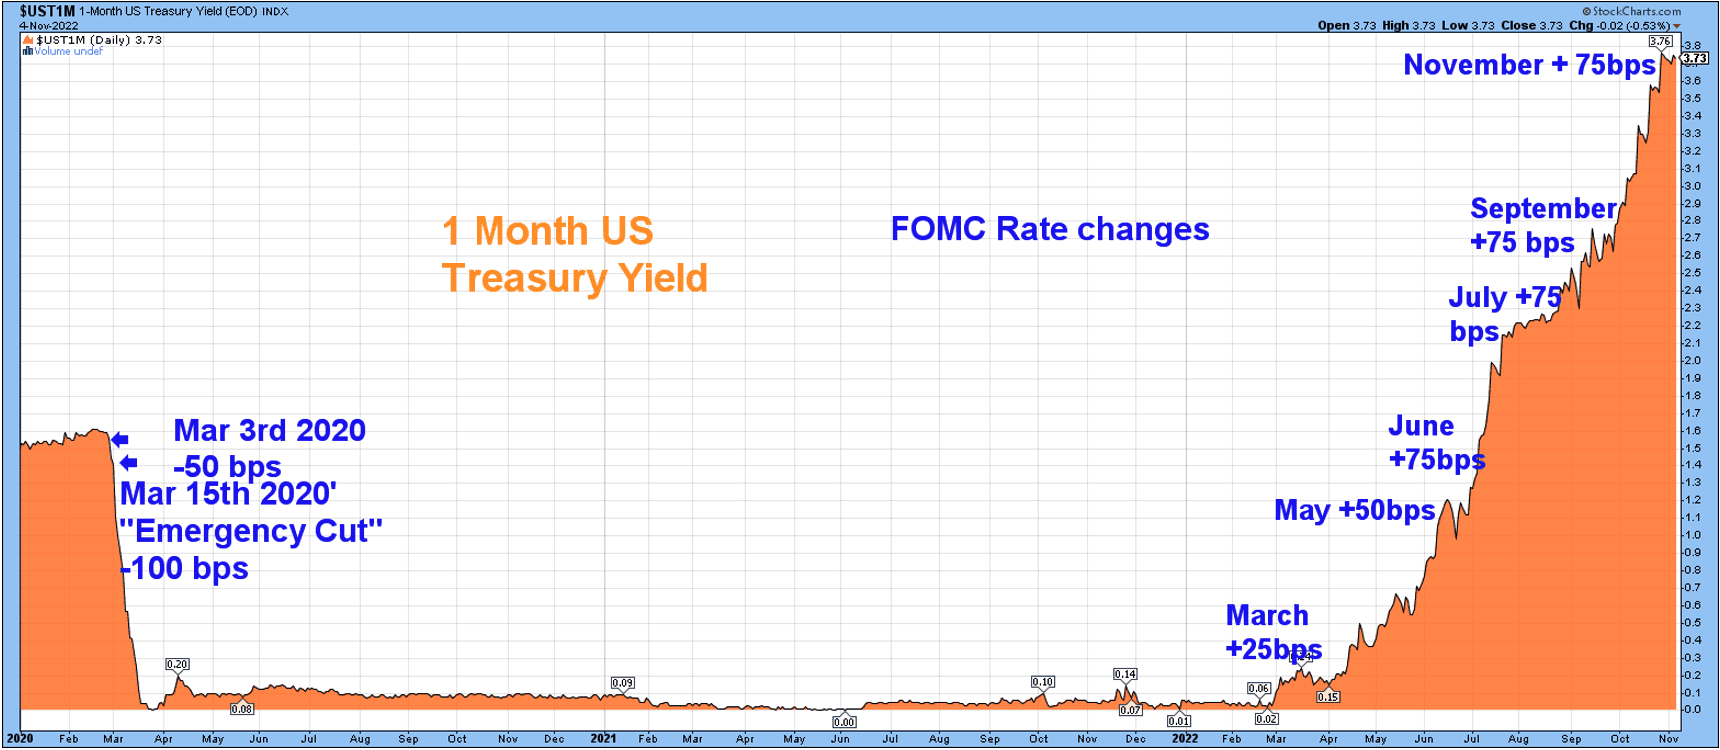
The Fed’s November FOMC meeting ended with a 75 bp hike, as expected. While the statement was seen as dovish, Chair Powell’s press conference hit on a number of hawkish themes, including no pause on rate hikes anytime soon, that the Fed is willing to, and would rather overtighten than undertighten, and that the terminal rate forecast is higher now than it was in the September SEP. Market expectations around the Fed’s rate path steepended sharply following the meeting, with futures pricing in a roughly 50/50 split between a 50 bp and 75 bp hike in December, while the peak Fed funds rate projection rose from a 4.75-5% range prior to the meeting to 5.25-4.5% by May-23. The shift in Fed expectations contributed to this week’s continued backup in yields, the 2Y/10Y spread also inverted by the most since 1982 this week, while the short-end of the yield curve rose to the highest levels since 2007.
This week also saw the October nonfarm payrolls report of 261K come in ahead of consensus for 200K growth, while October saw a big upward revision. However, takeaways from the report were mixed, with the household survey showing a 328K decline in employment, which was responsible for the 0.2 pp increase in the unemployment rate. After the report, Bank of America economists raised their Fed funds terminal rate forecast by one 25 bp hike to a 5-5.25% range, citing the strong establishment survey payrolls number. However, they also said they think the discrepancy between the household and establishment payrolls numbers may be enough to keep the Fed inclined to hike by 50 bp in December as the Fed’s response to a lack of clear data is generally to await further data. Economists have increasingly flagged labor market resilience as a key factor in the “higher for longer” narrative, which led to a higher terminal rate and ultimately a bigger recession than previously expected. However, this week also saw a number of high-profile hiring freezes and layoff announcements that fits with the narrative Fed policy starting to find traction in the labor market.
Bank of America analysts said this week that investors have moved to cash at the fastest pace since the peak of the Covid crisis in 2020, while the firm’s Bull & Bear indicator held at 0 for the seventh-straight week, the longest since the GFC. JPMorgan also said that overall positioning remains low, though macro and micro data haven’t given investors much of a reason to buy. The team also noted that hedge fund degrossing fell back in line with prior YTD lows, though has been driven this time by selling longs rather than covering shorts. China was also a big tailwind this week after heightened speculation that it could be getting ready to fully reopen (or begin to pivot away from the Covid Zero policy) given social media chatter, vaccine updates, and travel changes. However, in addition to Fed/rates/recession overhangs, the recent surge in buybacks came to a close as customers now begin to conserve cash or focus on allocating resources elsewhere.
With 85% of S&P 500 companies having reported, the blended earnings growth rate for Q3 of 2.2% continues to trail the 2.8% expected at the end of the quarter, according to FactSet’s latest Earnings Insight. The low earnings bar narrative continued to see some traction as some rallies were tabbed to better-than-feared results or oversold conditions, particularly some of the pandemic winners. However, other pandemic-surgers extended their recent sell off amid factors like economic uncertainty and elevated costs.
October saw some big upside moves in the equity markets with the Dow pushing higher more than 14%, followed by small caps and value. The Nasdaq was the laggard coming in higher just under 4%.

Fixed Income
Yield Curve
September FOMC Statement July Fed Minutes Balance Sheet Reduction Plan Credit, Liquidity and Balance Sheet Federal Reserve Dot Plots Treasury.gov yields FOMC Policy Normalization Statement Longer- Run Goals Jan 2022
Foreign Exchange Market
Energy Complex
The Baker Hughes rig count increased by 2 this week. There are 770 oil and gas rigs operating in the US – Up 220 over last year.
Metals Complex
Employment Picture
October Jobs Report – BLS Summary – Released 11/4/2022 – The US Economy added 261k nonfarm jobs in October and the Unemployment rate increased 0.2% to 3.7%. Average hourly earnings increased 12 to $32.58. Hiring highlights include +79k Education and Health Services, +35k Leisure and Hospitality, and +39k Professional and Business Services.
- Average hourly earnings increased 12 cents to $32.58.
- U3 unemployment rate remained increased 0.2% to 3.7%. U6 unemployment rate increased 0.1% to 6.8%.
- The labor force participation rate was little changed at 62.2%.
- Average work week was unchanged at 34.5 hours.
Weekly Unemployment Claims – Released Thursday 11/3/2022 – The week ending October 29th observed a decrease of 1k in initial claims decreasing to 217k. The four-week moving average of initial jobless claims decreased 500 to 218.75k.
Job Openings & Labor Turnover Survey JOLTS – Released 11/1/2022 – The US Bureau of Labor Statistics reported the number and rate of job openings increased to 10.7 million on the last business day of September. Over the month, hires declined to 6.1 million and separations declined to 5.7 million. Within separations, quits were little changed at 4.1 million. The layoffs and discharges rates declined to 1.3 million.
Employment Cost Index – Released 10/28/2022 – Compensation costs for civilian workers increased 1.2% for the 3-month period ending in September 2022. The 12-month period ending in September 2022 saw compensation costs increase by 5%. The 12-month period ending September 2021 increased 3.7%. Wages and salaries increased 51% over the year and increased 4.2% for the 12-month period ending in September 2021. Benefit costs increased 4.9% over the year and increased 2.5% for the 12-month period in September 2021. This report is published quarterly.
This Week’s Economic Data
Links take you to the data source
U.S. Trade Balance – Released 11/3/2022 – According to the US Census Bureau of Economic Analysis, the goods and services deficit increased in September by $7.6 billion to $73.3 billion. September exports were $258 billion, $2.8 billion less than August exports. September imports were $331.3 billion, $4.8 billion more than August imports. Year to date, the goods and services deficit increased $125.6 billion, or 20.2%, from the same period in 2021. Exports increased $378.1 billion, or 20.2%. Imports increased $503.6 billion or 20.2%.
PMI Non-Manufacturing Index – Released 11/3/2022 – Economic activity in the non-manufacturing sector grew in October for the 29th consecutive month. ISM Non-Manufacturing registered 54.4%, which is 2.3 percentage points below the September reading of 56.7%.
PMI Manufacturing Index – Released 11/1/2022 – October PMI declined 0.7% registering 50.2%. The New Orders Index remained in contractionary territory at 49.2% up 2.1%. The Production Index registered 52.3%, up 1.7%.
U.S. Construction Spending – Released 11/1/2022 – Construction spending increased 0.2% in September measuring at a seasonally adjusted annual rate of $1,811.1 billion. The September figure is 10.9% above the September 2021 estimate. Private construction spending increased 0.4% from the revised August estimate at $1,450.3 billion. Public construction spending was 0.4% below the revised August estimate at $360.9 billion.
Chicago PMI – Released 10/31/2022 – Chicago PMI remained in contraction territory and declined slightly in October from 45.7 to 45.2. This marks the lowest reading since June 2020.
US Light Vehicle Sales – Released 10/28/2022 –
Recent Economic Data
Links take you to the data source
US Light Vehicle Sales – Released 10/28/2022 – US light vehicle sales were at a seasonally adjusted annual rate of 13.582 million units in September.
Personal Income – Released 10/28/2022 – Personal income increased $78.9 billion or 0.4% in September according to estimates released today by the Bureau of Economic Analysis. Disposable personal income increased $71.3 billion of 0.4% and personal consumption expenditures increased $113 billion or 0.6%.
Advance Estimate of 3rd Quarter 2022 GDP – Released 10/27/2022 – Real gross domestic products increased at an annual rate of 2.6% in the third quarter of 2022, according to the advance estimate released by the Bureau of Economic Analysis. GDP decreased 0.6% in the second quarter of 2022. The GDP estimate released today is based on source data that are incomplete or subject to further revision. The increase in real GDP reflected increases in exports, consumer spending, nonresidential fixed investment, federal government spending, and state and local government spending, that were partly offset by decreases in residential fixed investment and private inventory investment, Imports, which are a subtraction in the calculation of GDP, decreased.
Durable Goods – Released 10/27/2022 – New orders for manufactured durable goods in September increased $1 billion or 0.4% to $274.7 billion. Transportation equipment led the increase up $1.9 billion or 2.1% to $95.4 billion.
New Residential Sales – Released 10/26/2022 – Sales of new single-family homes decreased 10.9% to 603k, seasonally adjusted, in September. The median sales price of new homes sold in September was $470,600 with an average sales price of $517,700. At the end of September, the seasonally adjusted estimate of new homes for sale was 462k. This represents a supply of 9.2 months at the current sales rate.
Consumer Confidence – Released 10/25/2022 – The consumer confidence index decreased in October following an increase in September. The index now stands at 102.5, down from 107.8 in September.
Existing Home Sales – Released 10/20/2022 – Existing home sales decreased in September marking eight consecutive months of declines. Sales declined 1.5% to a seasonally adjusted rate of 4.71 million in September. Sales decreased 23.8% year-over-year. Housing inventory sits at 1.25 million units. Down 2.3% from August’s inventory. Down 0.8% over last year. Unsold inventory sits at a 3.2-month supply. The median existing home price for all housing types was $384,800 which is up 8.4% from August 2021. This marks 127 consecutive months of year-over-year increases, the longest-running streak on record.
Housing Starts – Released 10/19/2022 – New home starts in September were at a seasonally adjusted annual rate of 1.439 million; down 8.1% below August, and 7.7% below last September’s rate. Building Permits were at a seasonally adjusted annual rate of 1.564 million, up 1.4% compared to August, but down 3.2% over last year.
Industrial Production and Capacity Utilization – Released 10/18/2022 – In September Industrial production increased 0.4%, Manufacturing increased 0.4%, Utilities output decreased 0.3%, Mining output increased 0.6%. Total industrial production was 5.3% higher in September than a year ago. Total capacity utilization increased 0.2% in September to 80.3% which is 0.7% above its long run average.
Retail Sales – Released 10/14/2022 – US retail sales for September were roughly the same at $684 billion and retail sales are 8.2% above September 2021. US retail sales for the July 2022 through September 2022 period were up 9.2% from the same period a year ago.
Consumer Price Index – Released 10/13/2022 – Consumer prices increased 0.4% m/m in September following a 0.1% increase in August. Consumer prices are up 8.2% for the 12-month period ending in September. Core consumer prices increased 0.6% m/m in September.
Producer Price Index – Released 10/12/2022 – The Producer Price Index for final demand increased 0.4% in September. PPI less food and energy was flat. The change in PPI for final demand has increased 8.5% year/y.
Consumer Credit – Released 10/7/2022 – Consumer credit increased at a seasonally adjusted annual rate of 8.3% in August 2022. Revolving credit increased at an annual rate of 18.1%, while nonrevolving credit increased at an annual rate of 5.1%.
Next week we get data on Consumer Credit and CPI.
Data Sources:
Bureau of Economic Analysis (BEA)
Congressional Budget Office (CBO)
U.S. Bureau of Labor Statistics (BLS)
Federal Reserve Economic Data (FRED Charts)
CME Fed Watch
U.S. Treasury – Yields
U.S. Census Bureau
Institute for Supply Management (ISM)
Weekly DOL Employment Data
BLS Monthly Jobs Report
JOLTS
US Energy Admin (EIA)
BLS Consumer Price Index CPI
BLS Producer Price Index PPI
Atlanta Fed GDPNOW
NY Fed Nowcast GDP
US Census Bureau Housing Starts
Consumer Credit
USCB Retail Sales
Construction Spending
Federal Reserve Dot Plots
NY Empire Index
Philadelphia Federal Reserve
P/E Ratio Data -Yardeni Research
Technical Analysis Info:
StockCharts.com – Financial Charts
Exponential vs Simple moving average
Other Links:
1973 Arab Oil Embargo
Hunt Brothers Silver
Long-Term Capital bailout


Week 44 Talking Points
Table of Contents
Good Life Advisors – Talking Points – Week 44
Fed Hikes By Another 75 bp as Expected
The Fed’s November FOMC meeting ended with a 75 bp hike, as expected. While the statement was seen as dovish, Chair Powell’s press conference hit on a number of hawkish themes, including no pause on rate hikes anytime soon, that the Fed is willing to, and would rather overtighten than undertighten, and that the terminal rate forecast is higher now than it was in the September SEP. Market expectations around the Fed’s rate path steepended sharply following the meeting, with futures pricing in a roughly 50/50 split between a 50 bp and 75 bp hike in December, while the peak Fed funds rate projection rose from a 4.75-5% range prior to the meeting to 5.25-4.5% by May-23. The shift in Fed expectations contributed to this week’s continued backup in yields, the 2Y/10Y spread also inverted by the most since 1982 this week, while the short-end of the yield curve rose to the highest levels since 2007.
This week also saw the October nonfarm payrolls report of 261K come in ahead of consensus for 200K growth, while October saw a big upward revision. However, takeaways from the report were mixed, with the household survey showing a 328K decline in employment, which was responsible for the 0.2 pp increase in the unemployment rate. After the report, Bank of America economists raised their Fed funds terminal rate forecast by one 25 bp hike to a 5-5.25% range, citing the strong establishment survey payrolls number. However, they also said they think the discrepancy between the household and establishment payrolls numbers may be enough to keep the Fed inclined to hike by 50 bp in December as the Fed’s response to a lack of clear data is generally to await further data. Economists have increasingly flagged labor market resilience as a key factor in the “higher for longer” narrative, which led to a higher terminal rate and ultimately a bigger recession than previously expected. However, this week also saw a number of high-profile hiring freezes and layoff announcements that fits with the narrative Fed policy starting to find traction in the labor market.
Bank of America analysts said this week that investors have moved to cash at the fastest pace since the peak of the Covid crisis in 2020, while the firm’s Bull & Bear indicator held at 0 for the seventh-straight week, the longest since the GFC. JPMorgan also said that overall positioning remains low, though macro and micro data haven’t given investors much of a reason to buy. The team also noted that hedge fund degrossing fell back in line with prior YTD lows, though has been driven this time by selling longs rather than covering shorts. China was also a big tailwind this week after heightened speculation that it could be getting ready to fully reopen (or begin to pivot away from the Covid Zero policy) given social media chatter, vaccine updates, and travel changes. However, in addition to Fed/rates/recession overhangs, the recent surge in buybacks came to a close as customers now begin to conserve cash or focus on allocating resources elsewhere.
With 85% of S&P 500 companies having reported, the blended earnings growth rate for Q3 of 2.2% continues to trail the 2.8% expected at the end of the quarter, according to FactSet’s latest Earnings Insight. The low earnings bar narrative continued to see some traction as some rallies were tabbed to better-than-feared results or oversold conditions, particularly some of the pandemic winners. However, other pandemic-surgers extended their recent sell off amid factors like economic uncertainty and elevated costs.
October saw some big upside moves in the equity markets with the Dow pushing higher more than 14%, followed by small caps and value. The Nasdaq was the laggard coming in higher just under 4%.
Fixed Income
Yield Curve
September FOMC Statement July Fed Minutes Balance Sheet Reduction Plan Credit, Liquidity and Balance Sheet Federal Reserve Dot Plots Treasury.gov yields FOMC Policy Normalization Statement Longer- Run Goals Jan 2022
Foreign Exchange Market
Energy Complex
The Baker Hughes rig count increased by 2 this week. There are 770 oil and gas rigs operating in the US – Up 220 over last year.
Metals Complex
Employment Picture
October Jobs Report – BLS Summary – Released 11/4/2022 – The US Economy added 261k nonfarm jobs in October and the Unemployment rate increased 0.2% to 3.7%. Average hourly earnings increased 12 to $32.58. Hiring highlights include +79k Education and Health Services, +35k Leisure and Hospitality, and +39k Professional and Business Services.
Weekly Unemployment Claims – Released Thursday 11/3/2022 – The week ending October 29th observed a decrease of 1k in initial claims decreasing to 217k. The four-week moving average of initial jobless claims decreased 500 to 218.75k.
Job Openings & Labor Turnover Survey JOLTS – Released 11/1/2022 – The US Bureau of Labor Statistics reported the number and rate of job openings increased to 10.7 million on the last business day of September. Over the month, hires declined to 6.1 million and separations declined to 5.7 million. Within separations, quits were little changed at 4.1 million. The layoffs and discharges rates declined to 1.3 million.
Employment Cost Index – Released 10/28/2022 – Compensation costs for civilian workers increased 1.2% for the 3-month period ending in September 2022. The 12-month period ending in September 2022 saw compensation costs increase by 5%. The 12-month period ending September 2021 increased 3.7%. Wages and salaries increased 51% over the year and increased 4.2% for the 12-month period ending in September 2021. Benefit costs increased 4.9% over the year and increased 2.5% for the 12-month period in September 2021. This report is published quarterly.
This Week’s Economic Data
Links take you to the data source
U.S. Trade Balance – Released 11/3/2022 – According to the US Census Bureau of Economic Analysis, the goods and services deficit increased in September by $7.6 billion to $73.3 billion. September exports were $258 billion, $2.8 billion less than August exports. September imports were $331.3 billion, $4.8 billion more than August imports. Year to date, the goods and services deficit increased $125.6 billion, or 20.2%, from the same period in 2021. Exports increased $378.1 billion, or 20.2%. Imports increased $503.6 billion or 20.2%.
PMI Non-Manufacturing Index – Released 11/3/2022 – Economic activity in the non-manufacturing sector grew in October for the 29th consecutive month. ISM Non-Manufacturing registered 54.4%, which is 2.3 percentage points below the September reading of 56.7%.
PMI Manufacturing Index – Released 11/1/2022 – October PMI declined 0.7% registering 50.2%. The New Orders Index remained in contractionary territory at 49.2% up 2.1%. The Production Index registered 52.3%, up 1.7%.
U.S. Construction Spending – Released 11/1/2022 – Construction spending increased 0.2% in September measuring at a seasonally adjusted annual rate of $1,811.1 billion. The September figure is 10.9% above the September 2021 estimate. Private construction spending increased 0.4% from the revised August estimate at $1,450.3 billion. Public construction spending was 0.4% below the revised August estimate at $360.9 billion.
Chicago PMI – Released 10/31/2022 – Chicago PMI remained in contraction territory and declined slightly in October from 45.7 to 45.2. This marks the lowest reading since June 2020.
US Light Vehicle Sales – Released 10/28/2022 –
Recent Economic Data
Links take you to the data source
US Light Vehicle Sales – Released 10/28/2022 – US light vehicle sales were at a seasonally adjusted annual rate of 13.582 million units in September.
Personal Income – Released 10/28/2022 – Personal income increased $78.9 billion or 0.4% in September according to estimates released today by the Bureau of Economic Analysis. Disposable personal income increased $71.3 billion of 0.4% and personal consumption expenditures increased $113 billion or 0.6%.
Advance Estimate of 3rd Quarter 2022 GDP – Released 10/27/2022 – Real gross domestic products increased at an annual rate of 2.6% in the third quarter of 2022, according to the advance estimate released by the Bureau of Economic Analysis. GDP decreased 0.6% in the second quarter of 2022. The GDP estimate released today is based on source data that are incomplete or subject to further revision. The increase in real GDP reflected increases in exports, consumer spending, nonresidential fixed investment, federal government spending, and state and local government spending, that were partly offset by decreases in residential fixed investment and private inventory investment, Imports, which are a subtraction in the calculation of GDP, decreased.
Durable Goods – Released 10/27/2022 – New orders for manufactured durable goods in September increased $1 billion or 0.4% to $274.7 billion. Transportation equipment led the increase up $1.9 billion or 2.1% to $95.4 billion.
New Residential Sales – Released 10/26/2022 – Sales of new single-family homes decreased 10.9% to 603k, seasonally adjusted, in September. The median sales price of new homes sold in September was $470,600 with an average sales price of $517,700. At the end of September, the seasonally adjusted estimate of new homes for sale was 462k. This represents a supply of 9.2 months at the current sales rate.
Consumer Confidence – Released 10/25/2022 – The consumer confidence index decreased in October following an increase in September. The index now stands at 102.5, down from 107.8 in September.
Existing Home Sales – Released 10/20/2022 – Existing home sales decreased in September marking eight consecutive months of declines. Sales declined 1.5% to a seasonally adjusted rate of 4.71 million in September. Sales decreased 23.8% year-over-year. Housing inventory sits at 1.25 million units. Down 2.3% from August’s inventory. Down 0.8% over last year. Unsold inventory sits at a 3.2-month supply. The median existing home price for all housing types was $384,800 which is up 8.4% from August 2021. This marks 127 consecutive months of year-over-year increases, the longest-running streak on record.
Housing Starts – Released 10/19/2022 – New home starts in September were at a seasonally adjusted annual rate of 1.439 million; down 8.1% below August, and 7.7% below last September’s rate. Building Permits were at a seasonally adjusted annual rate of 1.564 million, up 1.4% compared to August, but down 3.2% over last year.
Industrial Production and Capacity Utilization – Released 10/18/2022 – In September Industrial production increased 0.4%, Manufacturing increased 0.4%, Utilities output decreased 0.3%, Mining output increased 0.6%. Total industrial production was 5.3% higher in September than a year ago. Total capacity utilization increased 0.2% in September to 80.3% which is 0.7% above its long run average.
Retail Sales – Released 10/14/2022 – US retail sales for September were roughly the same at $684 billion and retail sales are 8.2% above September 2021. US retail sales for the July 2022 through September 2022 period were up 9.2% from the same period a year ago.
Consumer Price Index – Released 10/13/2022 – Consumer prices increased 0.4% m/m in September following a 0.1% increase in August. Consumer prices are up 8.2% for the 12-month period ending in September. Core consumer prices increased 0.6% m/m in September.
Producer Price Index – Released 10/12/2022 – The Producer Price Index for final demand increased 0.4% in September. PPI less food and energy was flat. The change in PPI for final demand has increased 8.5% year/y.
Consumer Credit – Released 10/7/2022 – Consumer credit increased at a seasonally adjusted annual rate of 8.3% in August 2022. Revolving credit increased at an annual rate of 18.1%, while nonrevolving credit increased at an annual rate of 5.1%.
Next week we get data on Consumer Credit and CPI.
Data Sources:
Bureau of Economic Analysis (BEA)
Congressional Budget Office (CBO)
U.S. Bureau of Labor Statistics (BLS)
Federal Reserve Economic Data (FRED Charts)
CME Fed Watch
U.S. Treasury – Yields
U.S. Census Bureau
Institute for Supply Management (ISM)
Weekly DOL Employment Data
BLS Monthly Jobs Report
JOLTS
US Energy Admin (EIA)
BLS Consumer Price Index CPI
BLS Producer Price Index PPI
Atlanta Fed GDPNOW
NY Fed Nowcast GDP
US Census Bureau Housing Starts
Consumer Credit
USCB Retail Sales
Construction Spending
Federal Reserve Dot Plots
NY Empire Index
Philadelphia Federal Reserve
P/E Ratio Data -Yardeni Research
Technical Analysis Info:
StockCharts.com – Financial Charts
Exponential vs Simple moving average
Other Links:
1973 Arab Oil Embargo
Hunt Brothers Silver
Long-Term Capital bailout
Categories:
Tags: