Good Life Advisors – Talking Points – Week 42
Markets Continued Rallying off the October 13th Lows
The S&P 500 closed Friday at 3901, up 11.7% off the low on CPI day two Thursdays ago. Despite weathering some blows this week in the form of multiple megacap earnings disappointments, the market remained resilient, capping the week with a notable Friday rally that drove the S&P back near the 3900 level for the first time in a month(though also begging the usual question of bear-market rally vs a move with traction). The market seemed to take some support from the idea the Fed could soon begin to slow the pace of tightening, with this week’s smaller-than-expected BoC hike and ECB dissents in favor of a smaller move lending the theme credence. This idea also made its way into the press, with some articles highlighting recent Fedspeak about taking a break to allow the Fed to evaluate lagged policy impacts. A big focus of next week’s 2-Nov FOMC decision is likely to be a search for any hints about easing off the throttle (which may determine whether terminal-rate bets move back above 5% or remain below).
It also was a very busy week of Q3 earnings reports, with 52% of S&P constituents now having reported. The blended y/y earnings growth rate for the index now stands at 2.2%, a bit higher than the previous week but on track to be the lowest since Q3 ’20. The blended revenue growth rate is 9.3%, better than expected at the end of the quarter. The number and magnitude of earnings and revenue surprises are tracking below five-year averages. Corporate commentary has been cautious in the main, flagging increased macro uncertainty, FX pressures, lingering supply chain issues, inflation challenges as well as some signs of continued consumer resilience. On the economic front, Q3 GDP surprised to the upside with help from solid consumer spending, while September durable-goods orders missed and September pending-home sales registered a 10% monthly slide. CHina was also in the conversation this week, both with negative sentiment around Xi’s consolidation of power last weekend and expanding Covid restrictions amid growing outbreaks.
Monday is the last day of trading in October, that means this Friday is the next jobs report (with the market looking for m/m softening in the headline jobs number but possibly an uptick in hourly earnings). There is also Fed meeting this week that is broadly expected to bring a 75bp rate hike, but the market will also be on alert for any sing policymakers may have discussed a step-down in the pace of tightening (at present, market pricing sees a 50bp move at the December meeting). Finally, the flood of Q3 earnings reports will continue, featuring 167 S&P components, including LLY, COP, AMGN, QCOM, CVS, PYPL, SBUX, and AMD.
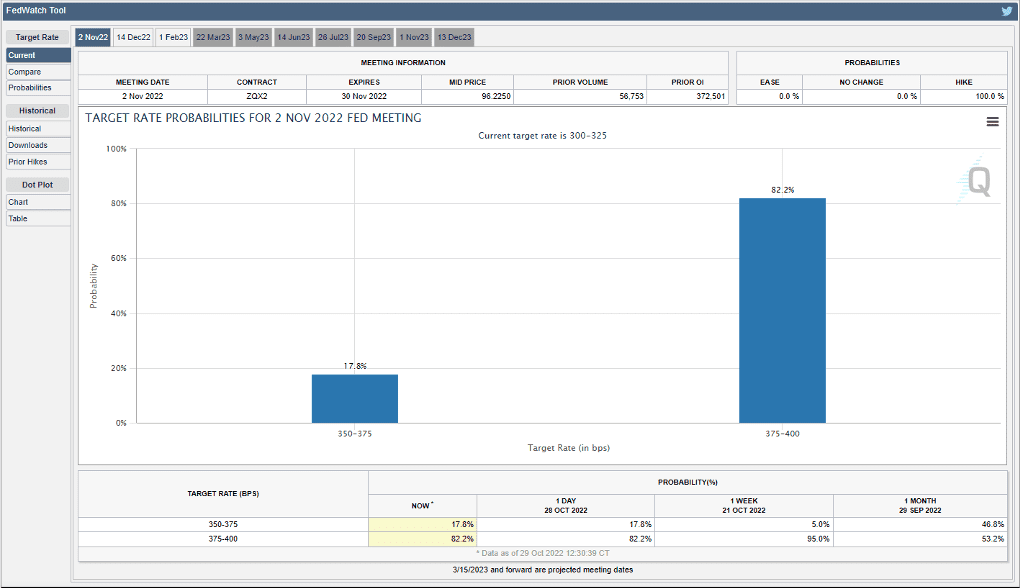
https://www.cmegroup.com/markets/interest-rates/cme-fedwatch-tool.html?redirect=/trading/interest-rates/countdown-to-fomc.html

Fixed Income
Yield Curve
September FOMC Statement July Fed Minutes Balance Sheet Reduction Plan Credit, Liquidity and Balance Sheet Federal Reserve Dot Plots Treasury.gov yields FOMC Policy Normalization Statement Longer- Run Goals Jan 2022
Foreign Exchange Market
Energy Complex
The Baker Hughes rig count decreased by 3 this week. There are 768 oil and gas rigs operating in the US- Up 224 over last year.
Metals Complex
Employment Picture
Weekly Unemployment Claims – Released Thursday 10/27/2022 – The week ending October 22nd observed as increase of 3k in initial claims increased to 217k. The four-week moving average of initial jobless claims increased 6.75k to 219k.
September Jobs Report – BLS Summary – Released 10/7/2022 – The US Economy added 263k nonfarm jobs in September and the Unemployment rate stayed decreased to 3.5%. Average hourly earnings increased 10 to $32.46. Hiring highlights include +90k Education and Health Services, +83k Leisure and Hospitality, and +46k Professional and Business Services.
- Average hourly earnings increased 10 cents to $32.46.
- U3 unemployment rate remained decreased 0.2% to 3.5%. U6 unemployment rate decreased 0.3% to 6.7%.
- The labor force participation rate was little changed at 62.4%.
- Average work week was unchanged at 34.5 hours.
Job Openings & Labor Turnover Survey – JOLTS – Released 10/4/2022 – The US Bureau of Labor Statistics reported the number and rate of job openings decreased to 10.2 million on the last business day of August. Over the month, hires were little changed at 6.2 million and separations were little changed at 6 million. Within separations, quits were little changed at 4.2 million. The layoffs and discharges rates were little changed at 1.5 million.
Employment Cost Index – Released 7/29/2022 – Compensation costs for civilian workers increased 1.3% for the 3-month period ending in June 2022. The 12-month period ending in June 2022 saw compensation costs increased by 5.1%. The 12-month period ending June 2021 increased 2.9%. Wages and salaries increased 5.3% over the year and increased 3.2% for the 12-month period ending in June 2021. Benefit costs increased 4.8% over the year and increased 2.2% for the 12-month period ending in June 2021. This report is published quarterly.
This Week’s Economic Data
Links take you to the data source
Personal Income – Released 10/28/2022 – Personal income increased $78.9 billion or 0.4% in September according to estimates released today by the Bureau of Economic Analysis. Disposable Personal Income (DPI) increased $71.3 billion or 0.4% and Personal Consumption Expenditures (PCE) increased $113 billion or 0.6%.
Advance Estimate of 3rd Quarter 2022 GDP – Released 10/27/2022 – Real Gross Domestic Product (GDP) increased at an annual rate of 2.6% in the third quarter of 2022, according to the advance estimate released by the Bureau of Economic Analysis. GDP decreased 0.6% in the second quarter of 2022. The GDP estimate released today is based on source data that are incomplete or subject the further revision. The increase in real GDP reflected increases in exports, consumer spending, nonresidential fixed investment, federal government spending, and state and local government spending, that were partly offset by decreases in residential fixed investment and private inventory investment. Imports, which are a subtraction in the calculation of GDP, decreased.
Durable Goods – Released 10/27/2022 – New orders for manufactured durable goods in September increased $1 billion or 0.4% to $274.7 billion. Transportation equipment led the increased up $1.9 billion or 2.1% to $95.4 billion.
New Residential Sales – Released 10/26/2022 – Sales of new single-family homes decreased 10.9% to 603k, seasonally adjusted, in September. The median sales price of new homes sold in September was $470,600 with an average sales price of $517,700. At the end if September, the seasonally adjusted estimate of new homes for sale was 462k. This represents a supply of 9.2 months at the current sales rate.
Consumer Confidence – Released 10/25/2022 – The Consumer Confidence Index decreased in October following an increase in September. The Index now stands at 102.5, down from 107.8 in September.
Recent Economic Data
Links take you to the data source
Existing Home Sales – Released 10/20/2022 – Existing home sales decreased in September marking eight consecutive months of declines. Sales declined 1.5% to a seasonally adjusted rate of 4.71 million in September. Sales decreased 23.8% year-over-year. Housing inventory sits at 1.25 million units, down 2.3% from August’s inventory, down 0.8% over last year. Unsold inventory sits at a 3.2 month supply. The median existing home price for all housing types was $384,800 which is up 8.4% from August 2021. This marks 127 consecutive months of year-over-year increases, the longest-running streak on record.
Housing Starts – Released 10/19/2022 – New home starts in September were at a seasonally adjusted annual rate of 1.439 million; down 8.1% below August, and 7.7% below last September’s rate. Building Permits were at a seasonally adjusted annual rate of 1.564 million, up 1.4% compared to August, but down 3.2% over last year.
Industrial Production and Capacity Utilization – Released 10/18/2022 – In September, Industrial production increased 0.4%. Manufacturing increased 0.4%. Utilities output decreased 0.3%. Mining output increased 0.6%. Total industrial production was 5.3% higher in September than a year ago. Total capacity utilization increased 0.2% in September to 80.3% which is 0.7% above its long run average.
Retail Sales – Released 10/14/2022 – US retail sales for September were roughly the same at $684 billion and retail sales are 8.2% above September 2021. US retail sales for the July 2022 through September 2022 periods were up 9.2% from the same period a year ago.
Consumer Price Index – Released 10/13/2022 – Consumer prices increased 0.4% m/m in September following a 0.1% increase in August. Consumer prices are up 8.2% for the 12-month period ending in September. Core consumer prices increased 0.6% m/m in September.
Producer Price Index – Released 10/12/2022 – The Producer Price Index for final demand increased 0.4% in September. PPI less food and energy was flat. The change in PPI for final demand has increased 8.5% year/y.
Consumer Credit – Released 10/7/2022 – Consumer credit increased at a seasonally adjusted annual rate of 8.3% in August 2022. Revolving credit increased at an annual rate of 18.1%, while nonrevolving credit increased at an annual rate of 5.1%.
US Light Vehicle Sales – Released 10/7/2022 – US light vehicle sales were at a seasonally adjusted annual rate of 13.492 million units in September.
U.S. Trade Balance – Released 10/5/2022 – According to the US Census Bureau of Economic Analysis, the goods and services deficit decreased in August by $3.2 billion to $67.4 billion. August exports were $258.9 billion, $0.7 billion less than July exports. August imports were $326.3 billion, $3.7 billion less than July imports. Year to date, the goods and services deficit increased $132.3 billion, or 24.4%, from the same period in 2021. Exports increased $329.8 billion or 19.9%. Imports increased $462.1 billion or 21%.
PMI Non-Manufacturing Index – Released 10/5/2022 – Economic activity in the non-manufacturing sector grew in September for the 28th consecutive month. ISM Non-Manufacturing registered 56.7%, which is 0.2percentage points below the August reading of 56.9%.
PMI Manufacturing Index – Released 10/3/2022 – Construction spending decreased 0.7% in August measuring at a seasonally adjusted annual rate of $1,781.3 billion. The August figure is 8.5% above the August 2021 estimate. Private construction spending declined 0.6% from the revised July estimate at $1,426 billion. Public construction spending was 0.8% below the revised July estimate at $355.3 billion.
Chicago PMI – Released 9/30/2022 – Chicago PMI declined sharply in September from 52.2 to 45.7.
Next week we get data on Chicago PMI, US Construction Spending, Manufacturing PMI, US Trade Balance, JOLTS, the October Jobs Report, and the Employment COst Index.
Data Sources:
Bureau of Economic Analysis (BEA)
Congressional Budget Office (CBO)
U.S. Bureau of Labor Statistics (BLS)
Federal Reserve Economic Data (FRED Charts)
CME Fed Watch
U.S. Treasury – Yields
U.S. Census Bureau
Institute for Supply Management (ISM)
Weekly DOL Employment Data
BLS Monthly Jobs Report
JOLTS
US Energy Admin (EIA)
BLS Consumer Price Index CPI
BLS Producer Price Index PPI
Atlanta Fed GDPNOW
NY Fed Nowcast GDP
US Census Bureau Housing Starts
Consumer Credit
USCB Retail Sales
Construction Spending
Federal Reserve Dot Plots
NY Empire Index
Philadelphia Federal Reserve
P/E Ratio Data -Yardeni Research
Technical Analysis Info:
StockCharts.com – Financial Charts
Exponential vs Simple moving average
Other Links:
1973 Arab Oil Embargo
Hunt Brothers Silver
Long-Term Capital bailout


Week 43 Talking Points
Table of Contents
Good Life Advisors – Talking Points – Week 42
Markets Continued Rallying off the October 13th Lows
The S&P 500 closed Friday at 3901, up 11.7% off the low on CPI day two Thursdays ago. Despite weathering some blows this week in the form of multiple megacap earnings disappointments, the market remained resilient, capping the week with a notable Friday rally that drove the S&P back near the 3900 level for the first time in a month(though also begging the usual question of bear-market rally vs a move with traction). The market seemed to take some support from the idea the Fed could soon begin to slow the pace of tightening, with this week’s smaller-than-expected BoC hike and ECB dissents in favor of a smaller move lending the theme credence. This idea also made its way into the press, with some articles highlighting recent Fedspeak about taking a break to allow the Fed to evaluate lagged policy impacts. A big focus of next week’s 2-Nov FOMC decision is likely to be a search for any hints about easing off the throttle (which may determine whether terminal-rate bets move back above 5% or remain below).
It also was a very busy week of Q3 earnings reports, with 52% of S&P constituents now having reported. The blended y/y earnings growth rate for the index now stands at 2.2%, a bit higher than the previous week but on track to be the lowest since Q3 ’20. The blended revenue growth rate is 9.3%, better than expected at the end of the quarter. The number and magnitude of earnings and revenue surprises are tracking below five-year averages. Corporate commentary has been cautious in the main, flagging increased macro uncertainty, FX pressures, lingering supply chain issues, inflation challenges as well as some signs of continued consumer resilience. On the economic front, Q3 GDP surprised to the upside with help from solid consumer spending, while September durable-goods orders missed and September pending-home sales registered a 10% monthly slide. CHina was also in the conversation this week, both with negative sentiment around Xi’s consolidation of power last weekend and expanding Covid restrictions amid growing outbreaks.
Monday is the last day of trading in October, that means this Friday is the next jobs report (with the market looking for m/m softening in the headline jobs number but possibly an uptick in hourly earnings). There is also Fed meeting this week that is broadly expected to bring a 75bp rate hike, but the market will also be on alert for any sing policymakers may have discussed a step-down in the pace of tightening (at present, market pricing sees a 50bp move at the December meeting). Finally, the flood of Q3 earnings reports will continue, featuring 167 S&P components, including LLY, COP, AMGN, QCOM, CVS, PYPL, SBUX, and AMD.
https://www.cmegroup.com/markets/interest-rates/cme-fedwatch-tool.html?redirect=/trading/interest-rates/countdown-to-fomc.html
Fixed Income
Yield Curve
September FOMC Statement July Fed Minutes Balance Sheet Reduction Plan Credit, Liquidity and Balance Sheet Federal Reserve Dot Plots Treasury.gov yields FOMC Policy Normalization Statement Longer- Run Goals Jan 2022
Foreign Exchange Market
Energy Complex
The Baker Hughes rig count decreased by 3 this week. There are 768 oil and gas rigs operating in the US- Up 224 over last year.
Metals Complex
Employment Picture
Weekly Unemployment Claims – Released Thursday 10/27/2022 – The week ending October 22nd observed as increase of 3k in initial claims increased to 217k. The four-week moving average of initial jobless claims increased 6.75k to 219k.
September Jobs Report – BLS Summary – Released 10/7/2022 – The US Economy added 263k nonfarm jobs in September and the Unemployment rate stayed decreased to 3.5%. Average hourly earnings increased 10 to $32.46. Hiring highlights include +90k Education and Health Services, +83k Leisure and Hospitality, and +46k Professional and Business Services.
Job Openings & Labor Turnover Survey – JOLTS – Released 10/4/2022 – The US Bureau of Labor Statistics reported the number and rate of job openings decreased to 10.2 million on the last business day of August. Over the month, hires were little changed at 6.2 million and separations were little changed at 6 million. Within separations, quits were little changed at 4.2 million. The layoffs and discharges rates were little changed at 1.5 million.
Employment Cost Index – Released 7/29/2022 – Compensation costs for civilian workers increased 1.3% for the 3-month period ending in June 2022. The 12-month period ending in June 2022 saw compensation costs increased by 5.1%. The 12-month period ending June 2021 increased 2.9%. Wages and salaries increased 5.3% over the year and increased 3.2% for the 12-month period ending in June 2021. Benefit costs increased 4.8% over the year and increased 2.2% for the 12-month period ending in June 2021. This report is published quarterly.
This Week’s Economic Data
Links take you to the data source
Personal Income – Released 10/28/2022 – Personal income increased $78.9 billion or 0.4% in September according to estimates released today by the Bureau of Economic Analysis. Disposable Personal Income (DPI) increased $71.3 billion or 0.4% and Personal Consumption Expenditures (PCE) increased $113 billion or 0.6%.
Advance Estimate of 3rd Quarter 2022 GDP – Released 10/27/2022 – Real Gross Domestic Product (GDP) increased at an annual rate of 2.6% in the third quarter of 2022, according to the advance estimate released by the Bureau of Economic Analysis. GDP decreased 0.6% in the second quarter of 2022. The GDP estimate released today is based on source data that are incomplete or subject the further revision. The increase in real GDP reflected increases in exports, consumer spending, nonresidential fixed investment, federal government spending, and state and local government spending, that were partly offset by decreases in residential fixed investment and private inventory investment. Imports, which are a subtraction in the calculation of GDP, decreased.
Durable Goods – Released 10/27/2022 – New orders for manufactured durable goods in September increased $1 billion or 0.4% to $274.7 billion. Transportation equipment led the increased up $1.9 billion or 2.1% to $95.4 billion.
New Residential Sales – Released 10/26/2022 – Sales of new single-family homes decreased 10.9% to 603k, seasonally adjusted, in September. The median sales price of new homes sold in September was $470,600 with an average sales price of $517,700. At the end if September, the seasonally adjusted estimate of new homes for sale was 462k. This represents a supply of 9.2 months at the current sales rate.
Consumer Confidence – Released 10/25/2022 – The Consumer Confidence Index decreased in October following an increase in September. The Index now stands at 102.5, down from 107.8 in September.
Recent Economic Data
Links take you to the data source
Existing Home Sales – Released 10/20/2022 – Existing home sales decreased in September marking eight consecutive months of declines. Sales declined 1.5% to a seasonally adjusted rate of 4.71 million in September. Sales decreased 23.8% year-over-year. Housing inventory sits at 1.25 million units, down 2.3% from August’s inventory, down 0.8% over last year. Unsold inventory sits at a 3.2 month supply. The median existing home price for all housing types was $384,800 which is up 8.4% from August 2021. This marks 127 consecutive months of year-over-year increases, the longest-running streak on record.
Housing Starts – Released 10/19/2022 – New home starts in September were at a seasonally adjusted annual rate of 1.439 million; down 8.1% below August, and 7.7% below last September’s rate. Building Permits were at a seasonally adjusted annual rate of 1.564 million, up 1.4% compared to August, but down 3.2% over last year.
Industrial Production and Capacity Utilization – Released 10/18/2022 – In September, Industrial production increased 0.4%. Manufacturing increased 0.4%. Utilities output decreased 0.3%. Mining output increased 0.6%. Total industrial production was 5.3% higher in September than a year ago. Total capacity utilization increased 0.2% in September to 80.3% which is 0.7% above its long run average.
Retail Sales – Released 10/14/2022 – US retail sales for September were roughly the same at $684 billion and retail sales are 8.2% above September 2021. US retail sales for the July 2022 through September 2022 periods were up 9.2% from the same period a year ago.
Consumer Price Index – Released 10/13/2022 – Consumer prices increased 0.4% m/m in September following a 0.1% increase in August. Consumer prices are up 8.2% for the 12-month period ending in September. Core consumer prices increased 0.6% m/m in September.
Producer Price Index – Released 10/12/2022 – The Producer Price Index for final demand increased 0.4% in September. PPI less food and energy was flat. The change in PPI for final demand has increased 8.5% year/y.
Consumer Credit – Released 10/7/2022 – Consumer credit increased at a seasonally adjusted annual rate of 8.3% in August 2022. Revolving credit increased at an annual rate of 18.1%, while nonrevolving credit increased at an annual rate of 5.1%.
US Light Vehicle Sales – Released 10/7/2022 – US light vehicle sales were at a seasonally adjusted annual rate of 13.492 million units in September.
U.S. Trade Balance – Released 10/5/2022 – According to the US Census Bureau of Economic Analysis, the goods and services deficit decreased in August by $3.2 billion to $67.4 billion. August exports were $258.9 billion, $0.7 billion less than July exports. August imports were $326.3 billion, $3.7 billion less than July imports. Year to date, the goods and services deficit increased $132.3 billion, or 24.4%, from the same period in 2021. Exports increased $329.8 billion or 19.9%. Imports increased $462.1 billion or 21%.
PMI Non-Manufacturing Index – Released 10/5/2022 – Economic activity in the non-manufacturing sector grew in September for the 28th consecutive month. ISM Non-Manufacturing registered 56.7%, which is 0.2percentage points below the August reading of 56.9%.
PMI Manufacturing Index – Released 10/3/2022 – Construction spending decreased 0.7% in August measuring at a seasonally adjusted annual rate of $1,781.3 billion. The August figure is 8.5% above the August 2021 estimate. Private construction spending declined 0.6% from the revised July estimate at $1,426 billion. Public construction spending was 0.8% below the revised July estimate at $355.3 billion.
Chicago PMI – Released 9/30/2022 – Chicago PMI declined sharply in September from 52.2 to 45.7.
Next week we get data on Chicago PMI, US Construction Spending, Manufacturing PMI, US Trade Balance, JOLTS, the October Jobs Report, and the Employment COst Index.
Data Sources:
Bureau of Economic Analysis (BEA)
Congressional Budget Office (CBO)
U.S. Bureau of Labor Statistics (BLS)
Federal Reserve Economic Data (FRED Charts)
CME Fed Watch
U.S. Treasury – Yields
U.S. Census Bureau
Institute for Supply Management (ISM)
Weekly DOL Employment Data
BLS Monthly Jobs Report
JOLTS
US Energy Admin (EIA)
BLS Consumer Price Index CPI
BLS Producer Price Index PPI
Atlanta Fed GDPNOW
NY Fed Nowcast GDP
US Census Bureau Housing Starts
Consumer Credit
USCB Retail Sales
Construction Spending
Federal Reserve Dot Plots
NY Empire Index
Philadelphia Federal Reserve
P/E Ratio Data -Yardeni Research
Technical Analysis Info:
StockCharts.com – Financial Charts
Exponential vs Simple moving average
Other Links:
1973 Arab Oil Embargo
Hunt Brothers Silver
Long-Term Capital bailout
Categories:
Tags: