Good Life Advisors – Talking Points – Week 45
Markets Screamed High After Better Than Expected CPI Report
On Thursday, the S&P rocketed higher 5.5% on marking its 15th largest one day percentage gain going back to 1950. There was follow through higher on Friday too which is very constructive. Mega Cap tech had a very strong week, pushing the Nasdaq up over 8%. META rebounded +24.5% while MSFT and GOOGL booth rose double digits. Semis were stronger across the board; SOX +14.9%. Homebuilders reacted well to the lower Treasury yields and hopes for a sub-5% terminal rate for the Fed’s hikes.
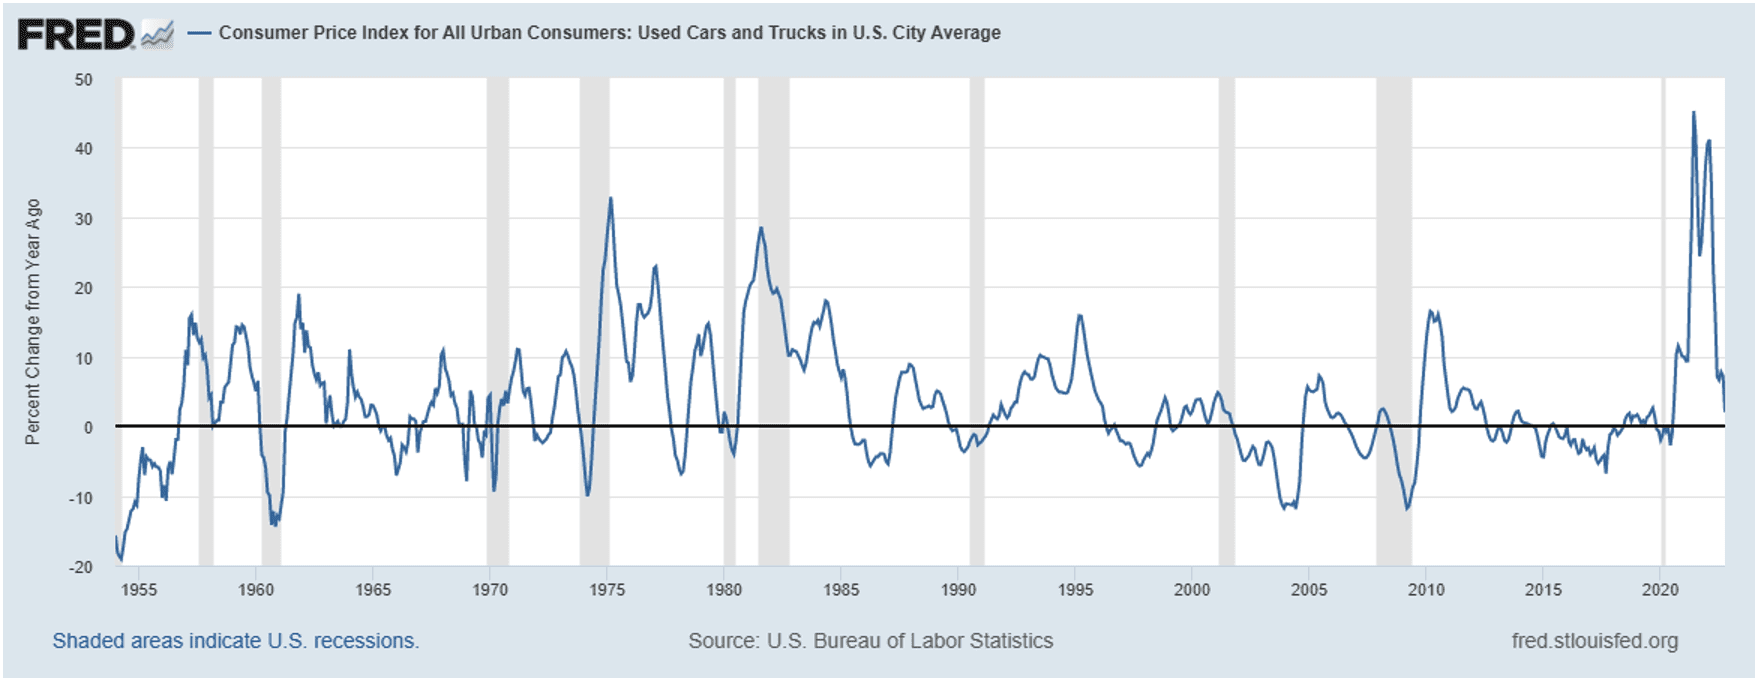
The key event this week was the softer-than-expected October CPI report, which saw the annualized figure come down to 7.7% from September’s 8.2% (core inflation dropped to 6.3% from the prior month’s 6.6%, which was the highest since 1982). The release showed goods prices declining across a rage of categories, especially used vehicles. Shelter prices remained relatively hot, though there was also some focus on a slowdown in rents on new leases. Overall, the report was seen as an affirmation of the peak-inflation thesis and concrete of a long-expected slowdown in price growth.
The softer inflation report sparked a flurry of dovish-leaning Fedspeak. For instance, Dallas Fed President Logan (nonvoter) said it may soon be appropriate to slow the pace of hikes but cautioned that while the soft CPI print was welcome, there remains a long way to go. San Francisco’s Daly (nonvoter) also said it is now appropriate to consider stepping down on the pace of rate hikes, though pausing is not yet a subject of discussion. Cleveland’s Mester (voter) leaned more hawkish, saying she thinks policy will need to remain restrictive for a while to put inflation on a path back to 2%, and that the biggest risk remains tightening too little.
There were several other tailwinds for the market this week, especially Friday reports that China is “optimizing” its Covid-zero approach to include shortened quarantine periods, less stringent contact tracing, and more focus on home quarantines vs broader lockdowns. On the geopolitical front, Russia ordered a withdrawal of its forces from Kherson in the face of advancing Ukrainian troops, with some though that the move might open a window for diplomacy and perhaps a negotiated settlement. This week also saw the long-awaited midterm elections for COngress. While these showed a much weaker “red wave” than had been anticipated, the GOP will still take control of at least the House and keep alive the divided-government theme seen as somewhat bullish (given thoughts that no expensive/ transformational legislation will move forward).
Nevertheless, there were also some cautionary signs. While the Fed hiking program is likely to slow in the months ahead, indications remain that policymakers may want to keep rates higher for longer. Earnings reports are still reflecting pressures from a weakening macro environment. Although divided government is seen as a longer-term positive, in the near term it could spark a fight over the debt ceiling. While China moving to ease its strict Covid response was seen as a positive, it is coming against a backdrop of rising case counts, particularly in the manufacturing hub of Guangzhou.
There was a definite step down in the pace of the Q3 earnings season, with only 30 S&P constituents on the calendar (and 15 to come next week). With 91% of S&P companies having reported, the blended earnings growth rate stands at 2.2%, below the 2.8% expected at the end of the quarter and on track for the slowest growth since Q3 ’20.
The market will have several economic releases to process next week, most notably October PPI (Tuesday) and retail sales (Wednesday). There will also be October housing starts (Thursday) and existing-home sales (Friday) in addition to regional Fed manufacturing indices (NY Fed’s Empire survey on Tuesday, the Philadelphia Fed’s on Thursday).

Fixed Income
Yield Curve
September FOMC Statement July Fed Minutes Balance Sheet Reduction Plan Credit, Liquidity and Balance Sheet Federal Reserve Dot Plots Treasury.gov yields FOMC Policy Normalization Statement Longer- Run Goals Jan 2022
Foreign Exchange Market
Energy Complex
The Baker Hughes rig count increased by 9 this week. There are 779 oil and gas rigs operating in the US – Up 223 over last year.
Metals Complex
Employment Picture
Weekly Unemployment Claims – Released Thursday 11/10/2022 – The week ending November 5th observed an increase of 7k in initial claims increased to 225k. The four-week moving average of initial jobless claims decreased 250 to 218.75k.
October Jobs Report – BLS Summary – Released 11/4/2022 – The US Economy added 261k nonfarm jobs in October and the Unemployment rate increased 0.2% to 3.7%. Average hourly earnings increased 12 to $32.58. Hiring highlights include +79k Education and Health Services, +35k Leisure and Hospitality, and +39k Professional and Business Services.
- Average hourly earnings increased 12 cents to $32.58.
- U3 unemployment rate remained increased 0.2% to 3.7%. U6 unemployment rate increased 0.1% to 6.8%.
- The labor force participation rate was little changed at 62.2%.
- Average work week was unchanged 34.5 hours.
Job Openings & Labor Turnover Survey JOLTS – Released 11/1/2022 – The US Bureau of Labor Statistics reported the number and rate of job openings increased to 10.7 million on the last business day of September. Over the month, hires declined to 6.1 million and separations declined to 5.7 million. Within separations, quits were little changed at 4.1 million. The layoffs and discharges rates declined to 1.3 million.
Employment Cost Index – Released 10/28/2022 – Compensation costs for civilian workers increased 1.2% for the 3-month period ending in September 2022. The 12-month period ending in September 2022 saw compensation costs increase by 5%. The 12-month period ending September 2021 increased 3.7%. Wages and salaries increased 5.1% over the year and increased 4.2% for the 12-month period ending in September 2021. Benefit costs increased 4.9% over the year and increased 2.5% for the 12-month period ending in September 2021. This report is published quarterly.
This Week’s Economic Data
Links take you to the data source
Consumer Price Index – Released 11/10/2022 – Consumer prices increased less than expected rising 0.4% m/m in October following a 0.4% increase in September. COnsumer prices are up 7.7% for the 12-month period ending in October. Core consumer prices increased 0.3% m/m in October.
Consumer Credit – Released 11/7/2022 – Consumer credit increased at a seasonally adjusted annual rate of 6.8% in the third quarter of 2022. Revolving credit increased at an annual rate of 12.9%, while nonrevolving credit increased at an annual rate of 4.9%. In September, consumer credit increased at an annual rate of 6.4%.
Recent Economic Date
Links take you to the data source
US Light Vehicle Sales – Released 11/4/2022 – US light vehicle sales were at a Seasonally Adjusted Annual Rate (SAAR) of 14.897 million units in October.
U.S. Trade Balance – Released 11/3/2022 – According to the US Census of Economic Analysis, the goods and services deficit increased in September by $7.6 billion to $73.3 billion. September exports were $280 billion, $2.8 billion less than August exports. September imports were $331.3 billion, $4.8 billion more than August imports. Year to date, the goods and services deficit increased $125.6 billion, or 20.2%, from the same period in 2021. Exports increased $378.1 billion or 20.2%. Imports increased $503.6 billion or 20.2%.
PMI Non-Manufacturing Index – Released 11/3/2022 – Economic activity in the non-manufacturing sector grew in October for the 29th consecutive month. ISM Non-Manufacturing registered 54.4%, which is 2.3 percentage points below the September reading of 56.7%.
PMI Manufacturing Index – Released 11/1/2022 – October PMI declined 0.7% registering 50.2%. The New Orders Index remained in contractionary territory at 49.2%, up 2.1%. The Production Index registered 52.3%, up 1.7%.
U.S. Construction Spending – Released 11/1/2022 – Construction spending increased 0.2% in September measuring at a seasonally adjusted annual rate of $1,811.1 billion. The September figure is 10.9% above the September 2021 estimate. Private construction spending increased 0.4% from the revised August estimate at $1,450.3 billion. Public construction spending was 0.4% below the revised August estimate at $360.9 billion.
Chicago PMI – Released 10/31/2022 – Chicago PMI remained in contraction territory and declined slightly in October from 45.7 to 45.2. This marks the lowest reading since June 2020.
Personal Income – Released 10/28/2022 – Personal income increased $78.9 billion or 0.4% in September according to estimates released today by the Bureau of Economic Analysis. Disposable Personal Income (DPI) increased $71.3 billion or 0.4% and Personal Consumption Expenditures (PCE) increased $113 billion or 0.6%.
Advance Estimate of 3rd Quarter 2022 GDP – Released 10/27/2022 – Real Gross Domestic Product (GDP) increased at an annual rate of 2.6% in the third quarter of 2022, according to the advance estimate released by the Bureau of Economic Analysis. GDP decreased 0.6% in the second quarter of 2022. The GDP estimate released today is based on source data that are incomplete or subject to further revision. The increase in real GDP reflected increases in exports, consumer spending, nonresidential fixed investment, federal government spending, and state and local government spending, that were partly offset by decreases in residential fixed investment and private inventory investment. Imports, which are a subtraction in the calculation of GDP, decreased.
Durable Goods – Released 10/27/2022 – New orders for manufactured durable goods in September increased $1 billion or 0.4% to $274.7 billion. Transportation equipment led the increase up $1.9 billion or 2.1% to $95.4 billion.
New Residential Sales – Released 10/26/2022 – Sales of new single-family homes decreased 10.9% to 603k, seasonally adjusted, in September. The median sales price of new homes sold in September was $470,600 with an average sales price of $527,700. At the end of September, the seasonally adjusted estimate of new homes for sale was 462l. This represents a supply of 9.2 months at the current sales rate.
Consumer Confidence – Released 10/25/2022 – The Consumer Confidence Index decreased in October following an increase in September. The Index now stands at 102.5, down from 107.8 in September.
Existing Home Sales – Released 10/20/2022 – Existing home sales decreased in September marking eight consecutive months of declines. Sales declined 1.5% to a seasonally adjusted rate of 4.71 million in September. Sales decreased 23.8% year-over-year. Housing inventory sits at 1.25 million units, down 2.3% from August’s inventory and down 0.8% over last year. Unsold inventory sits at a 3.2-month supply. The median existing home price for all housing types was $384,800 which is up 8.4% from August 2021. This marks 127 consecutive months of year-over-year increased, the longest-running streak on record.
Housing Starts – Released 10/19/2022 – New home starts in September were at a seasonally adjusted annual rate of 1.439 million; down 8.1% below August, and 7.7% below last September’s rate. Building Permits were at a seasonally adjusted annual rate of 1.564 million, up 14% compared to August, but down 3.2% over last year.
Industrial Production and Capacity Utilization – Released 10/18/2022 – In September, Industrial production increased 0.4%. Manufacturing increased 0.4%. Utilities output decreased 0.3%. Mining output increased 0.6%. Total industrial production was 5.3% higher in September than a year ago. Total capacity utilization increased 0.2% in September to 80.3% which is 0.7% above its long run average.
Retail Sales – Released 10/14/2022 – US retail sales for September were roughly the same at $684 billion and retail sales are 8.2% above September 2021. US retail sales for the July 2022 through September 2022 period were up 9.2% from the same period a year ago.
Producer Price Index – Released 10/12/2022 – The Producer Price Index for final demand increased 0.4% in September. PPI less food and energy was flat. The change in PPI for final demand has increased 8.5% year-y.
Next week we get data on PPI, Retail Sales, Industrial Production and Capacity Utilization, Housing Starts, and Existing Home Sales.
Data Sources:
Bureau of Economic Analysis (BEA)
Congressional Budget Office (CBO)
U.S. Bureau of Labor Statistics (BLS)
Federal Reserve Economic Data (FRED Charts)
CME Fed Watch
U.S. Treasury – Yields
U.S. Census Bureau
Institute for Supply Management (ISM)
Weekly DOL Employment Data
BLS Monthly Jobs Report
JOLTS
US Energy Admin (EIA)
BLS Consumer Price Index CPI
BLS Producer Price Index PPI
Atlanta Fed GDPNOW
NY Fed Nowcast GDP
US Census Bureau Housing Starts
Consumer Credit
USCB Retail Sales
Construction Spending
Federal Reserve Dot Plots
NY Empire Index
Philadelphia Federal Reserve
P/E Ratio Data -Yardeni Research
Technical Analysis Info:
StockCharts.com – Financial Charts
Exponential vs Simple moving average
Other Links:
1973 Arab Oil Embargo
Hunt Brothers Silver
Long-Term Capital bailout


Week 45 Talking Points
Table of Contents
Good Life Advisors – Talking Points – Week 45
Markets Screamed High After Better Than Expected CPI Report
On Thursday, the S&P rocketed higher 5.5% on marking its 15th largest one day percentage gain going back to 1950. There was follow through higher on Friday too which is very constructive. Mega Cap tech had a very strong week, pushing the Nasdaq up over 8%. META rebounded +24.5% while MSFT and GOOGL booth rose double digits. Semis were stronger across the board; SOX +14.9%. Homebuilders reacted well to the lower Treasury yields and hopes for a sub-5% terminal rate for the Fed’s hikes.
The key event this week was the softer-than-expected October CPI report, which saw the annualized figure come down to 7.7% from September’s 8.2% (core inflation dropped to 6.3% from the prior month’s 6.6%, which was the highest since 1982). The release showed goods prices declining across a rage of categories, especially used vehicles. Shelter prices remained relatively hot, though there was also some focus on a slowdown in rents on new leases. Overall, the report was seen as an affirmation of the peak-inflation thesis and concrete of a long-expected slowdown in price growth.
The softer inflation report sparked a flurry of dovish-leaning Fedspeak. For instance, Dallas Fed President Logan (nonvoter) said it may soon be appropriate to slow the pace of hikes but cautioned that while the soft CPI print was welcome, there remains a long way to go. San Francisco’s Daly (nonvoter) also said it is now appropriate to consider stepping down on the pace of rate hikes, though pausing is not yet a subject of discussion. Cleveland’s Mester (voter) leaned more hawkish, saying she thinks policy will need to remain restrictive for a while to put inflation on a path back to 2%, and that the biggest risk remains tightening too little.
There were several other tailwinds for the market this week, especially Friday reports that China is “optimizing” its Covid-zero approach to include shortened quarantine periods, less stringent contact tracing, and more focus on home quarantines vs broader lockdowns. On the geopolitical front, Russia ordered a withdrawal of its forces from Kherson in the face of advancing Ukrainian troops, with some though that the move might open a window for diplomacy and perhaps a negotiated settlement. This week also saw the long-awaited midterm elections for COngress. While these showed a much weaker “red wave” than had been anticipated, the GOP will still take control of at least the House and keep alive the divided-government theme seen as somewhat bullish (given thoughts that no expensive/ transformational legislation will move forward).
Nevertheless, there were also some cautionary signs. While the Fed hiking program is likely to slow in the months ahead, indications remain that policymakers may want to keep rates higher for longer. Earnings reports are still reflecting pressures from a weakening macro environment. Although divided government is seen as a longer-term positive, in the near term it could spark a fight over the debt ceiling. While China moving to ease its strict Covid response was seen as a positive, it is coming against a backdrop of rising case counts, particularly in the manufacturing hub of Guangzhou.
There was a definite step down in the pace of the Q3 earnings season, with only 30 S&P constituents on the calendar (and 15 to come next week). With 91% of S&P companies having reported, the blended earnings growth rate stands at 2.2%, below the 2.8% expected at the end of the quarter and on track for the slowest growth since Q3 ’20.
The market will have several economic releases to process next week, most notably October PPI (Tuesday) and retail sales (Wednesday). There will also be October housing starts (Thursday) and existing-home sales (Friday) in addition to regional Fed manufacturing indices (NY Fed’s Empire survey on Tuesday, the Philadelphia Fed’s on Thursday).
Fixed Income
Yield Curve
September FOMC Statement July Fed Minutes Balance Sheet Reduction Plan Credit, Liquidity and Balance Sheet Federal Reserve Dot Plots Treasury.gov yields FOMC Policy Normalization Statement Longer- Run Goals Jan 2022
Foreign Exchange Market
Energy Complex
The Baker Hughes rig count increased by 9 this week. There are 779 oil and gas rigs operating in the US – Up 223 over last year.
Metals Complex
Employment Picture
Weekly Unemployment Claims – Released Thursday 11/10/2022 – The week ending November 5th observed an increase of 7k in initial claims increased to 225k. The four-week moving average of initial jobless claims decreased 250 to 218.75k.
October Jobs Report – BLS Summary – Released 11/4/2022 – The US Economy added 261k nonfarm jobs in October and the Unemployment rate increased 0.2% to 3.7%. Average hourly earnings increased 12 to $32.58. Hiring highlights include +79k Education and Health Services, +35k Leisure and Hospitality, and +39k Professional and Business Services.
Job Openings & Labor Turnover Survey JOLTS – Released 11/1/2022 – The US Bureau of Labor Statistics reported the number and rate of job openings increased to 10.7 million on the last business day of September. Over the month, hires declined to 6.1 million and separations declined to 5.7 million. Within separations, quits were little changed at 4.1 million. The layoffs and discharges rates declined to 1.3 million.
Employment Cost Index – Released 10/28/2022 – Compensation costs for civilian workers increased 1.2% for the 3-month period ending in September 2022. The 12-month period ending in September 2022 saw compensation costs increase by 5%. The 12-month period ending September 2021 increased 3.7%. Wages and salaries increased 5.1% over the year and increased 4.2% for the 12-month period ending in September 2021. Benefit costs increased 4.9% over the year and increased 2.5% for the 12-month period ending in September 2021. This report is published quarterly.
This Week’s Economic Data
Links take you to the data source
Consumer Price Index – Released 11/10/2022 – Consumer prices increased less than expected rising 0.4% m/m in October following a 0.4% increase in September. COnsumer prices are up 7.7% for the 12-month period ending in October. Core consumer prices increased 0.3% m/m in October.
Consumer Credit – Released 11/7/2022 – Consumer credit increased at a seasonally adjusted annual rate of 6.8% in the third quarter of 2022. Revolving credit increased at an annual rate of 12.9%, while nonrevolving credit increased at an annual rate of 4.9%. In September, consumer credit increased at an annual rate of 6.4%.
Recent Economic Date
Links take you to the data source
US Light Vehicle Sales – Released 11/4/2022 – US light vehicle sales were at a Seasonally Adjusted Annual Rate (SAAR) of 14.897 million units in October.
U.S. Trade Balance – Released 11/3/2022 – According to the US Census of Economic Analysis, the goods and services deficit increased in September by $7.6 billion to $73.3 billion. September exports were $280 billion, $2.8 billion less than August exports. September imports were $331.3 billion, $4.8 billion more than August imports. Year to date, the goods and services deficit increased $125.6 billion, or 20.2%, from the same period in 2021. Exports increased $378.1 billion or 20.2%. Imports increased $503.6 billion or 20.2%.
PMI Non-Manufacturing Index – Released 11/3/2022 – Economic activity in the non-manufacturing sector grew in October for the 29th consecutive month. ISM Non-Manufacturing registered 54.4%, which is 2.3 percentage points below the September reading of 56.7%.
PMI Manufacturing Index – Released 11/1/2022 – October PMI declined 0.7% registering 50.2%. The New Orders Index remained in contractionary territory at 49.2%, up 2.1%. The Production Index registered 52.3%, up 1.7%.
U.S. Construction Spending – Released 11/1/2022 – Construction spending increased 0.2% in September measuring at a seasonally adjusted annual rate of $1,811.1 billion. The September figure is 10.9% above the September 2021 estimate. Private construction spending increased 0.4% from the revised August estimate at $1,450.3 billion. Public construction spending was 0.4% below the revised August estimate at $360.9 billion.
Chicago PMI – Released 10/31/2022 – Chicago PMI remained in contraction territory and declined slightly in October from 45.7 to 45.2. This marks the lowest reading since June 2020.
Personal Income – Released 10/28/2022 – Personal income increased $78.9 billion or 0.4% in September according to estimates released today by the Bureau of Economic Analysis. Disposable Personal Income (DPI) increased $71.3 billion or 0.4% and Personal Consumption Expenditures (PCE) increased $113 billion or 0.6%.
Advance Estimate of 3rd Quarter 2022 GDP – Released 10/27/2022 – Real Gross Domestic Product (GDP) increased at an annual rate of 2.6% in the third quarter of 2022, according to the advance estimate released by the Bureau of Economic Analysis. GDP decreased 0.6% in the second quarter of 2022. The GDP estimate released today is based on source data that are incomplete or subject to further revision. The increase in real GDP reflected increases in exports, consumer spending, nonresidential fixed investment, federal government spending, and state and local government spending, that were partly offset by decreases in residential fixed investment and private inventory investment. Imports, which are a subtraction in the calculation of GDP, decreased.
Durable Goods – Released 10/27/2022 – New orders for manufactured durable goods in September increased $1 billion or 0.4% to $274.7 billion. Transportation equipment led the increase up $1.9 billion or 2.1% to $95.4 billion.
New Residential Sales – Released 10/26/2022 – Sales of new single-family homes decreased 10.9% to 603k, seasonally adjusted, in September. The median sales price of new homes sold in September was $470,600 with an average sales price of $527,700. At the end of September, the seasonally adjusted estimate of new homes for sale was 462l. This represents a supply of 9.2 months at the current sales rate.
Consumer Confidence – Released 10/25/2022 – The Consumer Confidence Index decreased in October following an increase in September. The Index now stands at 102.5, down from 107.8 in September.
Existing Home Sales – Released 10/20/2022 – Existing home sales decreased in September marking eight consecutive months of declines. Sales declined 1.5% to a seasonally adjusted rate of 4.71 million in September. Sales decreased 23.8% year-over-year. Housing inventory sits at 1.25 million units, down 2.3% from August’s inventory and down 0.8% over last year. Unsold inventory sits at a 3.2-month supply. The median existing home price for all housing types was $384,800 which is up 8.4% from August 2021. This marks 127 consecutive months of year-over-year increased, the longest-running streak on record.
Housing Starts – Released 10/19/2022 – New home starts in September were at a seasonally adjusted annual rate of 1.439 million; down 8.1% below August, and 7.7% below last September’s rate. Building Permits were at a seasonally adjusted annual rate of 1.564 million, up 14% compared to August, but down 3.2% over last year.
Industrial Production and Capacity Utilization – Released 10/18/2022 – In September, Industrial production increased 0.4%. Manufacturing increased 0.4%. Utilities output decreased 0.3%. Mining output increased 0.6%. Total industrial production was 5.3% higher in September than a year ago. Total capacity utilization increased 0.2% in September to 80.3% which is 0.7% above its long run average.
Retail Sales – Released 10/14/2022 – US retail sales for September were roughly the same at $684 billion and retail sales are 8.2% above September 2021. US retail sales for the July 2022 through September 2022 period were up 9.2% from the same period a year ago.
Producer Price Index – Released 10/12/2022 – The Producer Price Index for final demand increased 0.4% in September. PPI less food and energy was flat. The change in PPI for final demand has increased 8.5% year-y.
Next week we get data on PPI, Retail Sales, Industrial Production and Capacity Utilization, Housing Starts, and Existing Home Sales.
Data Sources:
Bureau of Economic Analysis (BEA)
Congressional Budget Office (CBO)
U.S. Bureau of Labor Statistics (BLS)
Federal Reserve Economic Data (FRED Charts)
CME Fed Watch
U.S. Treasury – Yields
U.S. Census Bureau
Institute for Supply Management (ISM)
Weekly DOL Employment Data
BLS Monthly Jobs Report
JOLTS
US Energy Admin (EIA)
BLS Consumer Price Index CPI
BLS Producer Price Index PPI
Atlanta Fed GDPNOW
NY Fed Nowcast GDP
US Census Bureau Housing Starts
Consumer Credit
USCB Retail Sales
Construction Spending
Federal Reserve Dot Plots
NY Empire Index
Philadelphia Federal Reserve
P/E Ratio Data -Yardeni Research
Technical Analysis Info:
StockCharts.com – Financial Charts
Exponential vs Simple moving average
Other Links:
1973 Arab Oil Embargo
Hunt Brothers Silver
Long-Term Capital bailout
Categories:
Tags: