Good Life Advisors – Talking Points – Week 30
What exactly is “Transitory”?
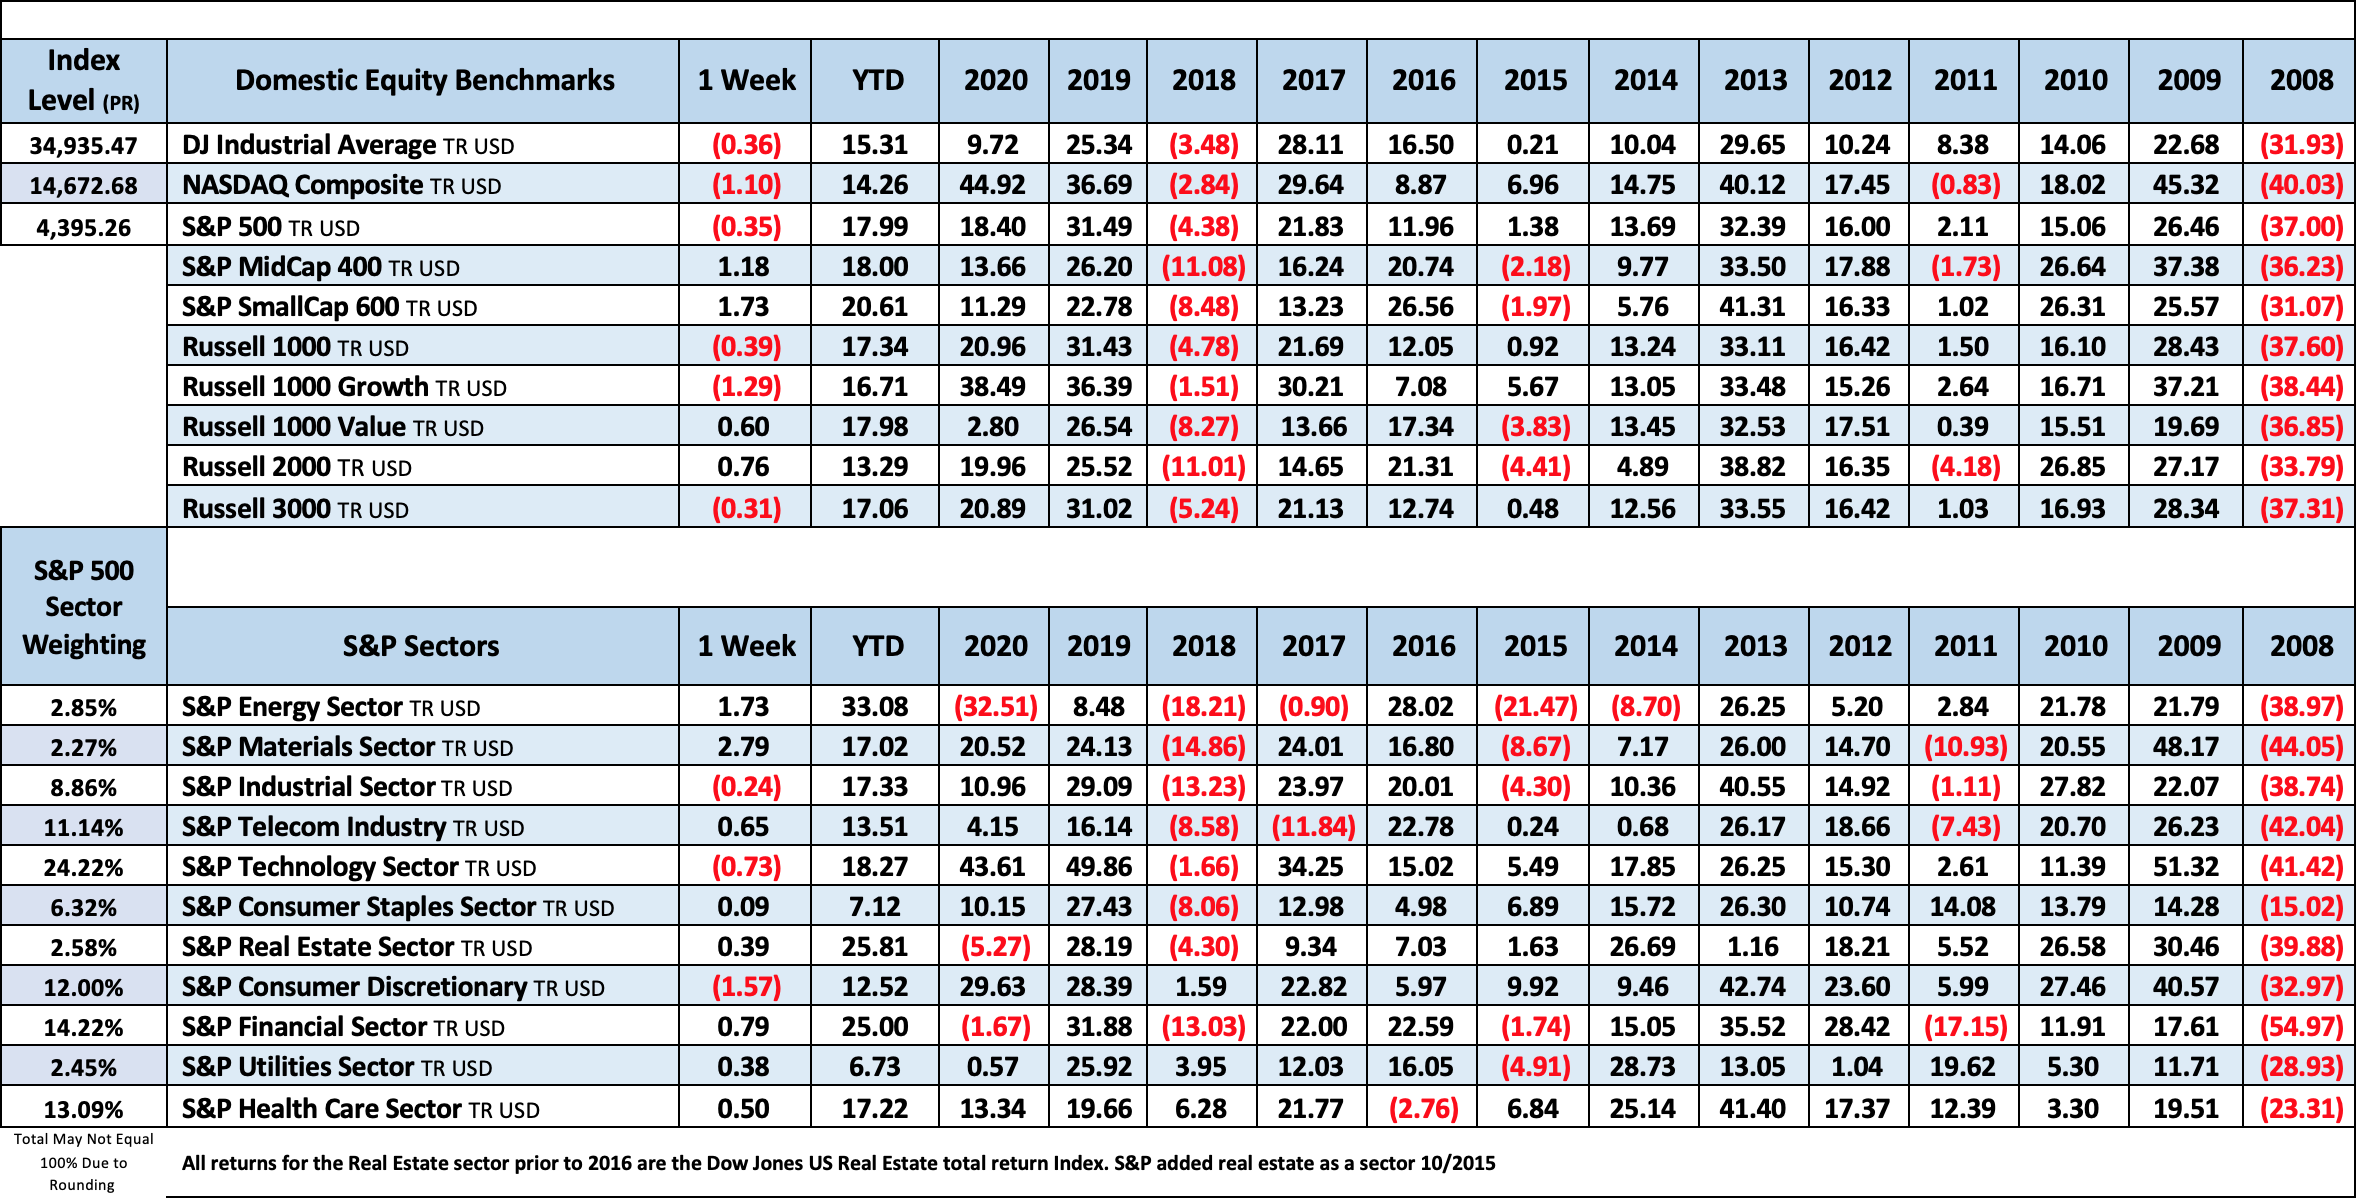
US equities finished mixed to lower this week. Growth (-1.1%) lagged value (+0.6%). Consumer discretionary fared the worst with the drag from AMZN (9.0%) though the bulk of the retailers posted good gains and hotels, autos and homebuilders were strong. Communications services lagged with FB (3.7%) a headwind though GOOGL +1.3% outperformed. Tech underperformed with AAPL (1.8%), growth software and China plays the notable decliners while semis did well with the SOX +2.3%. Industrials finished moderately lower with weakness in parcel and logistics and rails while the bulk of the aerospace, trucking, building materials and multis outperformed. Consumer staples ended higher with strength in tobacco and protein names while the rest of the food space was weaker and HPC, retailers and beverage names were mixed. Financials fared well with good gains in the money center and regional banks following the fairy lackluster reaction to results earlier this earnings season. Life insurers were another standout. Energy saw good gains with the strength in oil. Materials put in the best performance on fairly broad-based strength though industrial metals were a particular bright spot. Treasuries were firmer across the curve with 10-year yields down nearly 5 bp to 1.23%. The dollar index was down ~0.8%. Gold gained 0.9% after snapping a four-week winning streak last week. WTI crude was up 2.6%.
It was another week with a lot of moving pieces. The spread of the Delta variant continued to dominate the headlines and raise concerns about recovery risks though there were also thoughts US cases may soon peak. Peak week of Q2 earnings season saw beat rates remain at or near record levels, brought more discussion about peak growth and featured some additional push and pull surrounding a very favorable demand backdrop and persistent supply chain and input price pressures. The Fed said progress is being made toward tapering though broader policy messaging remained fairly dovish. The Senate voted to advance debate on a bipartisan infrastructure package though the path to additional stimulus remains complicated by an expected reconciliation bill focused on Democratic priorities, which also brings tax headline risk into play. There seemed to be some concerns about the spillover effects as China continued to ramp up its regulatory crackdown though there was also a healthy dose of skepticism that Beijing will ultimately launch a broad-based assault on the private sector. There did not seem to be anything specific behind the (partial) bounce in the reflation trade (which came despite more attention on record-low real yields) while there continued to be some focus on the broader market resilience dynamic as inflows remained a key piece of the bullish narrative.
This week marked the peak week of Q2 earnings with 180 S&P 500 companies reporting. Just under 60% of the index has now reported. According to FactSet earnings insight , earnings and revenue beat rates were both running at 88% at the end of the week, representing record levels. Thematic takeaways remained largely the same with most companies highlighting a strong demand backdrop and elevated operating margins. There continued to be a notable pickup in discussion about supply chain and input price pressures, which are expected to persist in 2H. There was also a big ramp in labor-related mentions, which BofA flagged as a potential indicator of margin pressures going forward. The peak growth theme remained an area of scrutiny, particularly in terms of the more notable pandemic winners. However, some of those names (big tech) are expected to remain outsized beneficiaries of the longstanding structural tailwinds that only seemed to be accelerated by the pandemic. One item to watch going forward may be revision trends, as strategists have noted the signaling for equities. According to FactSet, while the bottom-up estimate for Q3 S&P 500 EPS increased 3.5% in July, it lagged the pace seen in Q2.
The Senate voted to advance debate on a $1T bipartisan infrastructure package that features $550B of new spending on transportation, power, water and broadband. However, the path to additional fiscal stimulus remains complicated as House Speaker Pelosi reiterated over the weekend that she will not bring the package up for a vote without a Senate deal on a separate reconciliation bill focused on Democratic priorities such as childcare, health care and climate change. While it emerged this week that Democrats have the vote in the Senate to begin debate on a budget resolution necessary to facilitate a reconciliation bill, Senator Kyrsten Sinema, an Arizona Democrat, said on Wednesday she would not support the $3.5T price tag. She and other moderates have signaled they could support a smaller reconciliation package. Given that neither of the measures feature the direct stimulus seen in the various coronavirus relief bills, the most pressing issue for the market revolves around taxes. Unlike the bipartisan infrastructure bill, the reconciliation bill is expected to feature both increases in the corporate tax and capital gains tax rates, though not at the more onerous levels proposed by the White House.
Next week marks another busy week of Q2 earnings season though a lot of the big themes have already been hashed out. The economic calendar brings the ISM manufacturing and services indexes on Monday and Wednesday, respectively. The Street is looking for little sequential change with both readings at just over the still elevated 60.0 level. Previews flagged expectations for further scrutiny around supply chain and input price pressures and labor shortages. The highlight of the week is likely to be the July employment report on Friday, as the Fed has flagged the outsized influence of near-term labor market dynamics on its tapering discussions. Consensus expectations are for a 925K increase in nonfarm payrolls following a 850K gain in June with the unemployment rate down 0.2pp to 5.7% and average hourly earnings up 0.3% m/m and 3.9% y/y. As has been the case with recent reports, the focus will be on the push and pull from reopening momentum and economic normalization and the supply headwinds from enhanced benefits and lingering virus fears. Outside the US, the focus will be on the official China PMI data out over the weekend and its implications for an increasingly complicated fiscal, monetary and regulatory policy balancing act.

Fixed Income
July FOMC Statement FOMC Minutes Credit, Liquidity and Balance Sheet Federal Reserve Dot Plots
US Corporate Debt Tops 7 Trillion. Treasury.gov yields FOMC Policy Normalization Statement Longer Run Goals August 2020
Global Bond Yields
Daily US Treasury Yields
Foreign Exchange Market
Energy Complex
The Baker Hughes rig count declined by 3 this week. There are 488 oil and gas rigs operating in the US – Up 237 over last year.
Metals Complex
Employment Picture
Employment Cost Index – Released 7/30/2021 – Compensation costs for civilian workers increased 0.7% for the 3-month period ending in June 2021. The 12-month period ending in June 2021 saw compensation costs increase by 2.9%. The 12-month period ending June 2020 increased 2.7%. Wages and salaries increased 3.2 percent over the year and increased 2.9 percent for the 12-month period ending in June 2020. Benefit costs increased 2.2 percent over the year and increased 2.2 percent for the 12-month period ending in June 2020. This report is published quarterly.
Weekly Unemployment Claims – Released Thursday 7/29/2021 – Initial jobless claims for the week ending July 24th decreased 24k to 400k. The 4-week moving average was 395k, an increase of 8k.
Job Openings & Labor Turnover Survey JOLTS – Released 7/7/2021 – The U.S. Bureau of Labor Statistics reported the number and rate of job openings was little changed at 9.2 million on the last business day of May. Over the month, hires were little changed at 5.9 million and separations decreased to 5.3 million. Within separations, the quits rate decreased to 2.5%. The layoffs and discharges rates decreased to 0.9%.
June Jobs Report – BLS Summary Released 7/2/2021 – The US Economy added 850k nonfarm jobs in June and the Unemployment rate was little changed 5.9%. Average hourly earnings increased by 10 cents to $30.40. Hiring highlights include +343k Leisure and Hospitality, +72k Professional and Business Services, and +188k Government.
- Average hourly earnings increased by 10 cents to $30.40.
- U3 unemployment rate was little changed at 5.9%. U6 unemployment rate declined to 9.8%.
- The labor force participation rate was unchanged at 61.6%.
- Average work week decreased 0.1 hour to 34.7 hours.
This Week’s Economic Data
Links take you to the data source
Chicago PMI – Released 7/30/2021 – Chicago PMI increased to a two-month high at 73.4 points in July. Among the main five indicators, Production saw the largest increase, followed by New Orders, while Supplier Deliveries remained unchanged.
Personal Income – Released 7/30/2021 – Personal income increased $26.1 billion or 0.1 percent in June according to estimates released today by the Bureau of Economic Analysis. Disposable personal income (DPI) decreased $2.6 billion or 0.1 percent and personal consumption expenditures (PCE) increased $155.4 billion or 1.0 percent.
Advance Estimate of 2nd Quarter 2021 GDP – Released 7/29/2021 – Real gross domestic product (GDP) increased at an annual rate of 6.5 percent in the second quarter of 2021, according to the advance estimate released by the Bureau of Economic Analysis. The first quarter observed a 6.3 percent increase in real GDP. The GDP estimate released today is based on data that are incomplete or subject to additional revision. The increase in real GDP in the second quarter reflected increases in personal consumption expenditures (PCE), nonresidential fixed investment, exports, and state and local government spending that were partly offset by decreases in private inventory investment, residential fixed investment, and federal government spending. Imports, which are a subtraction in the calculation of GDP, increased.
Consumer Confidence – Released 7/27/2021 – The Consumer confidence index was relatively unchanged in June following five consecutive months of increases. The Index now shows its highest reading in a year of 129.1, up from 128.9 in June.
Durable Goods – Released 7/27/2021 – New orders for manufactured durable goods in June increased $2.1 billion or 0.8% to $257.6 billion. Transportation equipment led the increase rising $1.6 billion or 2.1% to $77.5 billion.
New Residential Sales – Released 7/26/2021 – Sales of new single-family homes decreased 6.6% to 724k, seasonally adjusted, in June. The median sales price of new homes sold in June was $361,800 with an average sales price of $428,700. At the end of June, the seasonally adjusted estimate of new homes for sale was 353k. This represents a supply of 6.3 months at the current sales rate.
Recent Economic Data
Links take you to the data source
Existing Home Sales – Released 7/22/2021 – Existing home sales increased in June ending four consecutive months of declines. Sales increased 1.4% to a seasonally adjusted rate of 5.86 million in June. Sales are currently up 22.9% from one year ago. Housing inventory sits at 1.25 million units. Up 3.3% from May’s inventory. Down 18.8% over last year. Unsold inventory sits at a 2.6-month supply. The median existing home price for all housing types was $363,300.
Housing Starts – Released 7/20/2021 – New home starts in June were at a seasonally adjusted annual rate of 1.643 million; up 6.3% above May, and 29.1% above last June’s rate. Building Permits were at a seasonally adjusted annual rate of 1.598 million, down 5.1% compared to May, but up 23.3% over last year.
Retail Sales – Released 7/16/2021 – U.S. retail sales for June increased 0.6% to $621.3 billion and retail sales are 18.0% above June 2020. U.S. retail sales are up 31.5% year/y.
Industrial Production and Capacity Utilization – Released 7/15/2021 – In June Industrial production increased 0.4%. Manufacturing declined 0.1%. Mining increased 1.4%. Utilities output increased 2.7%. Total industrial production was 9.8% higher in June than a year ago, but still 1.2% below its pre-pandemic level. Total capacity utilization increased 0.3% to 75.4% in June which is 4.2% below its long run average.
Producer Price Index – Released 7/14/2021 – The Producer Price Index for final demand increased 1.0% in June. PPI less food and energy increased 1.0% in June.
Consumer Price Index – Released 7/13/2021 – Consumer prices rose 0.9% m/m in June following a 0.64% gain in May. This marks the largest 1 month increase in CPI since June 2008 when CPI increased 1.0%. Core consumer prices increased 0.9% m/m in June following a 0.7% gain in May. Headline prices were up 5.4% y/y, the biggest increase since August 2008. Core prices were up 4.5% y/y, the biggest increase since November 1991.
Consumer Credit – Released 7/8/2021 – Consumer credit increased at a seasonally adjusted annual rate of 10.0 percent in May. Revolving credit increased at an annual rate of 11.4 percent, while nonrevolving credit increased at an annual rate of 9.5 percent.
PMI Non-Manufacturing Index – Released 7/6/2021 – Economic activity in the non-manufacturing sector grew in June for the 13th consecutive month. ISM Non-Manufacturing registered 60.1 percent, which is 3.9 percentage points below the adjusted May reading of 64.0 percent.
US Light Vehicle Sales – Released 7/2/2021 – U.S. light vehicle sales were at a seasonally adjusted annual rate (SAAR) of 15.365 million units in June.
U.S. Trade Balance – Released 7/2/2021 – According to the U.S. Census Bureau of Economic Analysis the goods and services deficit increased in May by $2.2 billion to $71.2 billion. May exports were $206.0 billion, $1.3 billion more than April exports. May imports were $277.3 billion, $3.5 billion more than April imports. Year to date the goods and services deficit increased $110.9 billion or 45.8%, from the same period in 2020. Year to date exports and imports increased $101.6 billion or 11.4% and increased $212.5 billion or 18.7% respectively.
PMI Manufacturing Index – Released 7/1/2021 – June PMI declined 0.6% to 60.6% down from May’s reading of 61.2%. The New Orders Index was down 1.0% from May’s reading of 67.0% to 66.0%. The Production Index registered 60.8%, up 2.3%.
U.S. Construction Spending – Released 7/1/2021 – Construction spending declined 0.3% in May measuring at a seasonally adjusted annual rate of $1,545.3 billion. The May figure is 7.5% above the May 2020 estimate. Private construction spending was 0.3% below the revised April estimate at $1,203.3 billion. Public construction spending was 0.2% below the revised April estimate at $342.0 billion.
Next week we get data on U.S. Construction Spending, PMI Manufacturing, the U.S. Trade Balance, PMI Services, Consumer Credit, and the July Jobs Report.
Data Sources:
Bureau of Economic Analysis (BEA)
Congressional Budget Office (CBO)
U.S. Bureau of Labor Statistics (BLS)
Federal Reserve Economic Data (FRED Charts)
CME Fed Watch
U.S. Treasury – Yields
U.S. Census Bureau
Institute for Supply Management (ISM)
Weekly DOL Employment Data
BLS Monthly Jobs Report
JOLTS
US Energy Admin (EIA)
BLS Consumer Price Index CPI
BLS Producer Price Index PPI
Atlanta Fed GDPNOW
NY Fed Nowcast GDP
US Census Bureau Housing Starts
Consumer Credit
USCB Retail Sales
Construction Spending
Federal Reserve Dot Plots
NY Empire Index
Philadelphia Federal Reserve
P/E Ratio Data -Yardeni Research
Technical Analysis Info:
StockCharts.com – Financial Charts
Exponential vs Simple moving average
Other Links:
1973 Arab Oil Embargo
Hunt Brothers Silver
Long-Term Capital bailout


Week 30 Talking Points
Good Life Advisors – Talking Points – Week 30
What exactly is “Transitory”?
US equities finished mixed to lower this week. Growth (-1.1%) lagged value (+0.6%). Consumer discretionary fared the worst with the drag from AMZN (9.0%) though the bulk of the retailers posted good gains and hotels, autos and homebuilders were strong. Communications services lagged with FB (3.7%) a headwind though GOOGL +1.3% outperformed. Tech underperformed with AAPL (1.8%), growth software and China plays the notable decliners while semis did well with the SOX +2.3%. Industrials finished moderately lower with weakness in parcel and logistics and rails while the bulk of the aerospace, trucking, building materials and multis outperformed. Consumer staples ended higher with strength in tobacco and protein names while the rest of the food space was weaker and HPC, retailers and beverage names were mixed. Financials fared well with good gains in the money center and regional banks following the fairy lackluster reaction to results earlier this earnings season. Life insurers were another standout. Energy saw good gains with the strength in oil. Materials put in the best performance on fairly broad-based strength though industrial metals were a particular bright spot. Treasuries were firmer across the curve with 10-year yields down nearly 5 bp to 1.23%. The dollar index was down ~0.8%. Gold gained 0.9% after snapping a four-week winning streak last week. WTI crude was up 2.6%.
It was another week with a lot of moving pieces. The spread of the Delta variant continued to dominate the headlines and raise concerns about recovery risks though there were also thoughts US cases may soon peak. Peak week of Q2 earnings season saw beat rates remain at or near record levels, brought more discussion about peak growth and featured some additional push and pull surrounding a very favorable demand backdrop and persistent supply chain and input price pressures. The Fed said progress is being made toward tapering though broader policy messaging remained fairly dovish. The Senate voted to advance debate on a bipartisan infrastructure package though the path to additional stimulus remains complicated by an expected reconciliation bill focused on Democratic priorities, which also brings tax headline risk into play. There seemed to be some concerns about the spillover effects as China continued to ramp up its regulatory crackdown though there was also a healthy dose of skepticism that Beijing will ultimately launch a broad-based assault on the private sector. There did not seem to be anything specific behind the (partial) bounce in the reflation trade (which came despite more attention on record-low real yields) while there continued to be some focus on the broader market resilience dynamic as inflows remained a key piece of the bullish narrative.
This week marked the peak week of Q2 earnings with 180 S&P 500 companies reporting. Just under 60% of the index has now reported. According to FactSet earnings insight , earnings and revenue beat rates were both running at 88% at the end of the week, representing record levels. Thematic takeaways remained largely the same with most companies highlighting a strong demand backdrop and elevated operating margins. There continued to be a notable pickup in discussion about supply chain and input price pressures, which are expected to persist in 2H. There was also a big ramp in labor-related mentions, which BofA flagged as a potential indicator of margin pressures going forward. The peak growth theme remained an area of scrutiny, particularly in terms of the more notable pandemic winners. However, some of those names (big tech) are expected to remain outsized beneficiaries of the longstanding structural tailwinds that only seemed to be accelerated by the pandemic. One item to watch going forward may be revision trends, as strategists have noted the signaling for equities. According to FactSet, while the bottom-up estimate for Q3 S&P 500 EPS increased 3.5% in July, it lagged the pace seen in Q2.
The Senate voted to advance debate on a $1T bipartisan infrastructure package that features $550B of new spending on transportation, power, water and broadband. However, the path to additional fiscal stimulus remains complicated as House Speaker Pelosi reiterated over the weekend that she will not bring the package up for a vote without a Senate deal on a separate reconciliation bill focused on Democratic priorities such as childcare, health care and climate change. While it emerged this week that Democrats have the vote in the Senate to begin debate on a budget resolution necessary to facilitate a reconciliation bill, Senator Kyrsten Sinema, an Arizona Democrat, said on Wednesday she would not support the $3.5T price tag. She and other moderates have signaled they could support a smaller reconciliation package. Given that neither of the measures feature the direct stimulus seen in the various coronavirus relief bills, the most pressing issue for the market revolves around taxes. Unlike the bipartisan infrastructure bill, the reconciliation bill is expected to feature both increases in the corporate tax and capital gains tax rates, though not at the more onerous levels proposed by the White House.
Next week marks another busy week of Q2 earnings season though a lot of the big themes have already been hashed out. The economic calendar brings the ISM manufacturing and services indexes on Monday and Wednesday, respectively. The Street is looking for little sequential change with both readings at just over the still elevated 60.0 level. Previews flagged expectations for further scrutiny around supply chain and input price pressures and labor shortages. The highlight of the week is likely to be the July employment report on Friday, as the Fed has flagged the outsized influence of near-term labor market dynamics on its tapering discussions. Consensus expectations are for a 925K increase in nonfarm payrolls following a 850K gain in June with the unemployment rate down 0.2pp to 5.7% and average hourly earnings up 0.3% m/m and 3.9% y/y. As has been the case with recent reports, the focus will be on the push and pull from reopening momentum and economic normalization and the supply headwinds from enhanced benefits and lingering virus fears. Outside the US, the focus will be on the official China PMI data out over the weekend and its implications for an increasingly complicated fiscal, monetary and regulatory policy balancing act.
Table of Contents
Fixed Income
July FOMC Statement FOMC Minutes Credit, Liquidity and Balance Sheet Federal Reserve Dot Plots
US Corporate Debt Tops 7 Trillion. Treasury.gov yields FOMC Policy Normalization Statement Longer Run Goals August 2020
Global Bond Yields
Daily US Treasury Yields
Foreign Exchange Market
Energy Complex
The Baker Hughes rig count declined by 3 this week. There are 488 oil and gas rigs operating in the US – Up 237 over last year.
Metals Complex
Employment Picture
Employment Cost Index – Released 7/30/2021 – Compensation costs for civilian workers increased 0.7% for the 3-month period ending in June 2021. The 12-month period ending in June 2021 saw compensation costs increase by 2.9%. The 12-month period ending June 2020 increased 2.7%. Wages and salaries increased 3.2 percent over the year and increased 2.9 percent for the 12-month period ending in June 2020. Benefit costs increased 2.2 percent over the year and increased 2.2 percent for the 12-month period ending in June 2020. This report is published quarterly.
Weekly Unemployment Claims – Released Thursday 7/29/2021 – Initial jobless claims for the week ending July 24th decreased 24k to 400k. The 4-week moving average was 395k, an increase of 8k.
Job Openings & Labor Turnover Survey JOLTS – Released 7/7/2021 – The U.S. Bureau of Labor Statistics reported the number and rate of job openings was little changed at 9.2 million on the last business day of May. Over the month, hires were little changed at 5.9 million and separations decreased to 5.3 million. Within separations, the quits rate decreased to 2.5%. The layoffs and discharges rates decreased to 0.9%.
June Jobs Report – BLS Summary Released 7/2/2021 – The US Economy added 850k nonfarm jobs in June and the Unemployment rate was little changed 5.9%. Average hourly earnings increased by 10 cents to $30.40. Hiring highlights include +343k Leisure and Hospitality, +72k Professional and Business Services, and +188k Government.
This Week’s Economic Data
Links take you to the data source
Chicago PMI – Released 7/30/2021 – Chicago PMI increased to a two-month high at 73.4 points in July. Among the main five indicators, Production saw the largest increase, followed by New Orders, while Supplier Deliveries remained unchanged.
Personal Income – Released 7/30/2021 – Personal income increased $26.1 billion or 0.1 percent in June according to estimates released today by the Bureau of Economic Analysis. Disposable personal income (DPI) decreased $2.6 billion or 0.1 percent and personal consumption expenditures (PCE) increased $155.4 billion or 1.0 percent.
Advance Estimate of 2nd Quarter 2021 GDP – Released 7/29/2021 – Real gross domestic product (GDP) increased at an annual rate of 6.5 percent in the second quarter of 2021, according to the advance estimate released by the Bureau of Economic Analysis. The first quarter observed a 6.3 percent increase in real GDP. The GDP estimate released today is based on data that are incomplete or subject to additional revision. The increase in real GDP in the second quarter reflected increases in personal consumption expenditures (PCE), nonresidential fixed investment, exports, and state and local government spending that were partly offset by decreases in private inventory investment, residential fixed investment, and federal government spending. Imports, which are a subtraction in the calculation of GDP, increased.
Consumer Confidence – Released 7/27/2021 – The Consumer confidence index was relatively unchanged in June following five consecutive months of increases. The Index now shows its highest reading in a year of 129.1, up from 128.9 in June.
Durable Goods – Released 7/27/2021 – New orders for manufactured durable goods in June increased $2.1 billion or 0.8% to $257.6 billion. Transportation equipment led the increase rising $1.6 billion or 2.1% to $77.5 billion.
New Residential Sales – Released 7/26/2021 – Sales of new single-family homes decreased 6.6% to 724k, seasonally adjusted, in June. The median sales price of new homes sold in June was $361,800 with an average sales price of $428,700. At the end of June, the seasonally adjusted estimate of new homes for sale was 353k. This represents a supply of 6.3 months at the current sales rate.
Recent Economic Data
Links take you to the data source
Existing Home Sales – Released 7/22/2021 – Existing home sales increased in June ending four consecutive months of declines. Sales increased 1.4% to a seasonally adjusted rate of 5.86 million in June. Sales are currently up 22.9% from one year ago. Housing inventory sits at 1.25 million units. Up 3.3% from May’s inventory. Down 18.8% over last year. Unsold inventory sits at a 2.6-month supply. The median existing home price for all housing types was $363,300.
Housing Starts – Released 7/20/2021 – New home starts in June were at a seasonally adjusted annual rate of 1.643 million; up 6.3% above May, and 29.1% above last June’s rate. Building Permits were at a seasonally adjusted annual rate of 1.598 million, down 5.1% compared to May, but up 23.3% over last year.
Retail Sales – Released 7/16/2021 – U.S. retail sales for June increased 0.6% to $621.3 billion and retail sales are 18.0% above June 2020. U.S. retail sales are up 31.5% year/y.
Industrial Production and Capacity Utilization – Released 7/15/2021 – In June Industrial production increased 0.4%. Manufacturing declined 0.1%. Mining increased 1.4%. Utilities output increased 2.7%. Total industrial production was 9.8% higher in June than a year ago, but still 1.2% below its pre-pandemic level. Total capacity utilization increased 0.3% to 75.4% in June which is 4.2% below its long run average.
Producer Price Index – Released 7/14/2021 – The Producer Price Index for final demand increased 1.0% in June. PPI less food and energy increased 1.0% in June.
Consumer Price Index – Released 7/13/2021 – Consumer prices rose 0.9% m/m in June following a 0.64% gain in May. This marks the largest 1 month increase in CPI since June 2008 when CPI increased 1.0%. Core consumer prices increased 0.9% m/m in June following a 0.7% gain in May. Headline prices were up 5.4% y/y, the biggest increase since August 2008. Core prices were up 4.5% y/y, the biggest increase since November 1991.
Consumer Credit – Released 7/8/2021 – Consumer credit increased at a seasonally adjusted annual rate of 10.0 percent in May. Revolving credit increased at an annual rate of 11.4 percent, while nonrevolving credit increased at an annual rate of 9.5 percent.
PMI Non-Manufacturing Index – Released 7/6/2021 – Economic activity in the non-manufacturing sector grew in June for the 13th consecutive month. ISM Non-Manufacturing registered 60.1 percent, which is 3.9 percentage points below the adjusted May reading of 64.0 percent.
US Light Vehicle Sales – Released 7/2/2021 – U.S. light vehicle sales were at a seasonally adjusted annual rate (SAAR) of 15.365 million units in June.
U.S. Trade Balance – Released 7/2/2021 – According to the U.S. Census Bureau of Economic Analysis the goods and services deficit increased in May by $2.2 billion to $71.2 billion. May exports were $206.0 billion, $1.3 billion more than April exports. May imports were $277.3 billion, $3.5 billion more than April imports. Year to date the goods and services deficit increased $110.9 billion or 45.8%, from the same period in 2020. Year to date exports and imports increased $101.6 billion or 11.4% and increased $212.5 billion or 18.7% respectively.
PMI Manufacturing Index – Released 7/1/2021 – June PMI declined 0.6% to 60.6% down from May’s reading of 61.2%. The New Orders Index was down 1.0% from May’s reading of 67.0% to 66.0%. The Production Index registered 60.8%, up 2.3%.
U.S. Construction Spending – Released 7/1/2021 – Construction spending declined 0.3% in May measuring at a seasonally adjusted annual rate of $1,545.3 billion. The May figure is 7.5% above the May 2020 estimate. Private construction spending was 0.3% below the revised April estimate at $1,203.3 billion. Public construction spending was 0.2% below the revised April estimate at $342.0 billion.
Next week we get data on U.S. Construction Spending, PMI Manufacturing, the U.S. Trade Balance, PMI Services, Consumer Credit, and the July Jobs Report.
Data Sources:
Bureau of Economic Analysis (BEA)
Congressional Budget Office (CBO)
U.S. Bureau of Labor Statistics (BLS)
Federal Reserve Economic Data (FRED Charts)
CME Fed Watch
U.S. Treasury – Yields
U.S. Census Bureau
Institute for Supply Management (ISM)
Weekly DOL Employment Data
BLS Monthly Jobs Report
JOLTS
US Energy Admin (EIA)
BLS Consumer Price Index CPI
BLS Producer Price Index PPI
Atlanta Fed GDPNOW
NY Fed Nowcast GDP
US Census Bureau Housing Starts
Consumer Credit
USCB Retail Sales
Construction Spending
Federal Reserve Dot Plots
NY Empire Index
Philadelphia Federal Reserve
P/E Ratio Data -Yardeni Research
Technical Analysis Info:
StockCharts.com – Financial Charts
Exponential vs Simple moving average
Other Links:
1973 Arab Oil Embargo
Hunt Brothers Silver
Long-Term Capital bailout
Categories:
Tags: