Good Life Advisors – Talking Points – Week 31
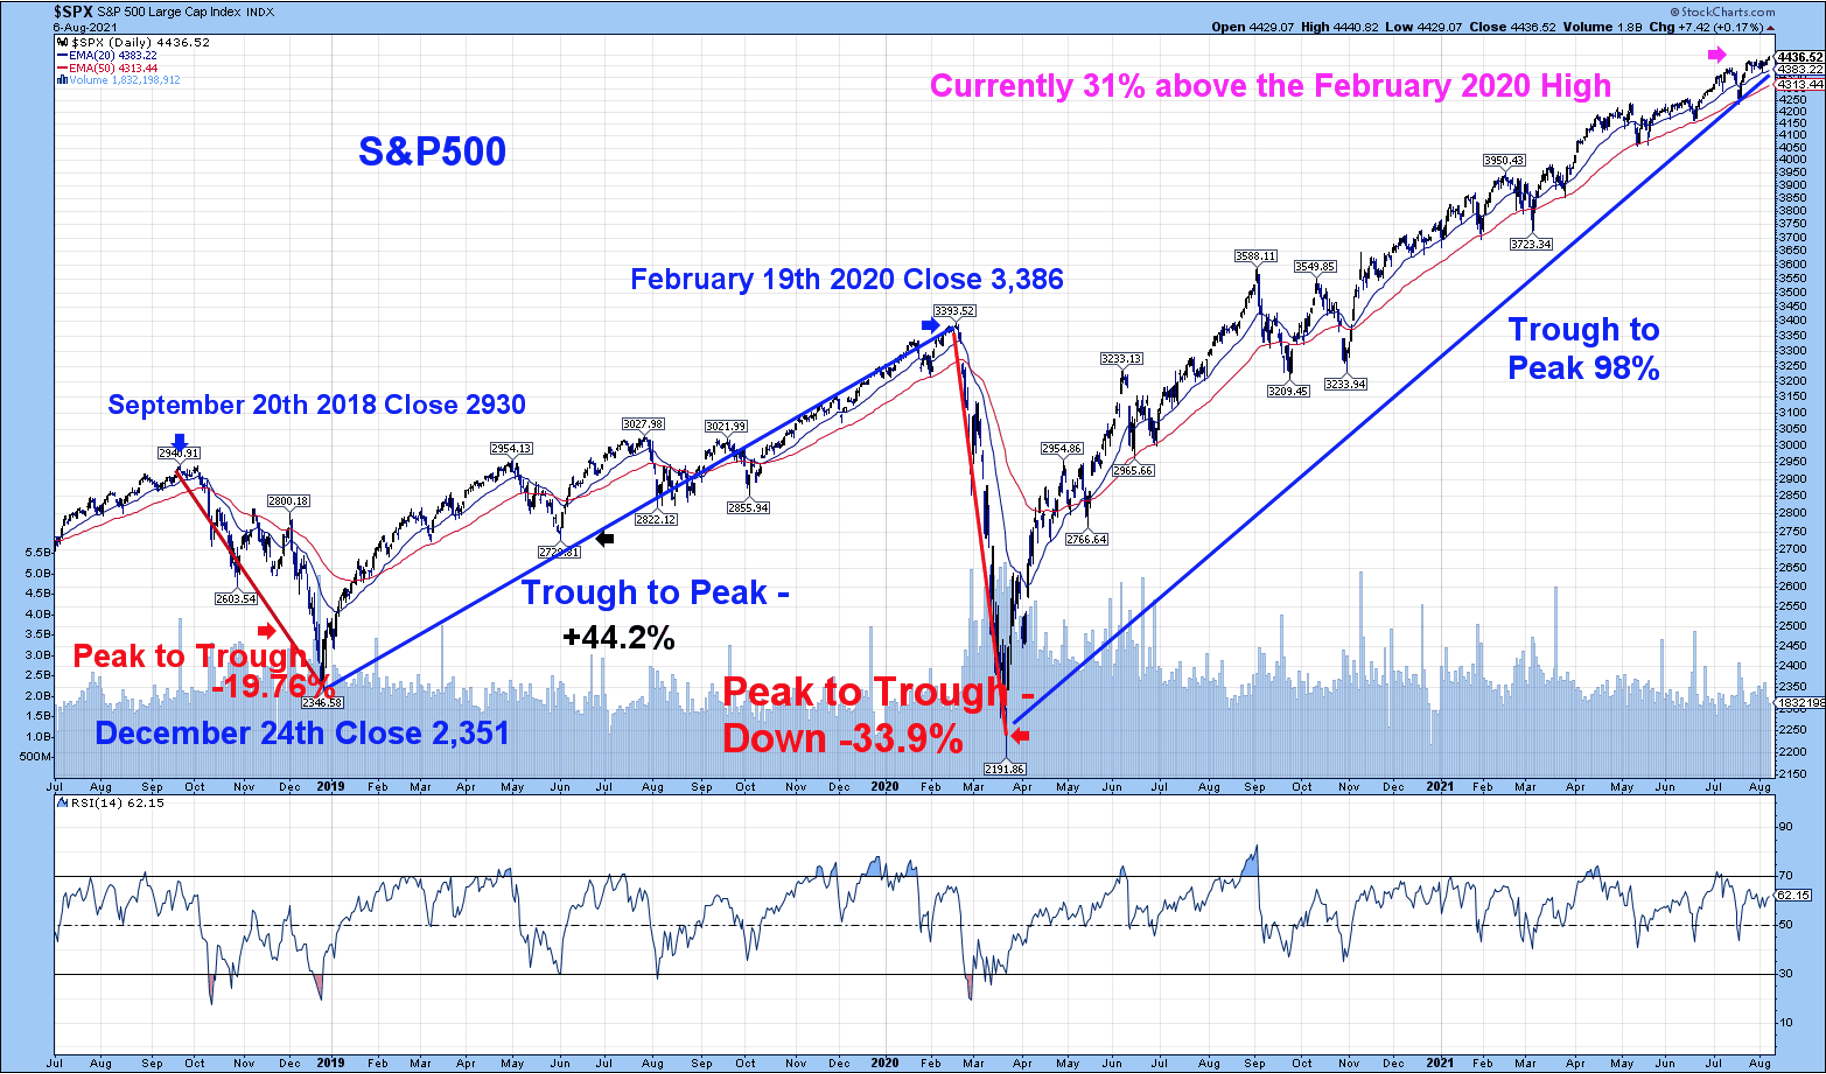
The S&P closed at yet another All-Time High again on Friday- This marked the 44th ATH of the year.
The big datapoint of the week was of course the jobs report. It was above expectations – The reopening economy added 943K jobs in July, there were massive gains in leisure and hospitality, adding 390k jobs. Average hourly earnings increased 0.4% m/m, slightly ahead of expectations, pushing the y/y increase to 4.0%. This table shows all of the monthly jobs data before after the last two recessions.

The unemployment rate declined 0.5% to 5.4%, better than the 5.7% consensus That 5.4% reading is the lowest post-covid
https://fred.stlouisfed.org/graph/fredgraph.png?g=FVY1
US equities finished higher this week. Growth +1.0% and value +0.9% were largely in line. Financials put in the best performance with the banks (BKX +4.3%) helped by a big backup in rates late in the week. Utilities rallied more than 2%. Tech was largely in with upside leadership from semis, growth software and HDDs. Communications services lagged with post-earnings weakness in the video game names though FB +2.0% and GOOGL +0.8% did well. While consumer discretionary trailed the tape, department stores and apparel and accessories names saw good gains. Industrials underperformed with most sub-groups mixed. Energy only finished slightly higher as oil suffered its worst week since last October. Consumer staples was the only sector to finish lower with weakness in the bulk of the HPC, food, beverage, and tobacco names. Staples retailers like WMT +1.9% and COST +2.3% bucked the trend.
Treasuries came under pressure this week with 10-year yields up 7 bp to 1.31%. The better-than-expected July employment report drove a big Friday selloff. Weakness may have been exacerbated by the extent of the rally over the last few months that has been partly chalked up to technical dynamics and met with a lot of skepticism on the Street. This week also brought more focus on the fallout from that rate move (Bloomberg), record-low real yields and a renewed surge in negative-yielding debt (FT). Citi was out with a call for 10-year Treasury yields to rise ~80 bp toward 2.0% into 2022, with real yields forecast to rise 70 bp. The dollar index was up 0.7%. Gold lost nearly 3%. WTI crude was down 7.7%.
This week’s upside came despite a continued ramp in concerns about a surge in coronavirus infections with the spread of the Delta variant. The virus spread also put some focus on the moderation in high frequency economic indicators, a looming benefits cliff and outsized weakness in key growth commodities like oil and copper. In addition, it seemed to counter some of the reflation trade enthusiasm still emanating from the Street. While earnings and revenue beat rates remained at or near record levels, this was not surprising and there was some focus on the lackluster reaction to Q2 results. Despite the progress on the bipartisan infrastructure deal, the path to additional fiscal stimulus remained complicated by an expected reconciliation bill focused on Democratic priorities.
This week saw another flurry of Q2 results and nearly 90% of the S&P 500 has now reported. According to FactSet’s latest Earnings Insight the blended earnings growth stands at nearly 89%, up from 52% at start of the quarter and 64% at the start of earnings season. The blended revenue growth rate is just under 25%, up from 16.5% at the start of the quarter and nearly 20% at the start of earnings season. The report noted that 87% have beaten consensus earnings expectations, on track for a record high. It added that 87% have surpassed consensus revenue expectations, also on track for a record high. In aggregate, companies have reported earnings 17.1% above expectations, well above the five-year average positive surprise rate of 7.8%. In aggregate, companies have reported earnings 4.9% above expectations, better than the five-year average of 1.2% and on track for a record high.
The Bipartisan infrastructure package is getting closer to passage, while the market is starting to focus on possible reconciliation bill. The Senate moved closer to the passage of a $1T bipartisan infrastructure package this week, even with the CBO’s estimate that it would raise the deficit by $256B over a decade (the bipartisan negotiating group had claimed it would be paid for). However, as has been the case for a while now, the path to additional fiscal stimulus remained complicated given the wide gap between progressives and moderates over the size of a separate reconciliation bill focused on Democratic priorities. While still seemingly on the back burner from a risk perspective, Senate Minority Leader McConnell stressed that Republicans will not go along with raising the debt ceiling if Democrats push ahead with their spending plans.
Fixed Income
July FOMC Statement FOMC Minutes Credit, Liquidity and Balance Sheet Federal Reserve Dot Plots
US Corporate Debt Tops 7 Trillion. Treasury.gov yields FOMC Policy Normalization Statement Longer Run Goals August 2020
Global Bond Yields
Daily US Treasury Yields
Foreign Exchange Market
Energy Complex
The Baker Hughes rig count increased by 3 this week. There are 491 oil and gas rigs operating in the US – Up 244 over last year.
Metals Complex
Employment Picture
July Jobs Report – BLS Summary Released 8/6/2021 – The US Economy added 943k nonfarm jobs in July and the Unemployment rate declined 0.5% to 5.4. Average hourly earnings increased by 11 cents to $30.54. Hiring highlights include+380k Leisure and Hospitality, +60k Professional and Business Services, +87 Education and Health Services, and +240k Government.
- Average hourly earnings increased by 11 cents to $30.54.
- U3 unemployment rate declined 0.5% to 5.4%. U6 unemployment rate declined to 9.2%.
- The labor force participation rate was little changed at 61.7%.
- Average work week was unchanged at 34.8 hours.
Weekly Unemployment Claims – Released Thursday 8/5/2021 – Initial jobless claims for the week ending July 31st decreased 14k to 385k. The 4-week moving average was 394k, a decrease of 250.
Employment Cost Index – Released 7/30/2021 – Compensation costs for civilian workers increased 0.7% for the 3-month period ending in June 2021. The 12-month period ending in June 2021 saw compensation costs increase by 2.9%. The 12-month period ending June 2020 increased 2.7%. Wages and salaries increased 3.2 percent over the year and increased 2.9 percent for the 12-month period ending in June 2020. Benefit costs increased 2.2 percent over the year and increased 2.2 percent for the 12-month period ending in June 2020. This report is published quarterly.
Job Openings & Labor Turnover Survey JOLTS – Released 7/7/2021 – The U.S. Bureau of Labor Statistics reported the number and rate of job openings was little changed at 9.2 million on the last business day of May. Over the month, hires were little changed at 5.9 million and separations decreased to 5.3 million. Within separations, the quits rate decreased to 2.5%. The layoffs and discharges rates decreased to 0.9%.
This Week’s Economic Data
Links take you to the data source
Consumer Credit – Released 8/6/2021 – Consumer credit increased at a seasonally adjusted annual rate of 8.8 percent in the second quarter of 2021. Revolving credit increased at an annual rate of 10.7 percent, while nonrevolving credit increased at an annual rate of 8.3 percent. In June, revolving credit increased at an annual rate of 22.0 percent, while nonrevolving credit increased at an annual rate of 7.2 percent.
U.S. Trade Balance – Released 8/5/2021 – According to the U.S. Census Bureau of Economic Analysis the goods and services deficit increased in June by $4.8 billion to $75.7 billion. June exports were $207.7 billion, $1.2 billion more than May exports. June imports were $283.4 billion, $6.0 billion more than May imports. Year to date the goods and services deficit increased $135.8 billion or 46.4%, from the same period in 2020. Year to date exports and imports increased $150.9 billion or 14.3% and increased $286.7 billion or 21.3% respectively.
PMI Non-Manufacturing Index – Released 8/4/2021 – Economic activity in the non-manufacturing sector grew in July for the 14th consecutive month. ISM Non-Manufacturing registered 64.1 percent, which is 4.0 percentage points above the adjusted June reading of 60.1 percent.
PMI Manufacturing Index – Released 8/2/2021 – July PMI declined 1.1% to 59.5% down from June’s reading of 60.6%. The New Orders Index was down 1.1% from June’s reading of 66.0% to 64.9%. The Production Index registered 58.4%, down 2.4%.
U.S. Construction Spending – Released 8/2/2021 – Construction spending increased 0.1% in June measuring at a seasonally adjusted annual rate of $1,552.2 billion. The June figure is 8.2% above the June 2020 estimate. Private construction spending was 0.4% above the revised May estimate at $1,215.2 billion. Public construction spending was 1.2% below the revised May estimate at $337.0 billion.
Recent Economic Data
Links take you to the data source
US Light Vehicle Sales – Released 7/30/2021 – U.S. light vehicle sales were at a seasonally adjusted annual rate (SAAR) of 15.388 million units in June.
Chicago PMI – Released 7/30/2021 – Chicago PMI increased to a two-month high at 73.4 points in July. Among the main five indicators, Production saw the largest increase, followed by New Orders, while Supplier Deliveries remained unchanged.
Personal Income – Released 7/30/2021 – Personal income increased $26.1 billion or 0.1 percent in June according to estimates released today by the Bureau of Economic Analysis. Disposable personal income (DPI) decreased $2.6 billion or 0.1 percent and personal consumption expenditures (PCE) increased $155.4 billion or 1.0 percent.
Advance Estimate of 2nd Quarter 2021 GDP – Released 7/29/2021 – Real gross domestic product (GDP) increased at an annual rate of 6.5 percent in the second quarter of 2021, according to the advance estimate released by the Bureau of Economic Analysis. The first quarter observed a 6.3 percent increase in real GDP. The GDP estimate released today is based on data that are incomplete or subject to additional revision. The increase in real GDP in the second quarter reflected increases in personal consumption expenditures (PCE), nonresidential fixed investment, exports, and state and local government spending that were partly offset by decreases in private inventory investment, residential fixed investment, and federal government spending. Imports, which are a subtraction in the calculation of GDP, increased.
Consumer Confidence – Released 7/27/2021 – The Consumer confidence index was relatively unchanged in June following five consecutive months of increases. The Index now shows its highest reading in a year of 129.1, up from 128.9 in June.
Durable Goods – Released 7/27/2021 – New orders for manufactured durable goods in June increased $2.1 billion or 0.8% to $257.6 billion. Transportation equipment led the increase rising $1.6 billion or 2.1% to $77.5 billion.
New Residential Sales – Released 7/26/2021 – Sales of new single-family homes decreased 6.6% to 724k, seasonally adjusted, in June. The median sales price of new homes sold in June was $361,800 with an average sales price of $428,700. At the end of June, the seasonally adjusted estimate of new homes for sale was 353k. This represents a supply of 6.3 months at the current sales rate.
Existing Home Sales – Released 7/22/2021 – Existing home sales increased in June ending four consecutive months of declines. Sales increased 1.4% to a seasonally adjusted rate of 5.86 million in June. Sales are currently up 22.9% from one year ago. Housing inventory sits at 1.25 million units. Up 3.3% from May’s inventory. Down 18.8% over last year. Unsold inventory sits at a 2.6-month supply. The median existing home price for all housing types was $363,300.
Housing Starts – Released 7/20/2021 – New home starts in June were at a seasonally adjusted annual rate of 1.643 million; up 6.3% above May, and 29.1% above last June’s rate. Building Permits were at a seasonally adjusted annual rate of 1.598 million, down 5.1% compared to May, but up 23.3% over last year.
Retail Sales – Released 7/16/2021 – U.S. retail sales for June increased 0.6% to $621.3 billion and retail sales are 18.0% above June 2020. U.S. retail sales are up 31.5% year/y.
Industrial Production and Capacity Utilization – Released 7/15/2021 – In June Industrial production increased 0.4%. Manufacturing declined 0.1%. Mining increased 1.4%. Utilities output increased 2.7%. Total industrial production was 9.8% higher in June than a year ago, but still 1.2% below its pre-pandemic level. Total capacity utilization increased 0.3% to 75.4% in June which is 4.2% below its long run average.
Producer Price Index – Released 7/14/2021 – The Producer Price Index for final demand increased 1.0% in June. PPI less food and energy increased 1.0% in June.
Consumer Price Index – Released 7/13/2021 – Consumer prices rose 0.9% m/m in June following a 0.64% gain in May. This marks the largest 1 month increase in CPI since June 2008 when CPI increased 1.0%. Core consumer prices increased 0.9% m/m in June following a 0.7% gain in May. Headline prices were up 5.4% y/y, the biggest increase since August 2008. Core prices were up 4.5% y/y, the biggest increase since November 1991.
Next week we get data on CPI, PPI, and JOLTS.
Data Sources:
Bureau of Economic Analysis (BEA)
Congressional Budget Office (CBO)
U.S. Bureau of Labor Statistics (BLS)
Federal Reserve Economic Data (FRED Charts)
CME Fed Watch
U.S. Treasury – Yields
U.S. Census Bureau
Institute for Supply Management (ISM)
Weekly DOL Employment Data
BLS Monthly Jobs Report
JOLTS
US Energy Admin (EIA)
BLS Consumer Price Index CPI
BLS Producer Price Index PPI
Atlanta Fed GDPNOW
NY Fed Nowcast GDP
US Census Bureau Housing Starts
Consumer Credit
USCB Retail Sales
Construction Spending
Federal Reserve Dot Plots
NY Empire Index
Philadelphia Federal Reserve
P/E Ratio Data -Yardeni Research
Technical Analysis Info:
StockCharts.com – Financial Charts
Exponential vs Simple moving average
Other Links:
1973 Arab Oil Embargo
Hunt Brothers Silver
Long-Term Capital bailout


Week 31 Talking Points
Good Life Advisors – Talking Points – Week 31
The S&P closed at yet another All-Time High again on Friday- This marked the 44th ATH of the year.
The big datapoint of the week was of course the jobs report. It was above expectations – The reopening economy added 943K jobs in July, there were massive gains in leisure and hospitality, adding 390k jobs. Average hourly earnings increased 0.4% m/m, slightly ahead of expectations, pushing the y/y increase to 4.0%. This table shows all of the monthly jobs data before after the last two recessions.
The unemployment rate declined 0.5% to 5.4%, better than the 5.7% consensus That 5.4% reading is the lowest post-covid
https://fred.stlouisfed.org/graph/fredgraph.png?g=FVY1
US equities finished higher this week. Growth +1.0% and value +0.9% were largely in line. Financials put in the best performance with the banks (BKX +4.3%) helped by a big backup in rates late in the week. Utilities rallied more than 2%. Tech was largely in with upside leadership from semis, growth software and HDDs. Communications services lagged with post-earnings weakness in the video game names though FB +2.0% and GOOGL +0.8% did well. While consumer discretionary trailed the tape, department stores and apparel and accessories names saw good gains. Industrials underperformed with most sub-groups mixed. Energy only finished slightly higher as oil suffered its worst week since last October. Consumer staples was the only sector to finish lower with weakness in the bulk of the HPC, food, beverage, and tobacco names. Staples retailers like WMT +1.9% and COST +2.3% bucked the trend.
Treasuries came under pressure this week with 10-year yields up 7 bp to 1.31%. The better-than-expected July employment report drove a big Friday selloff. Weakness may have been exacerbated by the extent of the rally over the last few months that has been partly chalked up to technical dynamics and met with a lot of skepticism on the Street. This week also brought more focus on the fallout from that rate move (Bloomberg), record-low real yields and a renewed surge in negative-yielding debt (FT). Citi was out with a call for 10-year Treasury yields to rise ~80 bp toward 2.0% into 2022, with real yields forecast to rise 70 bp. The dollar index was up 0.7%. Gold lost nearly 3%. WTI crude was down 7.7%.
This week’s upside came despite a continued ramp in concerns about a surge in coronavirus infections with the spread of the Delta variant. The virus spread also put some focus on the moderation in high frequency economic indicators, a looming benefits cliff and outsized weakness in key growth commodities like oil and copper. In addition, it seemed to counter some of the reflation trade enthusiasm still emanating from the Street. While earnings and revenue beat rates remained at or near record levels, this was not surprising and there was some focus on the lackluster reaction to Q2 results. Despite the progress on the bipartisan infrastructure deal, the path to additional fiscal stimulus remained complicated by an expected reconciliation bill focused on Democratic priorities.
This week saw another flurry of Q2 results and nearly 90% of the S&P 500 has now reported. According to FactSet’s latest Earnings Insight the blended earnings growth stands at nearly 89%, up from 52% at start of the quarter and 64% at the start of earnings season. The blended revenue growth rate is just under 25%, up from 16.5% at the start of the quarter and nearly 20% at the start of earnings season. The report noted that 87% have beaten consensus earnings expectations, on track for a record high. It added that 87% have surpassed consensus revenue expectations, also on track for a record high. In aggregate, companies have reported earnings 17.1% above expectations, well above the five-year average positive surprise rate of 7.8%. In aggregate, companies have reported earnings 4.9% above expectations, better than the five-year average of 1.2% and on track for a record high.
The Bipartisan infrastructure package is getting closer to passage, while the market is starting to focus on possible reconciliation bill. The Senate moved closer to the passage of a $1T bipartisan infrastructure package this week, even with the CBO’s estimate that it would raise the deficit by $256B over a decade (the bipartisan negotiating group had claimed it would be paid for). However, as has been the case for a while now, the path to additional fiscal stimulus remained complicated given the wide gap between progressives and moderates over the size of a separate reconciliation bill focused on Democratic priorities. While still seemingly on the back burner from a risk perspective, Senate Minority Leader McConnell stressed that Republicans will not go along with raising the debt ceiling if Democrats push ahead with their spending plans.
Table of Contents
Fixed Income
July FOMC Statement FOMC Minutes Credit, Liquidity and Balance Sheet Federal Reserve Dot Plots
US Corporate Debt Tops 7 Trillion. Treasury.gov yields FOMC Policy Normalization Statement Longer Run Goals August 2020
Global Bond Yields
Daily US Treasury Yields
Foreign Exchange Market
Energy Complex
The Baker Hughes rig count increased by 3 this week. There are 491 oil and gas rigs operating in the US – Up 244 over last year.
Metals Complex
Employment Picture
July Jobs Report – BLS Summary Released 8/6/2021 – The US Economy added 943k nonfarm jobs in July and the Unemployment rate declined 0.5% to 5.4. Average hourly earnings increased by 11 cents to $30.54. Hiring highlights include+380k Leisure and Hospitality, +60k Professional and Business Services, +87 Education and Health Services, and +240k Government.
Weekly Unemployment Claims – Released Thursday 8/5/2021 – Initial jobless claims for the week ending July 31st decreased 14k to 385k. The 4-week moving average was 394k, a decrease of 250.
Employment Cost Index – Released 7/30/2021 – Compensation costs for civilian workers increased 0.7% for the 3-month period ending in June 2021. The 12-month period ending in June 2021 saw compensation costs increase by 2.9%. The 12-month period ending June 2020 increased 2.7%. Wages and salaries increased 3.2 percent over the year and increased 2.9 percent for the 12-month period ending in June 2020. Benefit costs increased 2.2 percent over the year and increased 2.2 percent for the 12-month period ending in June 2020. This report is published quarterly.
Job Openings & Labor Turnover Survey JOLTS – Released 7/7/2021 – The U.S. Bureau of Labor Statistics reported the number and rate of job openings was little changed at 9.2 million on the last business day of May. Over the month, hires were little changed at 5.9 million and separations decreased to 5.3 million. Within separations, the quits rate decreased to 2.5%. The layoffs and discharges rates decreased to 0.9%.
This Week’s Economic Data
Links take you to the data source
Consumer Credit – Released 8/6/2021 – Consumer credit increased at a seasonally adjusted annual rate of 8.8 percent in the second quarter of 2021. Revolving credit increased at an annual rate of 10.7 percent, while nonrevolving credit increased at an annual rate of 8.3 percent. In June, revolving credit increased at an annual rate of 22.0 percent, while nonrevolving credit increased at an annual rate of 7.2 percent.
U.S. Trade Balance – Released 8/5/2021 – According to the U.S. Census Bureau of Economic Analysis the goods and services deficit increased in June by $4.8 billion to $75.7 billion. June exports were $207.7 billion, $1.2 billion more than May exports. June imports were $283.4 billion, $6.0 billion more than May imports. Year to date the goods and services deficit increased $135.8 billion or 46.4%, from the same period in 2020. Year to date exports and imports increased $150.9 billion or 14.3% and increased $286.7 billion or 21.3% respectively.
PMI Non-Manufacturing Index – Released 8/4/2021 – Economic activity in the non-manufacturing sector grew in July for the 14th consecutive month. ISM Non-Manufacturing registered 64.1 percent, which is 4.0 percentage points above the adjusted June reading of 60.1 percent.
PMI Manufacturing Index – Released 8/2/2021 – July PMI declined 1.1% to 59.5% down from June’s reading of 60.6%. The New Orders Index was down 1.1% from June’s reading of 66.0% to 64.9%. The Production Index registered 58.4%, down 2.4%.
U.S. Construction Spending – Released 8/2/2021 – Construction spending increased 0.1% in June measuring at a seasonally adjusted annual rate of $1,552.2 billion. The June figure is 8.2% above the June 2020 estimate. Private construction spending was 0.4% above the revised May estimate at $1,215.2 billion. Public construction spending was 1.2% below the revised May estimate at $337.0 billion.
Recent Economic Data
Links take you to the data source
US Light Vehicle Sales – Released 7/30/2021 – U.S. light vehicle sales were at a seasonally adjusted annual rate (SAAR) of 15.388 million units in June.
Chicago PMI – Released 7/30/2021 – Chicago PMI increased to a two-month high at 73.4 points in July. Among the main five indicators, Production saw the largest increase, followed by New Orders, while Supplier Deliveries remained unchanged.
Personal Income – Released 7/30/2021 – Personal income increased $26.1 billion or 0.1 percent in June according to estimates released today by the Bureau of Economic Analysis. Disposable personal income (DPI) decreased $2.6 billion or 0.1 percent and personal consumption expenditures (PCE) increased $155.4 billion or 1.0 percent.
Advance Estimate of 2nd Quarter 2021 GDP – Released 7/29/2021 – Real gross domestic product (GDP) increased at an annual rate of 6.5 percent in the second quarter of 2021, according to the advance estimate released by the Bureau of Economic Analysis. The first quarter observed a 6.3 percent increase in real GDP. The GDP estimate released today is based on data that are incomplete or subject to additional revision. The increase in real GDP in the second quarter reflected increases in personal consumption expenditures (PCE), nonresidential fixed investment, exports, and state and local government spending that were partly offset by decreases in private inventory investment, residential fixed investment, and federal government spending. Imports, which are a subtraction in the calculation of GDP, increased.
Consumer Confidence – Released 7/27/2021 – The Consumer confidence index was relatively unchanged in June following five consecutive months of increases. The Index now shows its highest reading in a year of 129.1, up from 128.9 in June.
Durable Goods – Released 7/27/2021 – New orders for manufactured durable goods in June increased $2.1 billion or 0.8% to $257.6 billion. Transportation equipment led the increase rising $1.6 billion or 2.1% to $77.5 billion.
New Residential Sales – Released 7/26/2021 – Sales of new single-family homes decreased 6.6% to 724k, seasonally adjusted, in June. The median sales price of new homes sold in June was $361,800 with an average sales price of $428,700. At the end of June, the seasonally adjusted estimate of new homes for sale was 353k. This represents a supply of 6.3 months at the current sales rate.
Existing Home Sales – Released 7/22/2021 – Existing home sales increased in June ending four consecutive months of declines. Sales increased 1.4% to a seasonally adjusted rate of 5.86 million in June. Sales are currently up 22.9% from one year ago. Housing inventory sits at 1.25 million units. Up 3.3% from May’s inventory. Down 18.8% over last year. Unsold inventory sits at a 2.6-month supply. The median existing home price for all housing types was $363,300.
Housing Starts – Released 7/20/2021 – New home starts in June were at a seasonally adjusted annual rate of 1.643 million; up 6.3% above May, and 29.1% above last June’s rate. Building Permits were at a seasonally adjusted annual rate of 1.598 million, down 5.1% compared to May, but up 23.3% over last year.
Retail Sales – Released 7/16/2021 – U.S. retail sales for June increased 0.6% to $621.3 billion and retail sales are 18.0% above June 2020. U.S. retail sales are up 31.5% year/y.
Industrial Production and Capacity Utilization – Released 7/15/2021 – In June Industrial production increased 0.4%. Manufacturing declined 0.1%. Mining increased 1.4%. Utilities output increased 2.7%. Total industrial production was 9.8% higher in June than a year ago, but still 1.2% below its pre-pandemic level. Total capacity utilization increased 0.3% to 75.4% in June which is 4.2% below its long run average.
Producer Price Index – Released 7/14/2021 – The Producer Price Index for final demand increased 1.0% in June. PPI less food and energy increased 1.0% in June.
Consumer Price Index – Released 7/13/2021 – Consumer prices rose 0.9% m/m in June following a 0.64% gain in May. This marks the largest 1 month increase in CPI since June 2008 when CPI increased 1.0%. Core consumer prices increased 0.9% m/m in June following a 0.7% gain in May. Headline prices were up 5.4% y/y, the biggest increase since August 2008. Core prices were up 4.5% y/y, the biggest increase since November 1991.
Next week we get data on CPI, PPI, and JOLTS.
Data Sources:
Bureau of Economic Analysis (BEA)
Congressional Budget Office (CBO)
U.S. Bureau of Labor Statistics (BLS)
Federal Reserve Economic Data (FRED Charts)
CME Fed Watch
U.S. Treasury – Yields
U.S. Census Bureau
Institute for Supply Management (ISM)
Weekly DOL Employment Data
BLS Monthly Jobs Report
JOLTS
US Energy Admin (EIA)
BLS Consumer Price Index CPI
BLS Producer Price Index PPI
Atlanta Fed GDPNOW
NY Fed Nowcast GDP
US Census Bureau Housing Starts
Consumer Credit
USCB Retail Sales
Construction Spending
Federal Reserve Dot Plots
NY Empire Index
Philadelphia Federal Reserve
P/E Ratio Data -Yardeni Research
Technical Analysis Info:
StockCharts.com – Financial Charts
Exponential vs Simple moving average
Other Links:
1973 Arab Oil Embargo
Hunt Brothers Silver
Long-Term Capital bailout
Categories:
Tags: