Good Life Advisors – Talking Points – Week 21
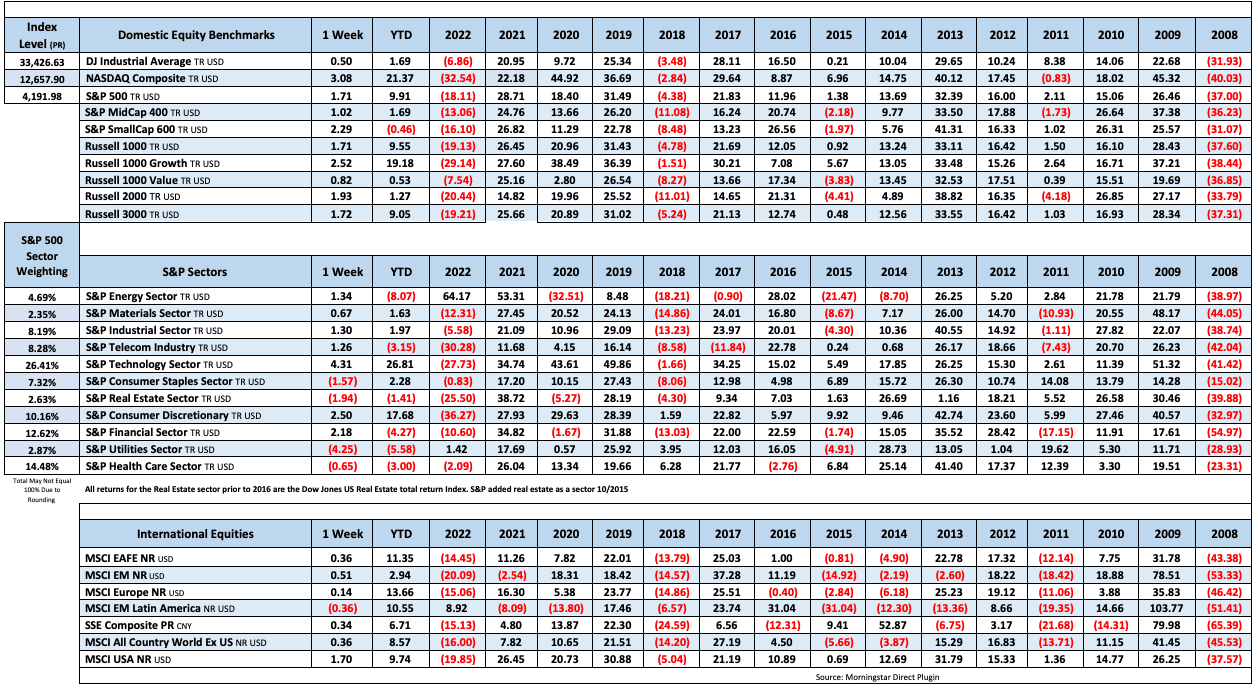
US equities were higher this week, with the S&P 500 up for the first time in three weeks and breaking its six week streak of absolute changes of less than 1%. Nasdaq was higher for a fourth-straight week. Some of the best performers included cyclical and growth groups, including the FANMAGs, software, semis, banks, travel and leisure, airlines, credit cards, restaurants, and media and entertainment. Some of the laggards included some defensive and flight-to-safety groups including managed care, precious metals miners, food and beverage, HPC, and telecom. Treasuries saw a big selloff across the curve, with the 2Y back near 4.30% and at the highest level since mid-March. The dollar index was up 0.6% with the best gains on the yen cross. Gold finished the week down 1.9%. WTI crude ended the week up 2.4%, the first weekly gain in five weeks.
The week’s upside was driven by factors including optimism around a debt ceiling resolution, more support around the soft landing narrative, positive economic data takeaways, and tech leadership and some positive spillover into semis and AI. Banks were also a big support this week as fears around regional banks continued to subside. BofA analysts said that indicators suggest the shock of the March banking turmoil are relatively contained and the resulting tightening of financial conditions is limited. Earnings season takeaways remained positive as companies have seen tailwinds from cost-cutting, pricing power, and dampened input costs. Other pieces of the bullish narrative include depressed positioning and sentiment, flows from volatility control funds and buybacks.
Some of the bearish narratives of the week included a big backup in rates amid resilient data, debt ceiling uncertainty after some negative Friday updates, and a repricing for a more hawkish Fed. Narrow breadth and tech valuations also remains key overhangs as upside continues to be narrowly driven by big tech. Bank of America strategists warned this week that tech and AI are forming a bubble. Some of the other pieces of the bearish story include weakening consumer/retail trends and CRE still seen as the next show to drop.
Fedspeak this week offered mixed takeaways. Fed Chair Powell said risks of doing too much vs too little have become more balanced. Powell said that while no decisions have been made regarding additional policy firmness, the Fed can afford to look at data and make careful assessments given progress made so far. Powell’s commentary was more measured than the batch of hawkish Fedspeak that added doubt to a June pause. Dallas Fed’s Logan (voter) said data in the coming weeks could show that it is appropriate to skip a rate hike in June, though as of now, the data do not yet justify a pause. St. Louis Fed’s Bullard (non-voter) also said disinflation has been slower than he would like and that the Fed could “take out insurance” by raising rates further. Market pricing around a 25 bp June rate hike were fairly volatile, rising above 45% before ending the week under 20%,. Overall, markets repriced this week to match the Fed’s higher-for-longer outlook, with the year-end median fed funds rate of 4.72% up from 4.42% last week.
Debt ceiling talks hit a snag on Friday after GOP negotiators walked out of a meeting with White House representatives, saying talks were now on a pause. The halt came after both sides made progress earlier this week, with House Speaker McCarthy saying Thursday that talks were in a much better place and that he expected a deal on the House floor next week.
Some of the key thematic takeaways from this week’s retail earnings included normalization of pandemic-era trends (HD +0.1%), customers cutting back in discretionary items (TGT -3.6%), grocery strength through shifts to private label brands (WMT -2.1%), inflationary pressure on consumers (ROST +0.2%), cost optimization tailwinds (BBWI +12.2%), markdowns following weak demand (FL -23%), and still-elevated inventories (ONON -18.8%). Overall, analysts noted that the performance of retail giants indicate that while the consumer is not retrenching, they are becoming more cautious and focusing on essentials. Though the spending shifts became clearer this quarter, some noted that consumer resilience is still a key factor keeping the economy from slipping into recession.
The week’s economic data added support to the soft landing narrative, including positive takeaways from data including April retail sales, NAHB builder confidence, and housing starts. Initial jobless claims also came in better than expected, the latest labor market datapoint to show a slowdown in areas like job openings and wage growth while employment has remained relatively stable. The Philly Fed Index also beat, though prices paid rose after falling to a three-year low in March, though the Empire State manufacturing index fell to the lowest since Apr-20.
Fixed Income

Yield Curve
Some fairly large moves higher across the curve this week.
May FOMC Statement March Fed Minutes Balance Sheet Reduction Plan Credit, Liquidity and Balance Sheet Federal Reserve Dot Plots
Treasury.gov yields FOMC Policy Normalization Statement Longer- Run Goals Jan 2022
Foreign Exchange Market
Energy Complex
The Baker Hughes rig count was down by 11 this week. There are 720 oil and gas rigs operating in the US – Down 8 over last year.
Metals Complex
Employment Picture
Weekly Unemployment Claims – Released Thursday 5/11/2023 – In the week ending May 13, the advance figure for seasonally adjusted initial claims was 242,000, a decrease of 22,000 from the previous week’s unrevised level of 264,000. The 4-week moving average was 244,250, a decrease of 1,000 from the previous week’s unrevised average of 245,250.
April Jobs Report – BLS Summary – Released 5/5/2023 – The US Economy added 253k nonfarm jobs in April and the Unemployment rate was little changed at 3.5%. Average hourly earnings increased 9 cents to $33.18. Hiring highlights include +32k Leisure and Hospitality, +77k Education and Health Services, +23 Government, and +43k Professional and Business Services.
- Average hourly earnings increased 16 cents/0.5% to $33.18.
- U3 unemployment rate was little changed at 3.5%. U6 unemployment rate decreased 0.1% to 6.7%.
- The labor force participation rate was little changed at 62.6%.
- Average work week was unchanged by at 34.4 hours.
Job Openings & Labor Turnover Survey JOLTS – Released 5/4/2023 – The number of job openings decreased to 9.9 million on the last business day of February, the U.S. Bureau of Labor Statistics reported. Over the month the number of hires and total separations changed little at 6.2 million and 5.8 million, respectively. Within separations, quits (4.0 million) increased and layoffs and discharges (1.5 million) decreased.
Employment Cost Index – Released 1/31/2023 – Compensation costs for civilian workers increased 1.0% for the 3-month period ending in December 2022. The 12-month period ending on December 2022 saw compensation costs increase by 5.1%. The 12-month period ending December 2021 increased 4.0%. Wages and salaries increased 5.1 percent over the year and increased 4.5 percent for the 12-month period ending in December 2021. Benefit costs increased 4.9 percent over the year and increased 2.8 percent for the 12-month period ending in December 2021. This report is published quarterly.
This Week’s Economic Data
Links take you to the data source
Housing Starts – Released 5/17/2023 – April housing starts came in at a 1401K SAAR, nearly in line with 1400K consensus. Highest monthly pace since June 2022. Better than March’s 1371K, which saw a big downward revision from the original 1420K print. Starts up 2.2% m/m though down 22.3% y/y. Data noted upshift in both single-family and multifamily construction. Biggest increases in West, while all other regions saw decline in single-family starts
Industrial Production and Capacity Utilization – Released 5/16/2023 – Industrial production increased 0.5% in April (0.0% including revisions to prior months) versus a consensus expected 0.0%. Utilities output fell 3.1% in April, Overall capacity utilization rose to 79.7% in April from 79.4% in March.
Manufacturing capacity utilization increased to 78.3% in April from 77.6% while mining rose 0.6%.
Retail Sales – Released 5/16/2023 – Headline retail sales up 0.4% m/m, missing consensus for 0.8% growth, though March revised up to -0.7% from initial 1.0% decline. Retail sales ex-autos of 0.4% below 0.5% consensus, while March also revised up 0.4pp to a 0.5% decline. Retail sales ex-autos and fuel of 0.6% beat 0.3% consensus, reversing last month’s 0.5% decline
Recent Economic Data
Links take you to the data source
Consumer Price Index – Released 5/10/2023 – The Consumer Price Index for All Urban Consumers rose 0.4 percent in April on a seasonally adjusted basis, after increasing 0.1 percent in March. Over the last 12 months, the all-items index increased 4.9 percent before seasonal adjustment. This was the smallest 12-month increase since the period ending April 2021. The index for all items less food and energy rose 0.4 percent in April, as it did in March. Indexes which increased in April include shelter, used cars and trucks, motor vehicle insurance, recreation, household furnishings and operations, and personal care.
Producer Price Index – Released 5/11/2023 – The Producer Price Index for final demand advanced 0.2 percent in April, seasonally adjusted, Final demand prices fell 0.4 percent in March and were unchanged in February. On an unadjusted basis, the index for final demand moved up 2.3 percent for the 12 months ended in April.
Consumer Credit – Released 4/5/2023 – Consumer credit increased at a seasonally adjusted annual rate of 5.4 percent during the first quarter. Revolving credit increased at an annual rate of 12.3 percent, while nonrevolving credit increased at an annual rate of 3.1 percent. In March, consumer credit increased 6.6 percent.
U.S. Construction Spending – Released 5/1/2023 – Construction spending during March 2023 was estimated at a seasonally adjusted annual rate of $1,844.7 billion, 0.3 percent above the revised February estimate of $1,829.6 billion. The March figure is 3.8 percent above the March 2022 estimate of $1,768.2 billion
U.S. Trade Balance – Released 5/4/2023 – The U.S. Census Bureau and the U.S. Bureau of Economic Analysis announced that the goods and services deficit was $64.2 billion in March, down $6.4 billion from $70.6 billion in February, revised. March exports were $256.2 billion, $5.3 billion more than February exports. March imports were $320.4 billion, $1.1 billion less than February imports. The March decrease in the goods and services deficit reflected a decrease in the goods deficit of $6.4 billion to $86.6 billion and a decrease in the services surplus of less than $0.1 billion to $22.4 billion.
PMI Manufacturing Index – Released 5/3/2023 – The April Manufacturing PMI® registered 47.1 percent, 0.8 percentage points higher than the 46.3 percent recorded in March. Regarding the overall economy, this figure indicates a fifth month of contraction after a 30-month period of expansion. The New Orders Index remained in contraction territory at 45.7 percent, 1.4 percentage points higher than the figure of 44.3 percent recorded in March. The Production Index reading of 48.9 percent is a 1.1-percentage point increase compared to March’s figure of 47.8 percent.
PMI Non-Manufacturing Index – Released 5/5/2023 – Economic activity in the services sector expanded in April for the fourth consecutive month as the Services PMI® registered 51.9 percent, 0.7 percentage point higher than March’s reading of 51.2 percent. The composite index indicated growth in April for the fourth consecutive month after a reading of 49.2 percent in December, the first contraction since May 2020.
Chicago PMI – Released 4/28/2023 – Chicago PMI remained in contraction territory but increased in April to 48.6 points up from 43.8 points in February. This marks eight months in contractionary territory.
US Light Vehicle Sales – Released 4/28/2023 – U.S. light vehicle sales were at a seasonally adjusted annual rate (SAAR) of 14.838 million units in March.
Personal Income – Released 4/28/2023 – Personal income increased $67.9 billion (0.3 percent) in March, according to estimates by the Bureau of Economic Analysis. Disposable personal income (DPI) increased $71.7 billion (0.4 percent) and personal consumption expenditures (PCE) increased $8.2 billion (less than 0.1 percent). The PCE price index increased 0.1 percent. Excluding food and energy, the PCE price index increased 0.3 percent. Real DPI increased 0.3 percent in March and Real PCE decreased less than 0.1 percent; goods decreased 0.4 percent and services increased 0.1 percent.
Advance Estimate of 1th Quarter 2023 GDP – Released 4/27/2023 – Real gross domestic product (GDP) increased at an annual rate of 1.1 percent in the first quarter of 2023, according to the “advance” estimate released by the Bureau of Economic Analysis. In the fourth quarter, real GDP increased 2.6 percent. The increase in real GDP reflected increases in consumer spending, exports, federal government spending, state and local government spending, and nonresidential fixed investment that were partly offset by decreases in private inventory investment and residential fixed investment. Imports, which are a subtraction in the calculation of GDP, increased
Durable Goods – Released 4/26/2023 – New orders for manufactured durable goods in March were up $8.6 billion or 3.2 percent to $276.4 billion, this followed two consecutive monthly decreases, Excluding transportation, new orders increased 0.3 percent. Excluding defense, new orders increased 3.5 percent. The march increase was mostly a result of stronger transportation equipment purchases.
New Residential Sales – Released 4/25/2023 – Sales of new single‐family houses in March 2023 were at a seasonally adjusted annual rate of 683,000, according to estimates released jointly today by the U.S. Census Bureau and the Department of Housing and Urban Development. This is 9.6 percent above the revised February rate of 623,000, but is 3.4 percent below the March 2022 estimate of 707,000
Consumer Confidence – Released 4/25/2023 – The Conference Board Consumer Confidence Index® fell in April to 101.3, down from 104.0 in March. The Present Situation Index—based on consumers’ assessment of current business and labor market conditions—increased to 151.1 from 148.9 last month. The Expectations Index—based on consumers’ short-term outlook for income, business, and labor market conditions—fell to 68.1 from 74.0. The Expectations Index has now remained below 80—the level associated with a recession within the next year—every month since February 2022, with the exception of a brief uptick in December 2022. The survey was fielded from April 3—about three weeks after the bank failures in the United States—to April 19.
Existing Home Sales – Released 4/20/2023 – Existing home sales decreased in March. Sales decreased 2.4% to a seasonally adjusted rate of 4.44 million in March. Sales decreased 22.0% year-over-year. Housing inventory sits at 980k units. Up 1.0% over February. Up 5.4% over last year. Unsold inventory sits at a 2.6-month supply. The median existing home price for all housing types was $375,700, which is down 0.9% from March 2022.
Data Sources:
Bureau of Economic Analysis (BEA)
Congressional Budget Office (CBO)
U.S. Bureau of Labor Statistics (BLS)
Federal Reserve Economic Data (FRED Charts)
CME Fed Watch
U.S. Treasury – Yields
U.S. Census Bureau
Institute for Supply Management (ISM)
Weekly DOL Employment Data
BLS Monthly Jobs Report
JOLTS
US Energy Admin (EIA)
BLS Consumer Price Index CPI
BLS Producer Price Index PPI
Atlanta Fed GDPNOW
NY Fed Nowcast GDP
US Census Bureau Housing Starts
Consumer Credit
USCB Retail Sales
Construction Spending
Federal Reserve Dot Plots
NY Empire Index
Philadelphia Federal Reserve
P/E Ratio Data -Yardeni Research
Technical Analysis Info:
StockCharts.com – Financial Charts
Exponential vs Simple moving average
Other Links:
1973 Arab Oil Embargo
Hunt Brothers Silver
Long-Term Capital bailout


Week 21 Talking Points
Table of Contents
Good Life Advisors – Talking Points – Week 21
US equities were higher this week, with the S&P 500 up for the first time in three weeks and breaking its six week streak of absolute changes of less than 1%. Nasdaq was higher for a fourth-straight week. Some of the best performers included cyclical and growth groups, including the FANMAGs, software, semis, banks, travel and leisure, airlines, credit cards, restaurants, and media and entertainment. Some of the laggards included some defensive and flight-to-safety groups including managed care, precious metals miners, food and beverage, HPC, and telecom. Treasuries saw a big selloff across the curve, with the 2Y back near 4.30% and at the highest level since mid-March. The dollar index was up 0.6% with the best gains on the yen cross. Gold finished the week down 1.9%. WTI crude ended the week up 2.4%, the first weekly gain in five weeks.
The week’s upside was driven by factors including optimism around a debt ceiling resolution, more support around the soft landing narrative, positive economic data takeaways, and tech leadership and some positive spillover into semis and AI. Banks were also a big support this week as fears around regional banks continued to subside. BofA analysts said that indicators suggest the shock of the March banking turmoil are relatively contained and the resulting tightening of financial conditions is limited. Earnings season takeaways remained positive as companies have seen tailwinds from cost-cutting, pricing power, and dampened input costs. Other pieces of the bullish narrative include depressed positioning and sentiment, flows from volatility control funds and buybacks.
Some of the bearish narratives of the week included a big backup in rates amid resilient data, debt ceiling uncertainty after some negative Friday updates, and a repricing for a more hawkish Fed. Narrow breadth and tech valuations also remains key overhangs as upside continues to be narrowly driven by big tech. Bank of America strategists warned this week that tech and AI are forming a bubble. Some of the other pieces of the bearish story include weakening consumer/retail trends and CRE still seen as the next show to drop.
Fedspeak this week offered mixed takeaways. Fed Chair Powell said risks of doing too much vs too little have become more balanced. Powell said that while no decisions have been made regarding additional policy firmness, the Fed can afford to look at data and make careful assessments given progress made so far. Powell’s commentary was more measured than the batch of hawkish Fedspeak that added doubt to a June pause. Dallas Fed’s Logan (voter) said data in the coming weeks could show that it is appropriate to skip a rate hike in June, though as of now, the data do not yet justify a pause. St. Louis Fed’s Bullard (non-voter) also said disinflation has been slower than he would like and that the Fed could “take out insurance” by raising rates further. Market pricing around a 25 bp June rate hike were fairly volatile, rising above 45% before ending the week under 20%,. Overall, markets repriced this week to match the Fed’s higher-for-longer outlook, with the year-end median fed funds rate of 4.72% up from 4.42% last week.
Debt ceiling talks hit a snag on Friday after GOP negotiators walked out of a meeting with White House representatives, saying talks were now on a pause. The halt came after both sides made progress earlier this week, with House Speaker McCarthy saying Thursday that talks were in a much better place and that he expected a deal on the House floor next week.
Some of the key thematic takeaways from this week’s retail earnings included normalization of pandemic-era trends (HD +0.1%), customers cutting back in discretionary items (TGT -3.6%), grocery strength through shifts to private label brands (WMT -2.1%), inflationary pressure on consumers (ROST +0.2%), cost optimization tailwinds (BBWI +12.2%), markdowns following weak demand (FL -23%), and still-elevated inventories (ONON -18.8%). Overall, analysts noted that the performance of retail giants indicate that while the consumer is not retrenching, they are becoming more cautious and focusing on essentials. Though the spending shifts became clearer this quarter, some noted that consumer resilience is still a key factor keeping the economy from slipping into recession.
The week’s economic data added support to the soft landing narrative, including positive takeaways from data including April retail sales, NAHB builder confidence, and housing starts. Initial jobless claims also came in better than expected, the latest labor market datapoint to show a slowdown in areas like job openings and wage growth while employment has remained relatively stable. The Philly Fed Index also beat, though prices paid rose after falling to a three-year low in March, though the Empire State manufacturing index fell to the lowest since Apr-20.
Fixed Income
Yield Curve
Some fairly large moves higher across the curve this week.
May FOMC Statement March Fed Minutes Balance Sheet Reduction Plan Credit, Liquidity and Balance Sheet Federal Reserve Dot Plots
Treasury.gov yields FOMC Policy Normalization Statement Longer- Run Goals Jan 2022
Foreign Exchange Market
Energy Complex
The Baker Hughes rig count was down by 11 this week. There are 720 oil and gas rigs operating in the US – Down 8 over last year.
Metals Complex
Employment Picture
Weekly Unemployment Claims – Released Thursday 5/11/2023 – In the week ending May 13, the advance figure for seasonally adjusted initial claims was 242,000, a decrease of 22,000 from the previous week’s unrevised level of 264,000. The 4-week moving average was 244,250, a decrease of 1,000 from the previous week’s unrevised average of 245,250.
April Jobs Report – BLS Summary – Released 5/5/2023 – The US Economy added 253k nonfarm jobs in April and the Unemployment rate was little changed at 3.5%. Average hourly earnings increased 9 cents to $33.18. Hiring highlights include +32k Leisure and Hospitality, +77k Education and Health Services, +23 Government, and +43k Professional and Business Services.
Job Openings & Labor Turnover Survey JOLTS – Released 5/4/2023 – The number of job openings decreased to 9.9 million on the last business day of February, the U.S. Bureau of Labor Statistics reported. Over the month the number of hires and total separations changed little at 6.2 million and 5.8 million, respectively. Within separations, quits (4.0 million) increased and layoffs and discharges (1.5 million) decreased.
Employment Cost Index – Released 1/31/2023 – Compensation costs for civilian workers increased 1.0% for the 3-month period ending in December 2022. The 12-month period ending on December 2022 saw compensation costs increase by 5.1%. The 12-month period ending December 2021 increased 4.0%. Wages and salaries increased 5.1 percent over the year and increased 4.5 percent for the 12-month period ending in December 2021. Benefit costs increased 4.9 percent over the year and increased 2.8 percent for the 12-month period ending in December 2021. This report is published quarterly.
This Week’s Economic Data
Links take you to the data source
Housing Starts – Released 5/17/2023 – April housing starts came in at a 1401K SAAR, nearly in line with 1400K consensus. Highest monthly pace since June 2022. Better than March’s 1371K, which saw a big downward revision from the original 1420K print. Starts up 2.2% m/m though down 22.3% y/y. Data noted upshift in both single-family and multifamily construction. Biggest increases in West, while all other regions saw decline in single-family starts
Industrial Production and Capacity Utilization – Released 5/16/2023 – Industrial production increased 0.5% in April (0.0% including revisions to prior months) versus a consensus expected 0.0%. Utilities output fell 3.1% in April, Overall capacity utilization rose to 79.7% in April from 79.4% in March.
Manufacturing capacity utilization increased to 78.3% in April from 77.6% while mining rose 0.6%.
Retail Sales – Released 5/16/2023 – Headline retail sales up 0.4% m/m, missing consensus for 0.8% growth, though March revised up to -0.7% from initial 1.0% decline. Retail sales ex-autos of 0.4% below 0.5% consensus, while March also revised up 0.4pp to a 0.5% decline. Retail sales ex-autos and fuel of 0.6% beat 0.3% consensus, reversing last month’s 0.5% decline
Recent Economic Data
Links take you to the data source
Consumer Price Index – Released 5/10/2023 – The Consumer Price Index for All Urban Consumers rose 0.4 percent in April on a seasonally adjusted basis, after increasing 0.1 percent in March. Over the last 12 months, the all-items index increased 4.9 percent before seasonal adjustment. This was the smallest 12-month increase since the period ending April 2021. The index for all items less food and energy rose 0.4 percent in April, as it did in March. Indexes which increased in April include shelter, used cars and trucks, motor vehicle insurance, recreation, household furnishings and operations, and personal care.
Producer Price Index – Released 5/11/2023 – The Producer Price Index for final demand advanced 0.2 percent in April, seasonally adjusted, Final demand prices fell 0.4 percent in March and were unchanged in February. On an unadjusted basis, the index for final demand moved up 2.3 percent for the 12 months ended in April.
Consumer Credit – Released 4/5/2023 – Consumer credit increased at a seasonally adjusted annual rate of 5.4 percent during the first quarter. Revolving credit increased at an annual rate of 12.3 percent, while nonrevolving credit increased at an annual rate of 3.1 percent. In March, consumer credit increased 6.6 percent.
U.S. Construction Spending – Released 5/1/2023 – Construction spending during March 2023 was estimated at a seasonally adjusted annual rate of $1,844.7 billion, 0.3 percent above the revised February estimate of $1,829.6 billion. The March figure is 3.8 percent above the March 2022 estimate of $1,768.2 billion
U.S. Trade Balance – Released 5/4/2023 – The U.S. Census Bureau and the U.S. Bureau of Economic Analysis announced that the goods and services deficit was $64.2 billion in March, down $6.4 billion from $70.6 billion in February, revised. March exports were $256.2 billion, $5.3 billion more than February exports. March imports were $320.4 billion, $1.1 billion less than February imports. The March decrease in the goods and services deficit reflected a decrease in the goods deficit of $6.4 billion to $86.6 billion and a decrease in the services surplus of less than $0.1 billion to $22.4 billion.
PMI Manufacturing Index – Released 5/3/2023 – The April Manufacturing PMI® registered 47.1 percent, 0.8 percentage points higher than the 46.3 percent recorded in March. Regarding the overall economy, this figure indicates a fifth month of contraction after a 30-month period of expansion. The New Orders Index remained in contraction territory at 45.7 percent, 1.4 percentage points higher than the figure of 44.3 percent recorded in March. The Production Index reading of 48.9 percent is a 1.1-percentage point increase compared to March’s figure of 47.8 percent.
PMI Non-Manufacturing Index – Released 5/5/2023 – Economic activity in the services sector expanded in April for the fourth consecutive month as the Services PMI® registered 51.9 percent, 0.7 percentage point higher than March’s reading of 51.2 percent. The composite index indicated growth in April for the fourth consecutive month after a reading of 49.2 percent in December, the first contraction since May 2020.
Chicago PMI – Released 4/28/2023 – Chicago PMI remained in contraction territory but increased in April to 48.6 points up from 43.8 points in February. This marks eight months in contractionary territory.
US Light Vehicle Sales – Released 4/28/2023 – U.S. light vehicle sales were at a seasonally adjusted annual rate (SAAR) of 14.838 million units in March.
Personal Income – Released 4/28/2023 – Personal income increased $67.9 billion (0.3 percent) in March, according to estimates by the Bureau of Economic Analysis. Disposable personal income (DPI) increased $71.7 billion (0.4 percent) and personal consumption expenditures (PCE) increased $8.2 billion (less than 0.1 percent). The PCE price index increased 0.1 percent. Excluding food and energy, the PCE price index increased 0.3 percent. Real DPI increased 0.3 percent in March and Real PCE decreased less than 0.1 percent; goods decreased 0.4 percent and services increased 0.1 percent.
Advance Estimate of 1th Quarter 2023 GDP – Released 4/27/2023 – Real gross domestic product (GDP) increased at an annual rate of 1.1 percent in the first quarter of 2023, according to the “advance” estimate released by the Bureau of Economic Analysis. In the fourth quarter, real GDP increased 2.6 percent. The increase in real GDP reflected increases in consumer spending, exports, federal government spending, state and local government spending, and nonresidential fixed investment that were partly offset by decreases in private inventory investment and residential fixed investment. Imports, which are a subtraction in the calculation of GDP, increased
Durable Goods – Released 4/26/2023 – New orders for manufactured durable goods in March were up $8.6 billion or 3.2 percent to $276.4 billion, this followed two consecutive monthly decreases, Excluding transportation, new orders increased 0.3 percent. Excluding defense, new orders increased 3.5 percent. The march increase was mostly a result of stronger transportation equipment purchases.
New Residential Sales – Released 4/25/2023 – Sales of new single‐family houses in March 2023 were at a seasonally adjusted annual rate of 683,000, according to estimates released jointly today by the U.S. Census Bureau and the Department of Housing and Urban Development. This is 9.6 percent above the revised February rate of 623,000, but is 3.4 percent below the March 2022 estimate of 707,000
Consumer Confidence – Released 4/25/2023 – The Conference Board Consumer Confidence Index® fell in April to 101.3, down from 104.0 in March. The Present Situation Index—based on consumers’ assessment of current business and labor market conditions—increased to 151.1 from 148.9 last month. The Expectations Index—based on consumers’ short-term outlook for income, business, and labor market conditions—fell to 68.1 from 74.0. The Expectations Index has now remained below 80—the level associated with a recession within the next year—every month since February 2022, with the exception of a brief uptick in December 2022. The survey was fielded from April 3—about three weeks after the bank failures in the United States—to April 19.
Existing Home Sales – Released 4/20/2023 – Existing home sales decreased in March. Sales decreased 2.4% to a seasonally adjusted rate of 4.44 million in March. Sales decreased 22.0% year-over-year. Housing inventory sits at 980k units. Up 1.0% over February. Up 5.4% over last year. Unsold inventory sits at a 2.6-month supply. The median existing home price for all housing types was $375,700, which is down 0.9% from March 2022.
Data Sources:
Bureau of Economic Analysis (BEA)
Congressional Budget Office (CBO)
U.S. Bureau of Labor Statistics (BLS)
Federal Reserve Economic Data (FRED Charts)
CME Fed Watch
U.S. Treasury – Yields
U.S. Census Bureau
Institute for Supply Management (ISM)
Weekly DOL Employment Data
BLS Monthly Jobs Report
JOLTS
US Energy Admin (EIA)
BLS Consumer Price Index CPI
BLS Producer Price Index PPI
Atlanta Fed GDPNOW
NY Fed Nowcast GDP
US Census Bureau Housing Starts
Consumer Credit
USCB Retail Sales
Construction Spending
Federal Reserve Dot Plots
NY Empire Index
Philadelphia Federal Reserve
P/E Ratio Data -Yardeni Research
Technical Analysis Info:
StockCharts.com – Financial Charts
Exponential vs Simple moving average
Other Links:
1973 Arab Oil Embargo
Hunt Brothers Silver
Long-Term Capital bailout
Categories:
Tags: