Good Life Advisors – Talking Points – Week 22
Stocks were higher this week though the market was still dealing with a number of moving pieces. Upside was driven in part by a repricing around June Fed expectations, as markets cut the odds of a June rate hike by nearly 50 bp to ~30%. However, the market pricing for the December median fed funds rate continues to hold around 5%, suggesting no rate cuts by year-end. The Senate also passed debt ceiling legislation on Thursday and will be signed by President Biden. There was also support for the soft landing narrative following a number of positive takeaways from this week’s batch of economic data. Sell-side analysts also downplayed the impact of some potential headwinds, including the resumption of student loan repayments and the TGA rebuild. There was also a pickup in FOMO scrutiny as US equities saw the first inflow in seven weeks, including the biggest inflow into tech on record.
However, a number of headwinds remain. Despite the pullback in June hike odds, markets are fully pricing in a July hike, while Reuters noted expectations for the upcoming SEP to show upside risk to the rate path. Narrow breadth and market leadership remain a risk, with Citi strategists the latest to warn that positioning risks are now biased toward profit-taking, which could create a headwind against the ongoing rally. Barclays analysts also flagged dampened positioning tailwind, noting a rebound in both discretionary and systematic fund buying. While falling commodity prices play into the disinflation theme, Bloomberg also cited analysts who said it reflects recession fears and weaker growth outlooks in China, the US, and Europe.
Data this week continued to show support for the soft landing narrative. Friday’s May headline payrolls came in hotter than expected, though Goldman Sachs said the report adds support for a June pause given the mixed household survey, softness in hours worked, and decline in average hourly earning growth. Thursday’s ISM Manufacturing missed and remained in contraction territory for a seventh-straight month. However, there was a big focus on the prices paid component, which fell back below January levels. Analysts said that ISM manufacturing has held up better than previous downturns and instead reflects a normalization of demand following the fiscal policy-induced surge. Goldman Sachs also raised their 2023 GDP forecast following the ISM report, given better construction activity and labor trends. Final Q1 unit labor costs were also cut to the lowest level since Dec-21 outside of the Q4-22 decline. There was also some focus on a SF Fed study released this week also said that wages have only explained about 0.1pp of core CPI growth (Bloomberg).
Fed June rate hike odds came down this week after some dovish takeaways from this week’s Fedspeak. Fed Governor Jefferson on Wednesday signaled support for a June pause, though said it should not be interpreted that the peak rate has been reached for the cycle, while Philadelphia’s Harker (voter) also said he thinks the Fed can skip a meeting (Bloomberg). Both Jefferson and Harker’s comments were in line with Chair Powell, who said on 19-May that the Fed faces uncertainty about the lagged effects of tightening so far and that the Fed can afford to look at the data and the evolving outlook to make careful assessments Although the odds of a 25 bp hike for June have come down, the December median fed funds rate continues to hold around 5%, signaling market expectations for no rate cuts through year-end.
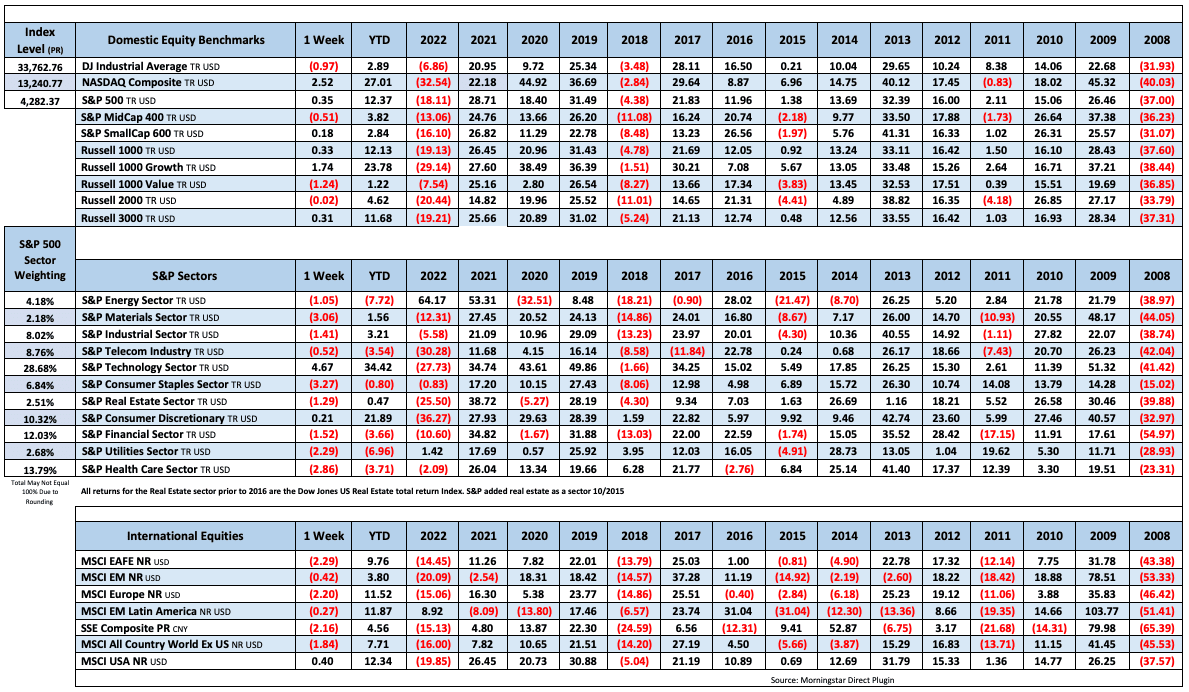
The major averages were all higher this week, with the S&P 500 posting a third-straight weekly gain and Nasdaq up for a sixth-straight week, matching the longest streak since Dec-19 into Jan-20. Sectors were all higher though fairly mixed. Outperformers included the FANMAGs (NFLX +5.7%, AMZN +3.5%), athletic apparel (LULU +7.4%), department stores, banks (BKX +3.1%), credit cards, rails, managed care, hospitals, industrial metals, and oilfield services. Semis (SOX -1.3%) were a bit lower this week after a big recent gain. Other underperformers included auto parts retailers, parcels and logistics, biotech, pharma, fertilizer, and E&Ps. Treasuries were firmer across the curve, though ended off best levels after a big Friday selloff. The dollar index was down 0.2%, breaking a three-week streak of gains. Gold was up 1.3%, the first gain in four weeks. WTI crude was down 1.3%, breaking two-straight weekly gains.

Fixed Income
Yield Curve
May FOMC Statement March Fed Minutes Balance Sheet Reduction Plan Credit, Liquidity and Balance Sheet Federal Reserve Dot Plots
Treasury.gov yields FOMC Policy Normalization Statement Longer- Run Goals Jan 2022
Foreign Exchange Market
Energy Complex
The Baker Hughes rig count was down by 15 this week. There are 696 oil and gas rigs operating in the US – down 15 over last year.
Metals Complex
Employment Picture
May Jobs Report – BLS Summary – Released 6/2/2023 – The US Economy added 339k nonfarm jobs in May and the Unemployment rate increase 0.3% to 3.7%. Average hourly earnings increased 11 cents to $33.44. Hiring highlights include +48k Leisure and Hospitality, +97k Education and Health Services, +56 Government, and +64k Professional and Business Services.
- Average hourly earnings increased 11 cents/0.3% to $33.44.
- U3 unemployment rate increased 0.3% to 3.7%. U6 unemployment rate increased 0.1% to 6.7%.
- The labor force participation rate was unchanged at 62.6%.
- Average work week declined 0.1 hours to 34.3 hours.
Weekly Unemployment Claims – Released Thursday 6/1/2023 – In the week ending May 27, the advance figure for seasonally adjusted initial claims was 232,000, an increase of 2,000 from the previous week’s revised level. The 4-week moving average was 229,500 a decrease of 2,500 from the previous week’s revised average.
Job Openings & Labor Turnover Survey JOLTS – Released 5/31/2023 – The number of job openings increased to 10.1 million on the last business day of April, the U.S. Bureau of Labor Statistics reported. Over the month the number of hires and total separations changed little at 6.1 million and 5.7 million, respectively. Within separations, quits (3.8 million) changed little and layoffs and discharges (1.6 million) changed little.
Employment Cost Index – Released 4/28/2023 – Compensation costs for civilian workers increased 1.2% for the 3-month period ending in March 2023. The 12-month period ending in March 2023 saw compensation costs increase by 4.8. The 12-month period ending March 2022 increased 4.5%. Wages and salaries increased 5.0 percent over the 12-month March 2023 and increased 4.7 percent for the 12-month period ending in March 2022. Benefit costs increased 4.5 percent over the 12-month period ending March 2023 and increased 4.1 percent for the 12-month period ending in March 2022. This report is published quarterly.
This Week’s Economic Data
Links take you to the data source
U.S. Construction Spending – Released 6/1/2023 – Construction spending during April 2023 was estimated at a seasonally adjusted annual rate of $1,908.4 billion, 1.2 percent above the revised March estimate of $1,885.0 billion. The April figure is 7.2 percent above the April 2022 estimate of $1,780.9 billion.
PMI Manufacturing Index – Released 6/1/2023 – The May Manufacturing PMI registered 46.9 percent, 0.2 percentage points lower than the 47.1 percent recorded in April. Regarding the overall economy, this figure indicates a sixth month of contraction after a 30-month period of expansion. The New Orders Index remained in contraction territory at 42.6 percent, 3.1 percentage points lower than the figure of 45.7 percent recorded in April. The Production Index reading of 51.1 percent is a 2.2-percentage point increase compared to April’s figure of 48.9 percent.
Chicago PMI – Released 5/31/2023 – Chicago PMI remained in contraction territory in May crashing to 40.4 points down from 48.6 points in April. This marks nine months in contractionary territory.
Recent Economic Data
Links take you to the data source
US Light Vehicle Sales – Released 5/26/2023 – U.S. light vehicle sales were at a seasonally adjusted annual rate (SAAR) of 15.915 million units in April.
Personal Income – Released 5/26/2023 – Personal income increased $80.1 billion (0.4 percent at a monthly rate) in April. Disposable personal income (DPI) increased $79.4 billion (0.4 percent). Personal outlays increased $156.0 billion (0.8 percent) and consumer spending increased $151.7 billion (0.8 percent). Personal saving was $802.1 billion and the personal saving rate—personal saving as a percentage of disposable personal income—was 4.1 percent in April.
Durable Goods – Released 5/26/2023 – New orders for manufactured durable goods in April, up two consecutive months, increased $3.1 billion or 1.1 percent to $283.0 billion, the U.S. Census Bureau announced today. This followed a 3.3 percent March increase. Excluding transportation, new orders decreased 0.2 percent. Excluding defense, new orders decreased 0.6 percent. Transportation equipment, also up two consecutive months, drove the increase, $3.5 billion or 3.7 percent to $97.6 billion. Shipments of manufactured durable goods in April, down two of the last three months, decreased $2.0 billion or 0.7 percent to $277.7 billion. This followed a 0.7 percent March increase.
2nd Estimate of 1st Quarter 2023 GDP – Released 5/25/2023 – Real gross domestic product (GDP) increased at an annual rate of 1.3 percent in the first quarter of 2023, according to the “second” estimate released by the Bureau of Economic Analysis. In the fourth quarter, real GDP increased 2.6 percent.
New Residential Sales – Released 5/23/2023 – Sales of new single‐family houses in April 2023 were at a seasonally adjusted annual rate of 683,000, according to estimates released jointly by the U.S. Census Bureau and the Department of Housing and Urban Development.
This is 4.1 percent above the revised March rate of 656,000 and is 11.8 percent above the April 2022 estimate of 611,000. The median sales price of new houses sold in April 2023 was $420,800. The average sales price was $501,000.
Existing Home Sales – Released 5/18/2023 – April 2023 brought 4.28 million in sales, a median sales price of $388,800, and 2.9 months of inventory.
Housing Starts – Released 5/17/2023 – April housing starts came in at a 1401K SAAR, nearly in line with 1400K consensus. Highest monthly pace since June 2022. Better than March’s 1371K, which saw a big downward revision from the original 1420K print. Starts up 2.2% m/m though down 22.3% y/y. Data noted upshift in both single-family and multifamily construction. Biggest increases in West, while all other regions saw decline in single-family starts
Industrial Production and Capacity Utilization – Released 5/16/2023 – Industrial production increased 0.5% in April (0.0% including revisions to prior months) versus a consensus expected 0.0%. Utilities output fell 3.1% in April, Overall capacity utilization rose to 79.7% in April from 79.4% in March.
Manufacturing capacity utilization increased to 78.3% in April from 77.6% while mining rose 0.6%.
Retail Sales – Released 5/16/2023 – Headline retail sales up 0.4% m/m, missing consensus for 0.8% growth, though March revised up to -0.7% from initial 1.0% decline. Retail sales ex-autos of 0.4% below 0.5% consensus, while March also revised up 0.4pp to a 0.5% decline. Retail sales ex-autos and fuel of 0.6% beat 0.3% consensus, reversing last month’s 0.5% decline.
Producer Price Index – Released 5/11/2023 – The Producer Price Index for final demand advanced 0.2 percent in April, seasonally adjusted; final demand prices fell 0.4 percent in March and were unchanged in February. On an unadjusted basis, the index for final demand moved up 2.3 percent for the 12 months ended in April.
Consumer Price Index – Released 5/10/2023 – The Consumer Price Index for All Urban Consumers rose 0.4 percent in April on a seasonally adjusted basis after increasing 0.1 percent in March. Over the last 12 months, the all-items index increased 4.9 percent before seasonal adjustment. This was the smallest 12-month increase since the period ending April 2021. The index for all items less food and energy rose 0.4 percent in April, as it did in March. Indexes that increased in April include shelter, used cars and trucks, motor vehicle insurance, recreation, household furnishings and operations, and personal care.
Consumer Credit – Released 5/5/2023 – Consumer credit increased at a seasonally adjusted annual rate of 5.4 percent during the first quarter. Revolving credit increased at an annual rate of 12.3 percent, while nonrevolving credit increased at an annual rate of 3.1 percent. In March, consumer credit increased 6.6 percent.
PMI Non-Manufacturing Index – Released 5/5/2023 – Economic activity in the services sector expanded in April for the fourth consecutive month as the Services PMI® registered 51.9 percent, 0.7 percentage points higher than March’s reading of 51.2 percent. The composite index indicated growth in April for the fourth consecutive month after a reading of 49.2 percent in December, the first contraction since May 2020.
U.S. Trade Balance – Released 5/4/2023 – The U.S. Census Bureau and the U.S. Bureau of Economic Analysis announced that the goods and services deficit was $64.2 billion in March, down $6.4 billion from $70.6 billion in February, revised. March exports were $256.2 billion, $5.3 billion more than February exports. March imports were $320.4 billion, $1.1 billion less than February imports. The March decrease in the goods and services deficit reflected a decrease in the goods deficit of $6.4 billion to $86.6 billion and a decrease in the services surplus of less than $0.1 billion to $22.4 billion.
Next week we get data on the U.S. Trade Balance, Services PMI, and Consumer Credit.
Data Sources:
Bureau of Economic Analysis (BEA)
Congressional Budget Office (CBO)
U.S. Bureau of Labor Statistics (BLS)
Federal Reserve Economic Data (FRED Charts)
CME Fed Watch
U.S. Treasury – Yields
U.S. Census Bureau
Institute for Supply Management (ISM)
Weekly DOL Employment Data
BLS Monthly Jobs Report
JOLTS
US Energy Admin (EIA)
BLS Consumer Price Index CPI
BLS Producer Price Index PPI
Atlanta Fed GDPNOW
NY Fed Nowcast GDP
US Census Bureau Housing Starts
Consumer Credit
USCB Retail Sales
Construction Spending
Federal Reserve Dot Plots
NY Empire Index
Philadelphia Federal Reserve
P/E Ratio Data -Yardeni Research
Technical Analysis Info:
StockCharts.com – Financial Charts
Exponential vs Simple moving average
Koyfin.com
Other Links:
1973 Arab Oil Embargo
Hunt Brothers Silver
Long-Term Capital bailout
Asian Contagion


Week 22 Talking Points
Table of Contents
Good Life Advisors – Talking Points – Week 22
Stocks were higher this week though the market was still dealing with a number of moving pieces. Upside was driven in part by a repricing around June Fed expectations, as markets cut the odds of a June rate hike by nearly 50 bp to ~30%. However, the market pricing for the December median fed funds rate continues to hold around 5%, suggesting no rate cuts by year-end. The Senate also passed debt ceiling legislation on Thursday and will be signed by President Biden. There was also support for the soft landing narrative following a number of positive takeaways from this week’s batch of economic data. Sell-side analysts also downplayed the impact of some potential headwinds, including the resumption of student loan repayments and the TGA rebuild. There was also a pickup in FOMO scrutiny as US equities saw the first inflow in seven weeks, including the biggest inflow into tech on record.
However, a number of headwinds remain. Despite the pullback in June hike odds, markets are fully pricing in a July hike, while Reuters noted expectations for the upcoming SEP to show upside risk to the rate path. Narrow breadth and market leadership remain a risk, with Citi strategists the latest to warn that positioning risks are now biased toward profit-taking, which could create a headwind against the ongoing rally. Barclays analysts also flagged dampened positioning tailwind, noting a rebound in both discretionary and systematic fund buying. While falling commodity prices play into the disinflation theme, Bloomberg also cited analysts who said it reflects recession fears and weaker growth outlooks in China, the US, and Europe.
Data this week continued to show support for the soft landing narrative. Friday’s May headline payrolls came in hotter than expected, though Goldman Sachs said the report adds support for a June pause given the mixed household survey, softness in hours worked, and decline in average hourly earning growth. Thursday’s ISM Manufacturing missed and remained in contraction territory for a seventh-straight month. However, there was a big focus on the prices paid component, which fell back below January levels. Analysts said that ISM manufacturing has held up better than previous downturns and instead reflects a normalization of demand following the fiscal policy-induced surge. Goldman Sachs also raised their 2023 GDP forecast following the ISM report, given better construction activity and labor trends. Final Q1 unit labor costs were also cut to the lowest level since Dec-21 outside of the Q4-22 decline. There was also some focus on a SF Fed study released this week also said that wages have only explained about 0.1pp of core CPI growth (Bloomberg).
Fed June rate hike odds came down this week after some dovish takeaways from this week’s Fedspeak. Fed Governor Jefferson on Wednesday signaled support for a June pause, though said it should not be interpreted that the peak rate has been reached for the cycle, while Philadelphia’s Harker (voter) also said he thinks the Fed can skip a meeting (Bloomberg). Both Jefferson and Harker’s comments were in line with Chair Powell, who said on 19-May that the Fed faces uncertainty about the lagged effects of tightening so far and that the Fed can afford to look at the data and the evolving outlook to make careful assessments Although the odds of a 25 bp hike for June have come down, the December median fed funds rate continues to hold around 5%, signaling market expectations for no rate cuts through year-end.
The major averages were all higher this week, with the S&P 500 posting a third-straight weekly gain and Nasdaq up for a sixth-straight week, matching the longest streak since Dec-19 into Jan-20. Sectors were all higher though fairly mixed. Outperformers included the FANMAGs (NFLX +5.7%, AMZN +3.5%), athletic apparel (LULU +7.4%), department stores, banks (BKX +3.1%), credit cards, rails, managed care, hospitals, industrial metals, and oilfield services. Semis (SOX -1.3%) were a bit lower this week after a big recent gain. Other underperformers included auto parts retailers, parcels and logistics, biotech, pharma, fertilizer, and E&Ps. Treasuries were firmer across the curve, though ended off best levels after a big Friday selloff. The dollar index was down 0.2%, breaking a three-week streak of gains. Gold was up 1.3%, the first gain in four weeks. WTI crude was down 1.3%, breaking two-straight weekly gains.
Fixed Income
Yield Curve
May FOMC Statement March Fed Minutes Balance Sheet Reduction Plan Credit, Liquidity and Balance Sheet Federal Reserve Dot Plots
Treasury.gov yields FOMC Policy Normalization Statement Longer- Run Goals Jan 2022
Foreign Exchange Market
Energy Complex
The Baker Hughes rig count was down by 15 this week. There are 696 oil and gas rigs operating in the US – down 15 over last year.
Metals Complex
Employment Picture
May Jobs Report – BLS Summary – Released 6/2/2023 – The US Economy added 339k nonfarm jobs in May and the Unemployment rate increase 0.3% to 3.7%. Average hourly earnings increased 11 cents to $33.44. Hiring highlights include +48k Leisure and Hospitality, +97k Education and Health Services, +56 Government, and +64k Professional and Business Services.
Weekly Unemployment Claims – Released Thursday 6/1/2023 – In the week ending May 27, the advance figure for seasonally adjusted initial claims was 232,000, an increase of 2,000 from the previous week’s revised level. The 4-week moving average was 229,500 a decrease of 2,500 from the previous week’s revised average.
Job Openings & Labor Turnover Survey JOLTS – Released 5/31/2023 – The number of job openings increased to 10.1 million on the last business day of April, the U.S. Bureau of Labor Statistics reported. Over the month the number of hires and total separations changed little at 6.1 million and 5.7 million, respectively. Within separations, quits (3.8 million) changed little and layoffs and discharges (1.6 million) changed little.
Employment Cost Index – Released 4/28/2023 – Compensation costs for civilian workers increased 1.2% for the 3-month period ending in March 2023. The 12-month period ending in March 2023 saw compensation costs increase by 4.8. The 12-month period ending March 2022 increased 4.5%. Wages and salaries increased 5.0 percent over the 12-month March 2023 and increased 4.7 percent for the 12-month period ending in March 2022. Benefit costs increased 4.5 percent over the 12-month period ending March 2023 and increased 4.1 percent for the 12-month period ending in March 2022. This report is published quarterly.
This Week’s Economic Data
Links take you to the data source
U.S. Construction Spending – Released 6/1/2023 – Construction spending during April 2023 was estimated at a seasonally adjusted annual rate of $1,908.4 billion, 1.2 percent above the revised March estimate of $1,885.0 billion. The April figure is 7.2 percent above the April 2022 estimate of $1,780.9 billion.
PMI Manufacturing Index – Released 6/1/2023 – The May Manufacturing PMI registered 46.9 percent, 0.2 percentage points lower than the 47.1 percent recorded in April. Regarding the overall economy, this figure indicates a sixth month of contraction after a 30-month period of expansion. The New Orders Index remained in contraction territory at 42.6 percent, 3.1 percentage points lower than the figure of 45.7 percent recorded in April. The Production Index reading of 51.1 percent is a 2.2-percentage point increase compared to April’s figure of 48.9 percent.
Chicago PMI – Released 5/31/2023 – Chicago PMI remained in contraction territory in May crashing to 40.4 points down from 48.6 points in April. This marks nine months in contractionary territory.
Recent Economic Data
Links take you to the data source
US Light Vehicle Sales – Released 5/26/2023 – U.S. light vehicle sales were at a seasonally adjusted annual rate (SAAR) of 15.915 million units in April.
Personal Income – Released 5/26/2023 – Personal income increased $80.1 billion (0.4 percent at a monthly rate) in April. Disposable personal income (DPI) increased $79.4 billion (0.4 percent). Personal outlays increased $156.0 billion (0.8 percent) and consumer spending increased $151.7 billion (0.8 percent). Personal saving was $802.1 billion and the personal saving rate—personal saving as a percentage of disposable personal income—was 4.1 percent in April.
Durable Goods – Released 5/26/2023 – New orders for manufactured durable goods in April, up two consecutive months, increased $3.1 billion or 1.1 percent to $283.0 billion, the U.S. Census Bureau announced today. This followed a 3.3 percent March increase. Excluding transportation, new orders decreased 0.2 percent. Excluding defense, new orders decreased 0.6 percent. Transportation equipment, also up two consecutive months, drove the increase, $3.5 billion or 3.7 percent to $97.6 billion. Shipments of manufactured durable goods in April, down two of the last three months, decreased $2.0 billion or 0.7 percent to $277.7 billion. This followed a 0.7 percent March increase.
2nd Estimate of 1st Quarter 2023 GDP – Released 5/25/2023 – Real gross domestic product (GDP) increased at an annual rate of 1.3 percent in the first quarter of 2023, according to the “second” estimate released by the Bureau of Economic Analysis. In the fourth quarter, real GDP increased 2.6 percent.
New Residential Sales – Released 5/23/2023 – Sales of new single‐family houses in April 2023 were at a seasonally adjusted annual rate of 683,000, according to estimates released jointly by the U.S. Census Bureau and the Department of Housing and Urban Development.
This is 4.1 percent above the revised March rate of 656,000 and is 11.8 percent above the April 2022 estimate of 611,000. The median sales price of new houses sold in April 2023 was $420,800. The average sales price was $501,000.
Existing Home Sales – Released 5/18/2023 – April 2023 brought 4.28 million in sales, a median sales price of $388,800, and 2.9 months of inventory.
Housing Starts – Released 5/17/2023 – April housing starts came in at a 1401K SAAR, nearly in line with 1400K consensus. Highest monthly pace since June 2022. Better than March’s 1371K, which saw a big downward revision from the original 1420K print. Starts up 2.2% m/m though down 22.3% y/y. Data noted upshift in both single-family and multifamily construction. Biggest increases in West, while all other regions saw decline in single-family starts
Industrial Production and Capacity Utilization – Released 5/16/2023 – Industrial production increased 0.5% in April (0.0% including revisions to prior months) versus a consensus expected 0.0%. Utilities output fell 3.1% in April, Overall capacity utilization rose to 79.7% in April from 79.4% in March.
Manufacturing capacity utilization increased to 78.3% in April from 77.6% while mining rose 0.6%.
Retail Sales – Released 5/16/2023 – Headline retail sales up 0.4% m/m, missing consensus for 0.8% growth, though March revised up to -0.7% from initial 1.0% decline. Retail sales ex-autos of 0.4% below 0.5% consensus, while March also revised up 0.4pp to a 0.5% decline. Retail sales ex-autos and fuel of 0.6% beat 0.3% consensus, reversing last month’s 0.5% decline.
Producer Price Index – Released 5/11/2023 – The Producer Price Index for final demand advanced 0.2 percent in April, seasonally adjusted; final demand prices fell 0.4 percent in March and were unchanged in February. On an unadjusted basis, the index for final demand moved up 2.3 percent for the 12 months ended in April.
Consumer Price Index – Released 5/10/2023 – The Consumer Price Index for All Urban Consumers rose 0.4 percent in April on a seasonally adjusted basis after increasing 0.1 percent in March. Over the last 12 months, the all-items index increased 4.9 percent before seasonal adjustment. This was the smallest 12-month increase since the period ending April 2021. The index for all items less food and energy rose 0.4 percent in April, as it did in March. Indexes that increased in April include shelter, used cars and trucks, motor vehicle insurance, recreation, household furnishings and operations, and personal care.
Consumer Credit – Released 5/5/2023 – Consumer credit increased at a seasonally adjusted annual rate of 5.4 percent during the first quarter. Revolving credit increased at an annual rate of 12.3 percent, while nonrevolving credit increased at an annual rate of 3.1 percent. In March, consumer credit increased 6.6 percent.
PMI Non-Manufacturing Index – Released 5/5/2023 – Economic activity in the services sector expanded in April for the fourth consecutive month as the Services PMI® registered 51.9 percent, 0.7 percentage points higher than March’s reading of 51.2 percent. The composite index indicated growth in April for the fourth consecutive month after a reading of 49.2 percent in December, the first contraction since May 2020.
U.S. Trade Balance – Released 5/4/2023 – The U.S. Census Bureau and the U.S. Bureau of Economic Analysis announced that the goods and services deficit was $64.2 billion in March, down $6.4 billion from $70.6 billion in February, revised. March exports were $256.2 billion, $5.3 billion more than February exports. March imports were $320.4 billion, $1.1 billion less than February imports. The March decrease in the goods and services deficit reflected a decrease in the goods deficit of $6.4 billion to $86.6 billion and a decrease in the services surplus of less than $0.1 billion to $22.4 billion.
Next week we get data on the U.S. Trade Balance, Services PMI, and Consumer Credit.
Data Sources:
Bureau of Economic Analysis (BEA)
Congressional Budget Office (CBO)
U.S. Bureau of Labor Statistics (BLS)
Federal Reserve Economic Data (FRED Charts)
CME Fed Watch
U.S. Treasury – Yields
U.S. Census Bureau
Institute for Supply Management (ISM)
Weekly DOL Employment Data
BLS Monthly Jobs Report
JOLTS
US Energy Admin (EIA)
BLS Consumer Price Index CPI
BLS Producer Price Index PPI
Atlanta Fed GDPNOW
NY Fed Nowcast GDP
US Census Bureau Housing Starts
Consumer Credit
USCB Retail Sales
Construction Spending
Federal Reserve Dot Plots
NY Empire Index
Philadelphia Federal Reserve
P/E Ratio Data -Yardeni Research
Technical Analysis Info:
StockCharts.com – Financial Charts
Exponential vs Simple moving average
Koyfin.com
Other Links:
1973 Arab Oil Embargo
Hunt Brothers Silver
Long-Term Capital bailout
Asian Contagion
Categories:
Tags: