Good Life Advisors – Talking Points – Week 20
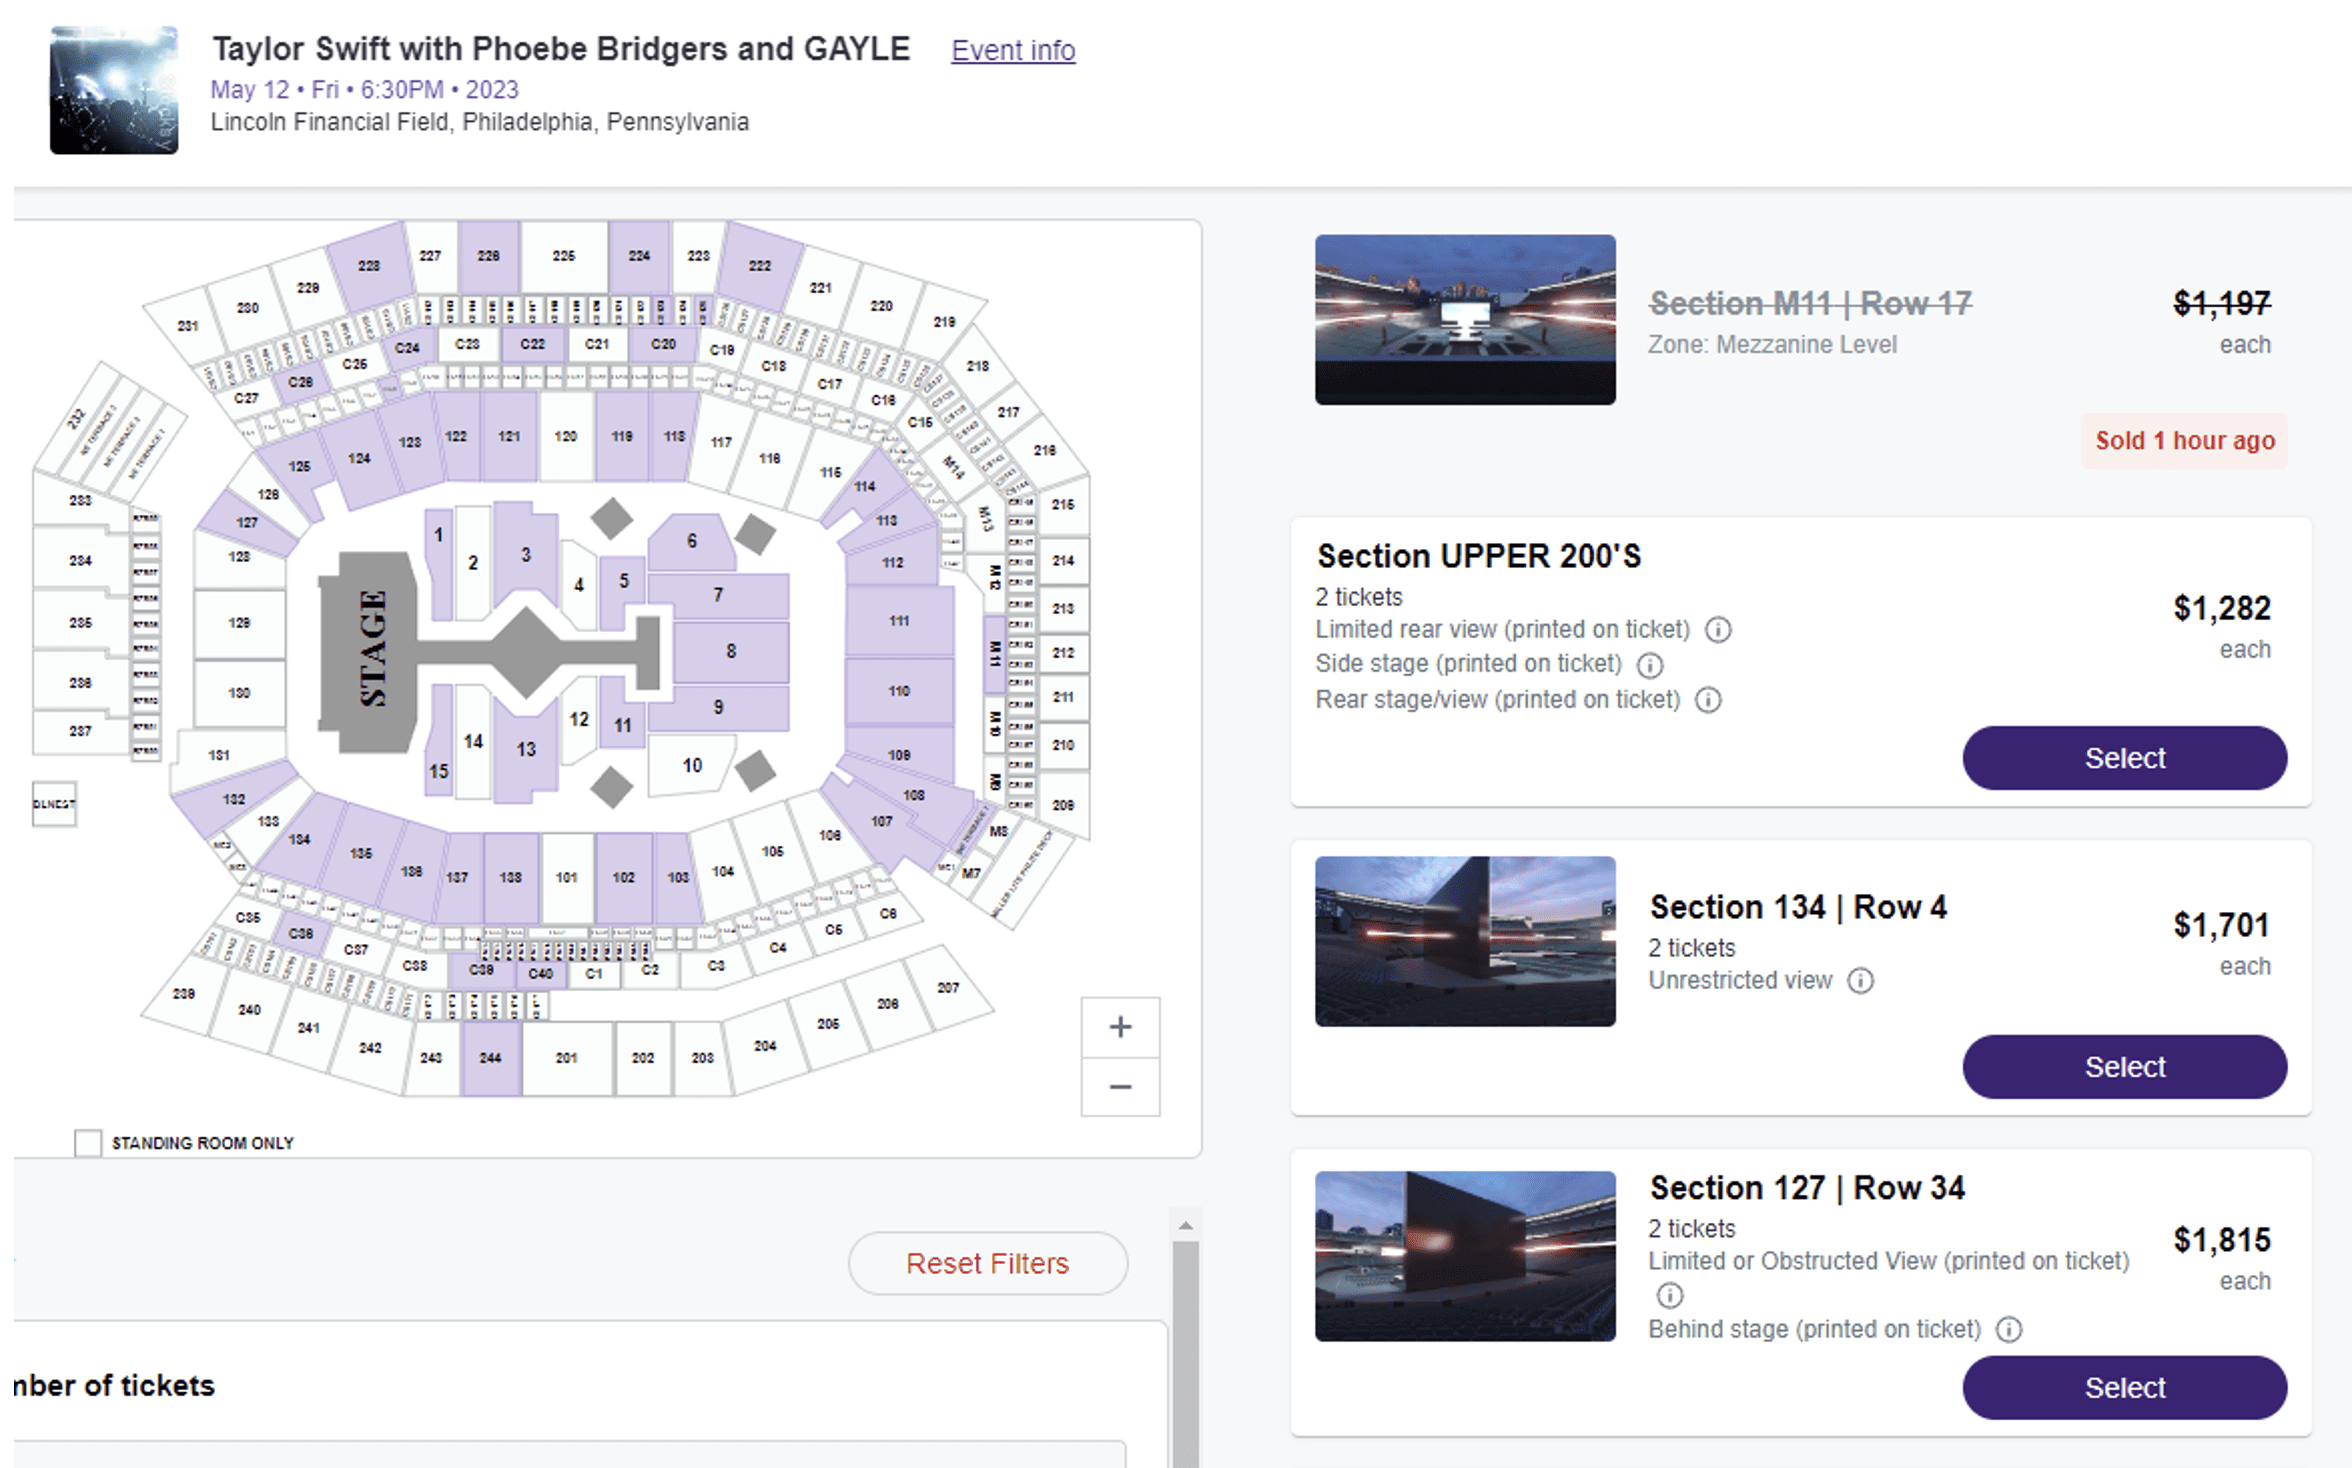
Taylor Swift was in Philly this weekend; congrats to anyone who got tickets in the lottery. If you bought tickets through a reseller, this is what you were faced with: the cheapest seats available were over $1200 a seat. The most expensive were over $12k a seat. Recessionary?
While there were numerous headlines for the week, there was little in the way of incremental developments and nothing to jolt the market out of the fairly narrow range it has occupied since late March. The week’s economic data reflected a continued easing of inflationary pressures, though there were also some worries about how weaker data fed into recession fears. The ongoing federal debt-ceiling crisis consumed a lot of bandwidth this week without any concrete signs of progress; however, discussions are ongoing and there remain thoughts a deal will ultimately be found. The banking crisis came back into view this week amid some mixed deposit updates and a big weekly outflow from financials. At the same time, the much-anticipated Senior Loan Officer Opinion Survey (SLOOS) from the Fed did not show signs of stress beyond what had been expected. There was also a lot of commentary on the extremely narrow market leadership offered by big tech (with some recent rallies driven by more AI hype).

Despite the somewhat downbeat tone in the market this week, there was also a bull case to be made. There were mixed takeaways from the economic data but the overall picture is still largely consistent with the Fed pausing in June. Small-business optimism dropped, but the latest report revealed no signs of new credit strains. And the Q1 earnings season has come in better than expected, with the number of reporters beating EPS estimates running above long-term averages and the magnitude of those beats topping the 10-year average.
It was a meaningful week of economic data focused on April CPI, which was largely in line with consensus on both the headline and core readings. While used-car prices jumped (as forecast), there was attention on the slowdown of core services prices ex shelter. Headline April PPI came in softer than consensus, with core PPI hitting consensus and posting the lowest y/y increase since March 2021. Overall, analysts felt the data supported market expectations for the Fed to pause at its June FOMC meeting, though the committee will also have another round of CPI data (as well as the May jobs report) before it makes its decision. Elsewhere on the economic calendar, May UMich consumer sentiment tumbled in its preliminary read, though respondents’ long-term inflation expectations hit a 12-year high. The other big report this week was initial jobless claims, which hit their highest level in 19 months and fed into bubbling fears of a possible recession ahead.
There continued to be a lot of focus on negotiations about raising the federal debt ceiling, with a very limited legislative period during which a fix could be enacted before the possibility of default in early June. A White House meeting with congressional leadership on Tuesday yielded no concrete progress, though the parties agreed to continue talks. A similar meeting scheduled for Friday was postponed into next week, though there were some thoughts that this could actually be a sign that the behind-the-scenes staff talks were making progress. Despite the harder public positions, there is a sense there may be room for a deal involving topics such as energy permitting reform and recovering unspent Covid relief funding. At the same time, the CBO on Friday said that if the government can make its payments until 15-Jun, quarterly tax receipts might then push the “X-date” out to late July.
US equities were mostly lower this week, though strength in Big Tech generated a gain for the Nasdaq and provided a notable cushion for the S&P (the equal-weight version of that index was down 1.1% for the week). Treasuries ended weaker with a bit of curve flattening after an up-and-down week. The dollar had a strong week on the major crosses; DXY +1.5%. Gold was marginally weaker, dropping 0.2% for the week but holding above $2,000/oz. Oil was weaker, with WTI crude settling down 1.8%, the fourth consecutive weekly decline for the grade as concerns mount about possibly softer demand to come should global economic growth slow.
Fixed Income
Yield Curve
May FOMC Statement March Fed Minutes Balance Sheet Reduction Plan Credit, Liquidity and Balance Sheet Federal Reserve Dot Plots
Treasury.gov yields FOMC Policy Normalization Statement Longer- Run Goals Jan 2022
Foreign Exchange Market
Energy Complex
The Baker Hughes rig count was down by 17 this week. There are 731 oil and gas rigs operating in the US – Up 17 over last year.
Metals Complex
Gold holding above $2,000/ounce.
Employment Picture
Weekly Unemployment Claims – Released Thursday 5/11/2023 – In the week ending May 6, initial claims were 264,000, an increase of 22,000 from the previous week’s unrevised level of 242,000. This is the highest level for initial claims since October 30, 2021 when it was 264,000. The 4-week moving average was 245,250, an increase of 6,000 from the previous week’s unrevised average of 239,250. This is the highest level for this average since November 20, 2021 when it was 249,250.
April Jobs Report – BLS Summary – Released 5/5/2023 – The US Economy added 253k nonfarm jobs in April and the Unemployment rate was little changed at 3.5%. Average hourly earnings increased 9 cents to $33.18. Hiring highlights include +32k Leisure and Hospitality, +77k Education and Health Services, +23 Government, and +43k Professional and Business Services.
- Average hourly earnings increased 16 cents/0.5% to $33.18.
- U3 unemployment rate was little changed at 3.5%. U6 unemployment rate decreased 0.1% to 6.7%.
- The labor force participation rate was little changed at 62.6%.
- Average work week was unchanged by at 34.4 hours.
Job Openings & Labor Turnover Survey JOLTS – Released 5/4/2023 – The number of job openings decreased to 9.9 million on the last business day of February, the U.S. Bureau of Labor Statistics reported. Over the month, the number of hires and total separations changed little at 6.2 million and 5.8 million, respectively. Within separations, quits (4.0 million) increased and layoffs and discharges (1.5 million) decreased.
Employment Cost Index – Released 1/31/2023 – Compensation costs for civilian workers increased 1.0% for the 3-month period ending in December 2022. The 12-month period ending on December 2022 saw compensation costs increase by 5.1%. The 12-month period ending December 2021 increased 4.0%. Wages and salaries increased 5.1 percent over the year and increased 4.5 percent for the 12-month period ending in December 2021. Benefit costs increased 4.9 percent over the year and increased 2.8 percent for the 12-month period ending in December 2021. This report is published quarterly.
This Week’s Economic Data
Links take you to the data source
Consumer Price Index – Released 5/10/2023 – The Consumer Price Index for All Urban Consumers rose 0.4 percent in April on a seasonally adjusted basis, after increasing 0.1 percent in March. Over the last 12 months, the all-items index increased 4.9 percent before seasonal adjustment. This was the smallest 12-month increase since the period ending April 2021. The index for all items less food and energy rose 0.4 percent in April, as it did in March. Indexes which increased in April include shelter, used cars and trucks, motor vehicle insurance, recreation, household furnishings and operations, and personal care.
Producer Price Index – Released 5/11/2023 – The Producer Price Index for final demand advanced 0.2 percent in April, seasonally adjusted, Final demand prices fell 0.4 percent in March and were unchanged in February. On an unadjusted basis, the index for final demand moved up 2.3 percent for the 12 months ended in April.
Recent Economic Data
Links take you to the data source
Consumer Credit – Released 4/5/2023 – Consumer credit increased at a seasonally adjusted annual rate of 5.4 percent during the first quarter. Revolving credit increased at an annual rate of 12.3 percent, while nonrevolving credit increased at an annual rate of 3.1 percent. In March, consumer credit increased 6.6 percent.
U.S. Construction Spending – Released 5/1/2023 – Construction spending during March 2023 was estimated at a seasonally adjusted annual rate of $1,844.7 billion, 0.3 percent above the revised February estimate of $1,829.6 billion. The March figure is 3.8 percent above the March 2022 estimate of $1,768.2 billion
U.S. Trade Balance – Released 5/4/2023 – The U.S. Census Bureau and the U.S. Bureau of Economic Analysis announced that the goods and services deficit was $64.2 billion in March, down $6.4 billion from $70.6 billion in February, revised. March exports were $256.2 billion, $5.3 billion more than February exports. March imports were $320.4 billion, $1.1 billion less than February imports. The March decrease in the goods and services deficit reflected a decrease in the goods deficit of $6.4 billion to $86.6 billion and a decrease in the services surplus of less than $0.1 billion to $22.4 billion.
PMI Manufacturing Index – Released 5/3/2023 – The April Manufacturing PMI® registered 47.1 percent, 0.8 percentage points higher than the 46.3 percent recorded in March. Regarding the overall economy, this figure indicates a fifth month of contraction after a 30-month period of expansion. The New Orders Index remained in contraction territory at 45.7 percent, 1.4 percentage points higher than the figure of 44.3 percent recorded in March. The Production Index reading of 48.9 percent is a 1.1-percentage point increase compared to March’s figure of 47.8 percent.
PMI Non-Manufacturing Index – Released 5/5/2023 – Economic activity in the services sector expanded in April for the fourth consecutive month as the Services PMI® registered 51.9 percent, 0.7 percentage point higher than March’s reading of 51.2 percent. The composite index indicated growth in April for the fourth consecutive month after a reading of 49.2 percent in December, the first contraction since May 2020.
Chicago PMI – Released 4/28/2023 – Chicago PMI remained in contraction territory but increased in April to 48.6 points up from 43.8 points in February. This marks eight months in contractionary territory.
US Light Vehicle Sales – Released 4/28/2023 – U.S. light vehicle sales were at a seasonally adjusted annual rate (SAAR) of 14.838 million units in March.
Personal Income – Released 4/28/2023 – Personal income increased $67.9 billion (0.3 percent) in March, according to estimates by the Bureau of Economic Analysis. Disposable personal income (DPI) increased $71.7 billion (0.4 percent), and personal consumption expenditures (PCE) increased $8.2 billion (less than 0.1 percent). The PCE price index increased 0.1 percent. Excluding food and energy, the PCE price index increased 0.3 percent. Real DPI increased 0.3 percent in March and Real PCE decreased less than 0.1 percent; goods decreased 0.4 percent and services increased 0.1 percent.
Advance Estimate of 1th Quarter 2023 GDP – Released 4/27/2023 – Real gross domestic product (GDP) increased at an annual rate of 1.1 percent in the first quarter of 2023, according to the “advance” estimate released by the Bureau of Economic Analysis. In the fourth quarter, real GDP increased 2.6 percent. The increase in real GDP reflected increases in consumer spending, exports, federal government spending, state and local government spending, and nonresidential fixed investment that were partly offset by decreases in private inventory investment and residential fixed investment. Imports, which are a subtraction in the calculation of GDP, increased
Durable Goods – Released 4/26/2023 – New orders for manufactured durable goods in March were up $8.6 billion or 3.2 percent to $276.4 billion; this followed two consecutive monthly decreases; excluding transportation, new orders increased 0.3 percent. Excluding defense, new orders increased 3.5 percent. The march increase was mostly a result of stronger transportation equipment purchases.
New Residential Sales – Released 4/25/2023 – Sales of new single‐family houses in March 2023 were at a seasonally adjusted annual rate of 683,000, according to estimates released jointly today by the U.S. Census Bureau and the Department of Housing and Urban Development. This is 9.6 percent above the revised February rate of 623,000 but is 3.4 percent below the March 2022 estimate of 707,000
Consumer Confidence – Released 4/25/2023 – The Conference Board Consumer Confidence Index® fell in April to 101.3, down from 104.0 in March. The Present Situation Index—based on consumers’ assessment of current business and labor market conditions—increased to 151.1 from 148.9 last month. The Expectations Index—based on consumers’ short-term outlook for income, business, and labor market conditions—fell to 68.1 from 74.0. The Expectations Index has now remained below 80—the level associated with a recession within the next year—every month since February 2022, with the exception of a brief uptick in December 2022. The survey was fielded from April 3—about three weeks after the bank failures in the United States—to April 19.
Existing Home Sales – Released 4/20/2023 – Existing home sales decreased in March. Sales decreased 2.4% to a seasonally adjusted rate of 4.44 million in March. Sales decreased 22.0% year-over-year. Housing inventory sits at 980k units. Up 1.0% over February. Up 5.4% over last year. Unsold inventory sits at a 2.6-month supply. The median existing home price for all housing types was $375,700 which is down 0.9% from March 2022.
Housing Starts – Released 4/18/2023 – New home starts in March were at a seasonally adjusted annual rate of 1.420 million; down 0.8% below February, and 17.2% below last March’s rate. Building Permits were at a seasonally adjusted annual rate of 1.413 million, down 8.8% compared to February, and down 24.8% over last year.
Industrial Production and Capacity Utilization – Released 4/14/2023 – In March, Industrial production increased 0.4%. Manufacturing decreased 0.5%. Utilities output increased 8.4%. Mining output declined 0.5%. Total industrial production was 0.5% higher in March than a year ago. Total capacity utilization increased in March to 79.8% which is 0.1% above its long-run average.
Retail Sales – Released 4/14/2023 – U.S. retail sales for March decreased 1.0% to $691.7 billion but retail sales are 2.9% above March 2022. U.S. retail sales for the January 2022 through March 2023 period were up 5.4% from the same period a year ago.
Data Sources:
Bureau of Economic Analysis (BEA)
Congressional Budget Office (CBO)
U.S. Bureau of Labor Statistics (BLS)
Federal Reserve Economic Data (FRED Charts)
CME Fed Watch
U.S. Treasury – Yields
U.S. Census Bureau
Institute for Supply Management (ISM)
Weekly DOL Employment Data
BLS Monthly Jobs Report
JOLTS
US Energy Admin (EIA)
BLS Consumer Price Index CPI
BLS Producer Price Index PPI
Atlanta Fed GDPNOW
NY Fed Nowcast GDP
US Census Bureau Housing Starts
Consumer Credit
USCB Retail Sales
Construction Spending
Federal Reserve Dot Plots
NY Empire Index
Philadelphia Federal Reserve
P/E Ratio Data -Yardeni Research
Technical Analysis Info:
StockCharts.com – Financial Charts
Exponential vs Simple moving average
Other Links:
1973 Arab Oil Embargo
Hunt Brothers Silver
Long-Term Capital bailout


Week 20 Talking Points
Table of Contents
Good Life Advisors – Talking Points – Week 20
Taylor Swift was in Philly this weekend; congrats to anyone who got tickets in the lottery. If you bought tickets through a reseller, this is what you were faced with: the cheapest seats available were over $1200 a seat. The most expensive were over $12k a seat. Recessionary?
While there were numerous headlines for the week, there was little in the way of incremental developments and nothing to jolt the market out of the fairly narrow range it has occupied since late March. The week’s economic data reflected a continued easing of inflationary pressures, though there were also some worries about how weaker data fed into recession fears. The ongoing federal debt-ceiling crisis consumed a lot of bandwidth this week without any concrete signs of progress; however, discussions are ongoing and there remain thoughts a deal will ultimately be found. The banking crisis came back into view this week amid some mixed deposit updates and a big weekly outflow from financials. At the same time, the much-anticipated Senior Loan Officer Opinion Survey (SLOOS) from the Fed did not show signs of stress beyond what had been expected. There was also a lot of commentary on the extremely narrow market leadership offered by big tech (with some recent rallies driven by more AI hype).
Despite the somewhat downbeat tone in the market this week, there was also a bull case to be made. There were mixed takeaways from the economic data but the overall picture is still largely consistent with the Fed pausing in June. Small-business optimism dropped, but the latest report revealed no signs of new credit strains. And the Q1 earnings season has come in better than expected, with the number of reporters beating EPS estimates running above long-term averages and the magnitude of those beats topping the 10-year average.
It was a meaningful week of economic data focused on April CPI, which was largely in line with consensus on both the headline and core readings. While used-car prices jumped (as forecast), there was attention on the slowdown of core services prices ex shelter. Headline April PPI came in softer than consensus, with core PPI hitting consensus and posting the lowest y/y increase since March 2021. Overall, analysts felt the data supported market expectations for the Fed to pause at its June FOMC meeting, though the committee will also have another round of CPI data (as well as the May jobs report) before it makes its decision. Elsewhere on the economic calendar, May UMich consumer sentiment tumbled in its preliminary read, though respondents’ long-term inflation expectations hit a 12-year high. The other big report this week was initial jobless claims, which hit their highest level in 19 months and fed into bubbling fears of a possible recession ahead.
There continued to be a lot of focus on negotiations about raising the federal debt ceiling, with a very limited legislative period during which a fix could be enacted before the possibility of default in early June. A White House meeting with congressional leadership on Tuesday yielded no concrete progress, though the parties agreed to continue talks. A similar meeting scheduled for Friday was postponed into next week, though there were some thoughts that this could actually be a sign that the behind-the-scenes staff talks were making progress. Despite the harder public positions, there is a sense there may be room for a deal involving topics such as energy permitting reform and recovering unspent Covid relief funding. At the same time, the CBO on Friday said that if the government can make its payments until 15-Jun, quarterly tax receipts might then push the “X-date” out to late July.
US equities were mostly lower this week, though strength in Big Tech generated a gain for the Nasdaq and provided a notable cushion for the S&P (the equal-weight version of that index was down 1.1% for the week). Treasuries ended weaker with a bit of curve flattening after an up-and-down week. The dollar had a strong week on the major crosses; DXY +1.5%. Gold was marginally weaker, dropping 0.2% for the week but holding above $2,000/oz. Oil was weaker, with WTI crude settling down 1.8%, the fourth consecutive weekly decline for the grade as concerns mount about possibly softer demand to come should global economic growth slow.
Fixed Income
Yield Curve
May FOMC Statement March Fed Minutes Balance Sheet Reduction Plan Credit, Liquidity and Balance Sheet Federal Reserve Dot Plots
Treasury.gov yields FOMC Policy Normalization Statement Longer- Run Goals Jan 2022
Foreign Exchange Market
Energy Complex
The Baker Hughes rig count was down by 17 this week. There are 731 oil and gas rigs operating in the US – Up 17 over last year.
Metals Complex
Gold holding above $2,000/ounce.
Employment Picture
Weekly Unemployment Claims – Released Thursday 5/11/2023 – In the week ending May 6, initial claims were 264,000, an increase of 22,000 from the previous week’s unrevised level of 242,000. This is the highest level for initial claims since October 30, 2021 when it was 264,000. The 4-week moving average was 245,250, an increase of 6,000 from the previous week’s unrevised average of 239,250. This is the highest level for this average since November 20, 2021 when it was 249,250.
April Jobs Report – BLS Summary – Released 5/5/2023 – The US Economy added 253k nonfarm jobs in April and the Unemployment rate was little changed at 3.5%. Average hourly earnings increased 9 cents to $33.18. Hiring highlights include +32k Leisure and Hospitality, +77k Education and Health Services, +23 Government, and +43k Professional and Business Services.
Job Openings & Labor Turnover Survey JOLTS – Released 5/4/2023 – The number of job openings decreased to 9.9 million on the last business day of February, the U.S. Bureau of Labor Statistics reported. Over the month, the number of hires and total separations changed little at 6.2 million and 5.8 million, respectively. Within separations, quits (4.0 million) increased and layoffs and discharges (1.5 million) decreased.
Employment Cost Index – Released 1/31/2023 – Compensation costs for civilian workers increased 1.0% for the 3-month period ending in December 2022. The 12-month period ending on December 2022 saw compensation costs increase by 5.1%. The 12-month period ending December 2021 increased 4.0%. Wages and salaries increased 5.1 percent over the year and increased 4.5 percent for the 12-month period ending in December 2021. Benefit costs increased 4.9 percent over the year and increased 2.8 percent for the 12-month period ending in December 2021. This report is published quarterly.
This Week’s Economic Data
Links take you to the data source
Consumer Price Index – Released 5/10/2023 – The Consumer Price Index for All Urban Consumers rose 0.4 percent in April on a seasonally adjusted basis, after increasing 0.1 percent in March. Over the last 12 months, the all-items index increased 4.9 percent before seasonal adjustment. This was the smallest 12-month increase since the period ending April 2021. The index for all items less food and energy rose 0.4 percent in April, as it did in March. Indexes which increased in April include shelter, used cars and trucks, motor vehicle insurance, recreation, household furnishings and operations, and personal care.
Producer Price Index – Released 5/11/2023 – The Producer Price Index for final demand advanced 0.2 percent in April, seasonally adjusted, Final demand prices fell 0.4 percent in March and were unchanged in February. On an unadjusted basis, the index for final demand moved up 2.3 percent for the 12 months ended in April.
Recent Economic Data
Links take you to the data source
Consumer Credit – Released 4/5/2023 – Consumer credit increased at a seasonally adjusted annual rate of 5.4 percent during the first quarter. Revolving credit increased at an annual rate of 12.3 percent, while nonrevolving credit increased at an annual rate of 3.1 percent. In March, consumer credit increased 6.6 percent.
U.S. Construction Spending – Released 5/1/2023 – Construction spending during March 2023 was estimated at a seasonally adjusted annual rate of $1,844.7 billion, 0.3 percent above the revised February estimate of $1,829.6 billion. The March figure is 3.8 percent above the March 2022 estimate of $1,768.2 billion
U.S. Trade Balance – Released 5/4/2023 – The U.S. Census Bureau and the U.S. Bureau of Economic Analysis announced that the goods and services deficit was $64.2 billion in March, down $6.4 billion from $70.6 billion in February, revised. March exports were $256.2 billion, $5.3 billion more than February exports. March imports were $320.4 billion, $1.1 billion less than February imports. The March decrease in the goods and services deficit reflected a decrease in the goods deficit of $6.4 billion to $86.6 billion and a decrease in the services surplus of less than $0.1 billion to $22.4 billion.
PMI Manufacturing Index – Released 5/3/2023 – The April Manufacturing PMI® registered 47.1 percent, 0.8 percentage points higher than the 46.3 percent recorded in March. Regarding the overall economy, this figure indicates a fifth month of contraction after a 30-month period of expansion. The New Orders Index remained in contraction territory at 45.7 percent, 1.4 percentage points higher than the figure of 44.3 percent recorded in March. The Production Index reading of 48.9 percent is a 1.1-percentage point increase compared to March’s figure of 47.8 percent.
PMI Non-Manufacturing Index – Released 5/5/2023 – Economic activity in the services sector expanded in April for the fourth consecutive month as the Services PMI® registered 51.9 percent, 0.7 percentage point higher than March’s reading of 51.2 percent. The composite index indicated growth in April for the fourth consecutive month after a reading of 49.2 percent in December, the first contraction since May 2020.
Chicago PMI – Released 4/28/2023 – Chicago PMI remained in contraction territory but increased in April to 48.6 points up from 43.8 points in February. This marks eight months in contractionary territory.
US Light Vehicle Sales – Released 4/28/2023 – U.S. light vehicle sales were at a seasonally adjusted annual rate (SAAR) of 14.838 million units in March.
Personal Income – Released 4/28/2023 – Personal income increased $67.9 billion (0.3 percent) in March, according to estimates by the Bureau of Economic Analysis. Disposable personal income (DPI) increased $71.7 billion (0.4 percent), and personal consumption expenditures (PCE) increased $8.2 billion (less than 0.1 percent). The PCE price index increased 0.1 percent. Excluding food and energy, the PCE price index increased 0.3 percent. Real DPI increased 0.3 percent in March and Real PCE decreased less than 0.1 percent; goods decreased 0.4 percent and services increased 0.1 percent.
Advance Estimate of 1th Quarter 2023 GDP – Released 4/27/2023 – Real gross domestic product (GDP) increased at an annual rate of 1.1 percent in the first quarter of 2023, according to the “advance” estimate released by the Bureau of Economic Analysis. In the fourth quarter, real GDP increased 2.6 percent. The increase in real GDP reflected increases in consumer spending, exports, federal government spending, state and local government spending, and nonresidential fixed investment that were partly offset by decreases in private inventory investment and residential fixed investment. Imports, which are a subtraction in the calculation of GDP, increased
Durable Goods – Released 4/26/2023 – New orders for manufactured durable goods in March were up $8.6 billion or 3.2 percent to $276.4 billion; this followed two consecutive monthly decreases; excluding transportation, new orders increased 0.3 percent. Excluding defense, new orders increased 3.5 percent. The march increase was mostly a result of stronger transportation equipment purchases.
New Residential Sales – Released 4/25/2023 – Sales of new single‐family houses in March 2023 were at a seasonally adjusted annual rate of 683,000, according to estimates released jointly today by the U.S. Census Bureau and the Department of Housing and Urban Development. This is 9.6 percent above the revised February rate of 623,000 but is 3.4 percent below the March 2022 estimate of 707,000
Consumer Confidence – Released 4/25/2023 – The Conference Board Consumer Confidence Index® fell in April to 101.3, down from 104.0 in March. The Present Situation Index—based on consumers’ assessment of current business and labor market conditions—increased to 151.1 from 148.9 last month. The Expectations Index—based on consumers’ short-term outlook for income, business, and labor market conditions—fell to 68.1 from 74.0. The Expectations Index has now remained below 80—the level associated with a recession within the next year—every month since February 2022, with the exception of a brief uptick in December 2022. The survey was fielded from April 3—about three weeks after the bank failures in the United States—to April 19.
Existing Home Sales – Released 4/20/2023 – Existing home sales decreased in March. Sales decreased 2.4% to a seasonally adjusted rate of 4.44 million in March. Sales decreased 22.0% year-over-year. Housing inventory sits at 980k units. Up 1.0% over February. Up 5.4% over last year. Unsold inventory sits at a 2.6-month supply. The median existing home price for all housing types was $375,700 which is down 0.9% from March 2022.
Housing Starts – Released 4/18/2023 – New home starts in March were at a seasonally adjusted annual rate of 1.420 million; down 0.8% below February, and 17.2% below last March’s rate. Building Permits were at a seasonally adjusted annual rate of 1.413 million, down 8.8% compared to February, and down 24.8% over last year.
Industrial Production and Capacity Utilization – Released 4/14/2023 – In March, Industrial production increased 0.4%. Manufacturing decreased 0.5%. Utilities output increased 8.4%. Mining output declined 0.5%. Total industrial production was 0.5% higher in March than a year ago. Total capacity utilization increased in March to 79.8% which is 0.1% above its long-run average.
Retail Sales – Released 4/14/2023 – U.S. retail sales for March decreased 1.0% to $691.7 billion but retail sales are 2.9% above March 2022. U.S. retail sales for the January 2022 through March 2023 period were up 5.4% from the same period a year ago.
Data Sources:
Bureau of Economic Analysis (BEA)
Congressional Budget Office (CBO)
U.S. Bureau of Labor Statistics (BLS)
Federal Reserve Economic Data (FRED Charts)
CME Fed Watch
U.S. Treasury – Yields
U.S. Census Bureau
Institute for Supply Management (ISM)
Weekly DOL Employment Data
BLS Monthly Jobs Report
JOLTS
US Energy Admin (EIA)
BLS Consumer Price Index CPI
BLS Producer Price Index PPI
Atlanta Fed GDPNOW
NY Fed Nowcast GDP
US Census Bureau Housing Starts
Consumer Credit
USCB Retail Sales
Construction Spending
Federal Reserve Dot Plots
NY Empire Index
Philadelphia Federal Reserve
P/E Ratio Data -Yardeni Research
Technical Analysis Info:
StockCharts.com – Financial Charts
Exponential vs Simple moving average
Other Links:
1973 Arab Oil Embargo
Hunt Brothers Silver
Long-Term Capital bailout
Categories:
Tags: