Good Life Advisors – Talking Points – Week 2
Inflation Continues to Ease
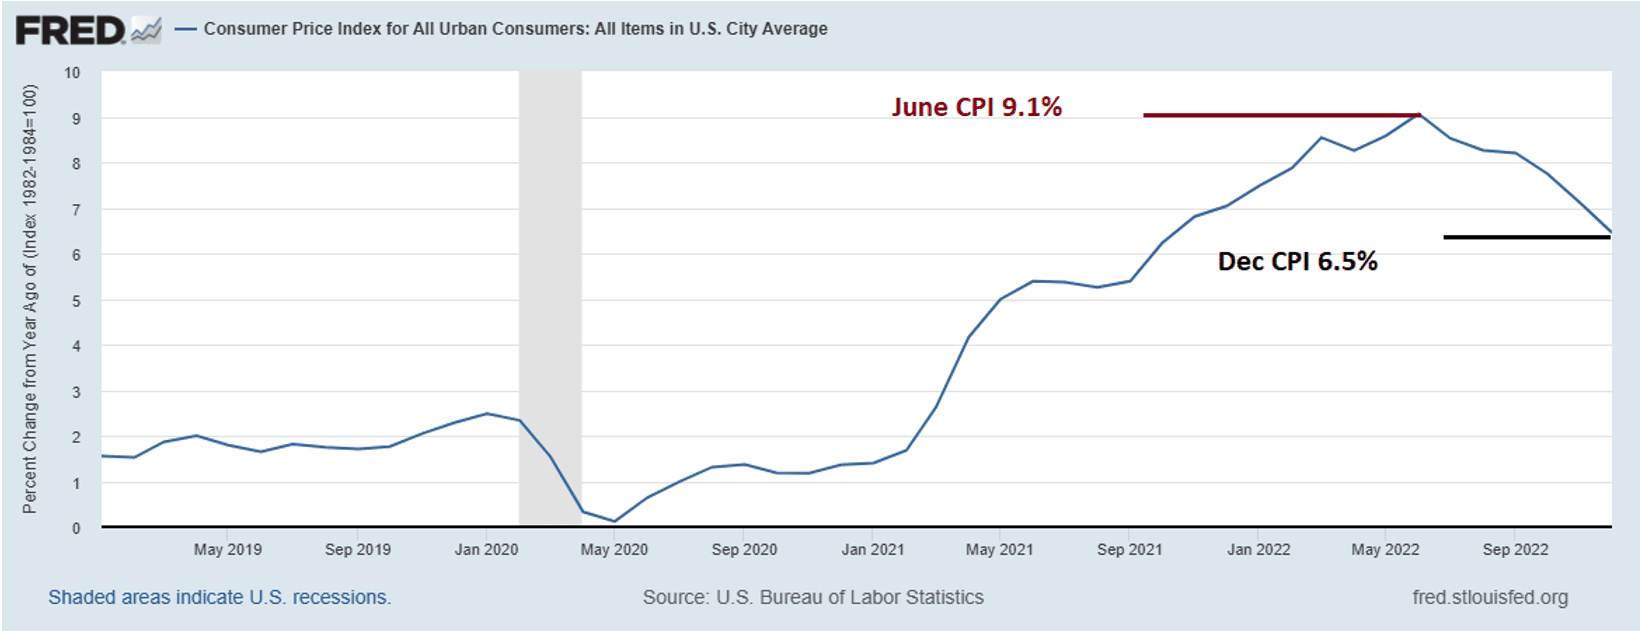
CPI came out Thursday and it showed that inflation continued to ease. Consumer prices fell a seasonally adjusted 0.1% from November to December. The report showed a sixth-straight monthly decline, while the annual increase of 6.5% was the lowest in 14 months. 6.5% is still much higher than any point over the last 40 years BUT… We are witnessing a meaningful deceleration since the peak in June. The question now is simply: how long before we return to “normal” and does the Fed take a break sooner than expected?
The major averages were all higher for a second-straight week, with the S&P 500 ending the week just below the 4,000 level and Nasdaq above 11,000. the highest close for both indexes in a month. Growth outperformed value for the first time in seven weeks. Support around the soft landing narrative this week’s key tailwind: This week’s December CPI helped out buyers to work. Michigan Consumer Sentiment was up 4.9 points m/m to 64.6, beating estimates for 60.3, for highest print in nine months. However, an equally large focus was on the report’s one-year inflation expectations, which fell 0.4pp to 4%, the lowest since Jun-21 after a fourth-straight monthly decline. Combined with other metrics like last week’s December payrolls data, the latest economic numbers continue to offer more hopes around a soft landing, which has been a key tailwind for risk sentiment. Other positive narratives included a lower bar headed into earnings season, with Q4 bottom-up estimate down 6.5% vs the five-year average decline of 2.5%.
This weeks batch of Fedspeak saw officials signal support for a 25 bp hike in February, including 2023 voter Philadelphia’s Harker. Chair Powell also didn’t push back against easing financial conditions at his appearance this week, adding to the improving sentiment. However, takeaways from the week still leaned hawkish as officials didn’t hint at anything more than a pause when it hits a benchmark rate above 5%. CME’s FedWatch tool now shows a ~90% chance of 25 bp February hike, up from ~80% prior to Thursday’s CPI. However, markets continue to price in two rate cuts by year-end 2023, while Fed officials still haven’t softened the “raise-and-hold” messaging, a dynamic which reflects the risks around the divergence between investors and the Fed on the rate path for this year. Keep in mind that the Federal debt limit will be reached this Thursday. There is the potential for significant market volatility if congress doesn’t come to an agreement on raising or eliminating the cap.

Fixed Income
Yield Curve
December FOMC Statement December Fed Minutes Balance Sheet Reduction Plan Credit, Liquidity and Balance Sheet Federal Reserve Dot Plots
Treasury.gov yields FOMC Policy Normalization Statement Longer- Run Goals Jan 2022
Energy Complex
The Baker Hughes rig count gained 3 this week. There are 775 oil and gas rigs operating in the US – Up 174 over last year.
Metals Complex
Employment Picture
Weekly Unemployment Claims – Released Thursday 1/12/2023 – The week ending January 7th observed a decrease of 1k in initial claims decreased to 205k. The four-week moving average of initial jobless claims was down 1.75k to 212,500.
December Jobs Report – BLS Summary – Released 1/6/2023 – The US Economy added 223k nonfarm jobs in December and the Unemployment rate was declined to 3.5%. Average hourly earnings increased 9 cents to $32.82. Hiring highlights include +78k Education and Health Services, +67k Leisure and Hospitality, and +28 Construction.
- Average hourly earnings increased 9 cents/ 0.3% to $32.82.
- U3 unemployment rate declined 0.2% to 3.5%. U6 unemployment rate decreased 0.2% to 6.5%.
- The labor force participation rate was little changed at 62.3%.
- Average work week was declined 0.1 to 34.3 hours.
Job Openings & Labor Turnover Survey – JOLTS – Released 1/4/2023 – The number of job openings was little changed at 10.5 million on the last business day of November, the US Bureau of Labor Statistics reported. Over the month, the number of hires and total separation changed little at 6.1 million, respectively. Within separations, quits (4.2 million) and layoffs and discharges (1.4 million) changed little.
Employment Cost Index – Released 10/28/2022 – Compensation costs for civilian workers increased 1.2% for the 3-month period ending in September 2022. The 12-month period ending in September 2022 saw compensation costs increase by 5%. The 12-month period ending September 2021 increased 3.7%. Wages and salaries increased 5.1% over the year and increased 4.2% for the 12-month period ending in September 2021. Benefit costs increased 4.9% over the year and increased 2.5% for the 12-month period ending in September 2021. This report is published quarterly.
This Week’s Economic Data
Links take you to the data source
Consumer Price Index – Released 1/12/2023 – Consumer prices decreased 0.1% m/m in December following a 0.1% increase in November. Consumer prices are up 6.5% for the 12-month period ending in December. Core consumer prices increased 0.3% m/m in December.
Consumer Credit – Released 1/9/2023 – In November, consumer credit increased at a seasonally adjusted annual rate of 7.1%. Revolving credit increased at an annual rate of 16.9%, while nonrevolving credit increased at an annual rate of 3.9%.
Recent Economic Date
Links take you to the data source
U.S. Trade Balance – Released 1/5/2023 – The US monthly international trade deficit decreased in NOvember 2022 according to the US Bureau of Economic Analysis and the US Census Bureau. The deficit decreased from $77.8 billion in OCtober (revised) to $61.5 billion in November. November exports were $251.9 billion, $5.1 billion less than October exports. November imports were $313.4 billion, $21.5 billion less than October imports. Year-to-date, the goods and services deficit increased $120.1 billion, or 15.7%, from the same period in 2021. Exports increased $439.4 billion or 18.9%. Imports increased $559.5 billion or 18.1%.
PMI Non-Manufacturing Index – Released 1/5/2023 – Economic activity entered contraction territory in December ending 30 months of expansion – with the Services PMI registering 49.6% – In December, the Services PMI registered 49.6%, 6.9 percentage points lower than November’s reading of 56.5%.
PMI Manufacturing Index – Released 1/3/2023 – The December Manufacturing PMI registered 48.4%, 0.6 percentage points lower than the 49% recorded in November. Regarding the overall economy, this figure indicates contraction following 30 months of expansion. The Manufacturing PMI figure is the lowest since May 2020, when it registered 43.5%. The New Orders Index remained in contraction territory at 45.2%, 2 percentage points lower than the 47.2% recorded in November.
U.S. Construction Spending – Released 1/3/2023 – Construction spending during November 2022 was estimated at a seasonally adjusted annual rate of $1,807.5 billion, 0.2% above the revised October estimate of $1,803.2 billion. The November figure is 8.5% above the November 2021 estimate of $1,665.2 billion. During the first eleven months of this year, construction spending amounted to $1,657.6 billion, 10.5% above the $1,499.8 billion for the same period in 2021.
Chicago PMI – Released 12/30/2022 – Chicago PMI remained in contraction territory but increased in December by 7.7 points to 44.9.
US Light Vehicle Sales – Released 12/23/2022 – US light vehicle sales were at a seasonally adjusted annual rate (SAAR) of 14.134 million units in November.
Personal Income – Released 12/23/2022 – Personal income increased $80.1 billion, or 0.4% in November. Disposable Personal Income increased $68.6 billion or 0.4%. Personal Consumption Expenditure increased $19.8 billion or 0.1%.
Durable Goods – Released 12/23/2022 – New orders for manufactured durable goods in November decreased $5.8 billion or 2.1% to $270.6 billion. Transportation equipment increased up $0.7 billion or 0.8% to $91.8 billion.
New Residential Sales – Released 12/23/2022 – Sales of new single-family homes increased 5.8% to 640k, seasonally adjusted, in November. The median sales price of new homes sold in November was $471,200 with an average sales price of $543,600. At the end of November, the seasonally adjusted estimate of new homes for sale was 461k. This represents a supply of 8.6 months at the current sales rate.
Third Estimate of 3rd Quarter 2022 GDP – Released 12/22/2022 – Real Gross Domestic Product (GDP) increased at an annual rate of 3.2% in the third quarter of 2022 according to the third estimate released by the Bureau of Economic Analysis, in contrast to a decrease of 0.6% in the second quarter. The “third” estimate of GDP released today is based on more complete source data than were available for the “second” estimate issued last month. In the second estimate, the increase in real GDP was 2.9%. The updated estimates primarily reflected upward revisions to consumer spending and nonresidential fixed investment that were partly offset by a downward revision to private inventory investment. The increase in the third quarter primarily reflected increases in exports and consumer spending that were partly offset by a decrease in housing investment.
Consumer Confidence – Released 12/21/2022 – The Conference Board Consumer Confidence Index increased in December. The Idex now stands at 108.3 (1985+100), up from 101.4 in November.
Existing Home Sales – Released 12/21/2022 – Existing home sales decreased in November marking ten consecutive months of declines. Sales declined 7.7% to a seasonally adjusted rate of 4.09 million in November. Sales decreased 35.4% year-over-year. Housing inventory sits at 1.14 million units. Down 6.6% from October’s inventory, up 2.7% over last year. Unsold inventory sits at a 3.3-month supply. The median existing home price for all housing types was $370,700 which is up 3.5% from November 2021. This marks 129 consecutive months of year-over-year increases, the longest-running streak on record.
Housing Starts – Released 12/20/2022 – New home starts in November were at a seasonally adjusted annual rate of 1.427 million; down 0.5% below October, and 16.4% below last November’s rate. Building Permits were at a seasonally adjusted annual rate of 1.342 million, down 11.2% compared to October, and down 22.4% over last year.
Industrial Production and Capacity Utilization – Released 12/15/2022 – In November, Industrial production decreased 0.2%. Manufacturing decreased 0.6%. Utilities output increased 3.6%. Mining output decreased 0.7%. Total industrial production was 2.5% higher in November than a year ago. Total capacity utilization decreased 0.2% in November to 79.7% which is 0.1% above its long run average.
Retail Sales – Released 12/15/2022 – US retail sales for November decreased 0.6% to $689.4 billion and retail sales are 6.5% above November 2021. US retail sales for the September 2022 through November 2022 period were up 7.7% from the same period a year ago.
Producer Price Index – Released 12/09/2022 – The PPI for final demand advanced 0.3% in November, seasonally adjusted, the US Bureau of Labor Statistics reported. Final demand prices also rose 0.3% in both October and September. On an unadjusted basis, the index for final demand moved up 7.4% for the 12 months ended in November. In November, most of the increase in the index for final demand less foods, energy, and trade services moved up 0.3% in November after rising 0.2% in October. For the 12 months ending in November, the index for final demand less foods, energy, and trade services increased 4.9%.
Next week we get data on PPI, Retail Sales, Industrial Production and Capacity Utilization, Housing Starts, and Existing Home Sales.
Data Sources:
Bureau of Economic Analysis (BEA)
Congressional Budget Office (CBO)
U.S. Bureau of Labor Statistics (BLS)
Federal Reserve Economic Data (FRED Charts)
CME Fed Watch
U.S. Treasury – Yields
U.S. Census Bureau
Institute for Supply Management (ISM)
Weekly DOL Employment Data
BLS Monthly Jobs Report
JOLTS
US Energy Admin (EIA)
BLS Consumer Price Index CPI
BLS Producer Price Index PPI
Atlanta Fed GDPNOW
NY Fed Nowcast GDP
US Census Bureau Housing Starts
Consumer Credit
USCB Retail Sales
Construction Spending
Federal Reserve Dot Plots
NY Empire Index
Philadelphia Federal Reserve
P/E Ratio Data -Yardeni Research
Technical Analysis Info:
StockCharts.com – Financial Charts
Exponential vs Simple moving average
Other Links:
1973 Arab Oil Embargo
Hunt Brothers Silver
Long-Term Capital bailout


Week 2 Talking Points
Table of Contents
Good Life Advisors – Talking Points – Week 2
Inflation Continues to Ease
CPI came out Thursday and it showed that inflation continued to ease. Consumer prices fell a seasonally adjusted 0.1% from November to December. The report showed a sixth-straight monthly decline, while the annual increase of 6.5% was the lowest in 14 months. 6.5% is still much higher than any point over the last 40 years BUT… We are witnessing a meaningful deceleration since the peak in June. The question now is simply: how long before we return to “normal” and does the Fed take a break sooner than expected?
The major averages were all higher for a second-straight week, with the S&P 500 ending the week just below the 4,000 level and Nasdaq above 11,000. the highest close for both indexes in a month. Growth outperformed value for the first time in seven weeks. Support around the soft landing narrative this week’s key tailwind: This week’s December CPI helped out buyers to work. Michigan Consumer Sentiment was up 4.9 points m/m to 64.6, beating estimates for 60.3, for highest print in nine months. However, an equally large focus was on the report’s one-year inflation expectations, which fell 0.4pp to 4%, the lowest since Jun-21 after a fourth-straight monthly decline. Combined with other metrics like last week’s December payrolls data, the latest economic numbers continue to offer more hopes around a soft landing, which has been a key tailwind for risk sentiment. Other positive narratives included a lower bar headed into earnings season, with Q4 bottom-up estimate down 6.5% vs the five-year average decline of 2.5%.
This weeks batch of Fedspeak saw officials signal support for a 25 bp hike in February, including 2023 voter Philadelphia’s Harker. Chair Powell also didn’t push back against easing financial conditions at his appearance this week, adding to the improving sentiment. However, takeaways from the week still leaned hawkish as officials didn’t hint at anything more than a pause when it hits a benchmark rate above 5%. CME’s FedWatch tool now shows a ~90% chance of 25 bp February hike, up from ~80% prior to Thursday’s CPI. However, markets continue to price in two rate cuts by year-end 2023, while Fed officials still haven’t softened the “raise-and-hold” messaging, a dynamic which reflects the risks around the divergence between investors and the Fed on the rate path for this year. Keep in mind that the Federal debt limit will be reached this Thursday. There is the potential for significant market volatility if congress doesn’t come to an agreement on raising or eliminating the cap.
Fixed Income
Yield Curve
December FOMC Statement December Fed Minutes Balance Sheet Reduction Plan Credit, Liquidity and Balance Sheet Federal Reserve Dot Plots
Treasury.gov yields FOMC Policy Normalization Statement Longer- Run Goals Jan 2022
Energy Complex
The Baker Hughes rig count gained 3 this week. There are 775 oil and gas rigs operating in the US – Up 174 over last year.
Metals Complex
Employment Picture
Weekly Unemployment Claims – Released Thursday 1/12/2023 – The week ending January 7th observed a decrease of 1k in initial claims decreased to 205k. The four-week moving average of initial jobless claims was down 1.75k to 212,500.
December Jobs Report – BLS Summary – Released 1/6/2023 – The US Economy added 223k nonfarm jobs in December and the Unemployment rate was declined to 3.5%. Average hourly earnings increased 9 cents to $32.82. Hiring highlights include +78k Education and Health Services, +67k Leisure and Hospitality, and +28 Construction.
Job Openings & Labor Turnover Survey – JOLTS – Released 1/4/2023 – The number of job openings was little changed at 10.5 million on the last business day of November, the US Bureau of Labor Statistics reported. Over the month, the number of hires and total separation changed little at 6.1 million, respectively. Within separations, quits (4.2 million) and layoffs and discharges (1.4 million) changed little.
Employment Cost Index – Released 10/28/2022 – Compensation costs for civilian workers increased 1.2% for the 3-month period ending in September 2022. The 12-month period ending in September 2022 saw compensation costs increase by 5%. The 12-month period ending September 2021 increased 3.7%. Wages and salaries increased 5.1% over the year and increased 4.2% for the 12-month period ending in September 2021. Benefit costs increased 4.9% over the year and increased 2.5% for the 12-month period ending in September 2021. This report is published quarterly.
This Week’s Economic Data
Links take you to the data source
Consumer Price Index – Released 1/12/2023 – Consumer prices decreased 0.1% m/m in December following a 0.1% increase in November. Consumer prices are up 6.5% for the 12-month period ending in December. Core consumer prices increased 0.3% m/m in December.
Consumer Credit – Released 1/9/2023 – In November, consumer credit increased at a seasonally adjusted annual rate of 7.1%. Revolving credit increased at an annual rate of 16.9%, while nonrevolving credit increased at an annual rate of 3.9%.
Recent Economic Date
Links take you to the data source
U.S. Trade Balance – Released 1/5/2023 – The US monthly international trade deficit decreased in NOvember 2022 according to the US Bureau of Economic Analysis and the US Census Bureau. The deficit decreased from $77.8 billion in OCtober (revised) to $61.5 billion in November. November exports were $251.9 billion, $5.1 billion less than October exports. November imports were $313.4 billion, $21.5 billion less than October imports. Year-to-date, the goods and services deficit increased $120.1 billion, or 15.7%, from the same period in 2021. Exports increased $439.4 billion or 18.9%. Imports increased $559.5 billion or 18.1%.
PMI Non-Manufacturing Index – Released 1/5/2023 – Economic activity entered contraction territory in December ending 30 months of expansion – with the Services PMI registering 49.6% – In December, the Services PMI registered 49.6%, 6.9 percentage points lower than November’s reading of 56.5%.
PMI Manufacturing Index – Released 1/3/2023 – The December Manufacturing PMI registered 48.4%, 0.6 percentage points lower than the 49% recorded in November. Regarding the overall economy, this figure indicates contraction following 30 months of expansion. The Manufacturing PMI figure is the lowest since May 2020, when it registered 43.5%. The New Orders Index remained in contraction territory at 45.2%, 2 percentage points lower than the 47.2% recorded in November.
U.S. Construction Spending – Released 1/3/2023 – Construction spending during November 2022 was estimated at a seasonally adjusted annual rate of $1,807.5 billion, 0.2% above the revised October estimate of $1,803.2 billion. The November figure is 8.5% above the November 2021 estimate of $1,665.2 billion. During the first eleven months of this year, construction spending amounted to $1,657.6 billion, 10.5% above the $1,499.8 billion for the same period in 2021.
Chicago PMI – Released 12/30/2022 – Chicago PMI remained in contraction territory but increased in December by 7.7 points to 44.9.
US Light Vehicle Sales – Released 12/23/2022 – US light vehicle sales were at a seasonally adjusted annual rate (SAAR) of 14.134 million units in November.
Personal Income – Released 12/23/2022 – Personal income increased $80.1 billion, or 0.4% in November. Disposable Personal Income increased $68.6 billion or 0.4%. Personal Consumption Expenditure increased $19.8 billion or 0.1%.
Durable Goods – Released 12/23/2022 – New orders for manufactured durable goods in November decreased $5.8 billion or 2.1% to $270.6 billion. Transportation equipment increased up $0.7 billion or 0.8% to $91.8 billion.
New Residential Sales – Released 12/23/2022 – Sales of new single-family homes increased 5.8% to 640k, seasonally adjusted, in November. The median sales price of new homes sold in November was $471,200 with an average sales price of $543,600. At the end of November, the seasonally adjusted estimate of new homes for sale was 461k. This represents a supply of 8.6 months at the current sales rate.
Third Estimate of 3rd Quarter 2022 GDP – Released 12/22/2022 – Real Gross Domestic Product (GDP) increased at an annual rate of 3.2% in the third quarter of 2022 according to the third estimate released by the Bureau of Economic Analysis, in contrast to a decrease of 0.6% in the second quarter. The “third” estimate of GDP released today is based on more complete source data than were available for the “second” estimate issued last month. In the second estimate, the increase in real GDP was 2.9%. The updated estimates primarily reflected upward revisions to consumer spending and nonresidential fixed investment that were partly offset by a downward revision to private inventory investment. The increase in the third quarter primarily reflected increases in exports and consumer spending that were partly offset by a decrease in housing investment.
Consumer Confidence – Released 12/21/2022 – The Conference Board Consumer Confidence Index increased in December. The Idex now stands at 108.3 (1985+100), up from 101.4 in November.
Existing Home Sales – Released 12/21/2022 – Existing home sales decreased in November marking ten consecutive months of declines. Sales declined 7.7% to a seasonally adjusted rate of 4.09 million in November. Sales decreased 35.4% year-over-year. Housing inventory sits at 1.14 million units. Down 6.6% from October’s inventory, up 2.7% over last year. Unsold inventory sits at a 3.3-month supply. The median existing home price for all housing types was $370,700 which is up 3.5% from November 2021. This marks 129 consecutive months of year-over-year increases, the longest-running streak on record.
Housing Starts – Released 12/20/2022 – New home starts in November were at a seasonally adjusted annual rate of 1.427 million; down 0.5% below October, and 16.4% below last November’s rate. Building Permits were at a seasonally adjusted annual rate of 1.342 million, down 11.2% compared to October, and down 22.4% over last year.
Industrial Production and Capacity Utilization – Released 12/15/2022 – In November, Industrial production decreased 0.2%. Manufacturing decreased 0.6%. Utilities output increased 3.6%. Mining output decreased 0.7%. Total industrial production was 2.5% higher in November than a year ago. Total capacity utilization decreased 0.2% in November to 79.7% which is 0.1% above its long run average.
Retail Sales – Released 12/15/2022 – US retail sales for November decreased 0.6% to $689.4 billion and retail sales are 6.5% above November 2021. US retail sales for the September 2022 through November 2022 period were up 7.7% from the same period a year ago.
Producer Price Index – Released 12/09/2022 – The PPI for final demand advanced 0.3% in November, seasonally adjusted, the US Bureau of Labor Statistics reported. Final demand prices also rose 0.3% in both October and September. On an unadjusted basis, the index for final demand moved up 7.4% for the 12 months ended in November. In November, most of the increase in the index for final demand less foods, energy, and trade services moved up 0.3% in November after rising 0.2% in October. For the 12 months ending in November, the index for final demand less foods, energy, and trade services increased 4.9%.
Next week we get data on PPI, Retail Sales, Industrial Production and Capacity Utilization, Housing Starts, and Existing Home Sales.
Data Sources:
Bureau of Economic Analysis (BEA)
Congressional Budget Office (CBO)
U.S. Bureau of Labor Statistics (BLS)
Federal Reserve Economic Data (FRED Charts)
CME Fed Watch
U.S. Treasury – Yields
U.S. Census Bureau
Institute for Supply Management (ISM)
Weekly DOL Employment Data
BLS Monthly Jobs Report
JOLTS
US Energy Admin (EIA)
BLS Consumer Price Index CPI
BLS Producer Price Index PPI
Atlanta Fed GDPNOW
NY Fed Nowcast GDP
US Census Bureau Housing Starts
Consumer Credit
USCB Retail Sales
Construction Spending
Federal Reserve Dot Plots
NY Empire Index
Philadelphia Federal Reserve
P/E Ratio Data -Yardeni Research
Technical Analysis Info:
StockCharts.com – Financial Charts
Exponential vs Simple moving average
Other Links:
1973 Arab Oil Embargo
Hunt Brothers Silver
Long-Term Capital bailout
Categories:
Tags: