Good Life Advisors – Talking Points – Week 1
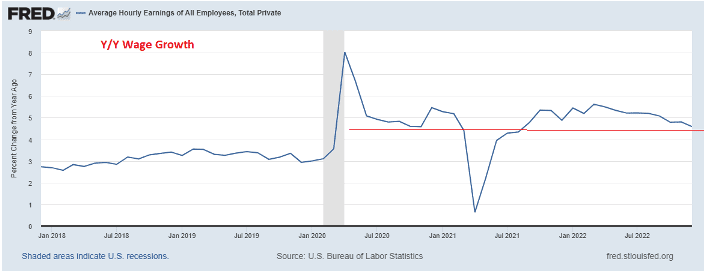
Equities were down all week until Fridays Goldilocksish jobs report. We got a slowing in wage growth, rising just 0.3% for the month while creating 223,000 new jobs. This helps the soft landing narrative where the fed can flip to a neutral stance earlier while avoiding a recession. Year over year wage growth was 4.59% and falling. The unemployment rate also fell back to 50 year lows at 3.5%.
Big tech was mostly higher this week, with MSFT a big decliner but META seeing some strength. TSLA continued its recent slide after missing on Q4 deliveries and extending China discounts (the EV space followed Tesla while other automakers and suppliers were stronger). Industrial and precious metals were among the bright spots in materials. Airlines were broadly higher. Homebuilders were boosted by the big slump in Treasury yields. China tech was very strong amid hopes Chinese regulators may be dialing back their crackdown of tech firms. Retail/apparel, building products, restaurants, casinos, semis, and asset managers were among the other outperformers. To the downside, managed-care names were broadly lower, and there were some notable decliners in the MedTech space. E&Ps, mortgage insurers, cloud software, solar, and select grocers and beverage names were also among the laggards.
Despite the start of a new year, the market remained attuned to the same themes that animated it in 2022, including the path of inflation, the state of the labor market, and the Fed’s policy response. On the Fed front, the big development was the release of the December FOMC meeting minutes on Wednesday. While these had been somewhat de-risked by the hawkish takeaways from the meeting itself, the minutes nevertheless served to show that while policymakers felt it was an appropriate time to dial back the pace of rate increases, they did not want to be seen as wavering in commitment to the inflation fight. Though there was no sort of hint as to whether the February meeting might favor a 25 or 50bp hike, the minutes indicated that no participants felt a pivot to rate cuts in 2023 would be appropriate and that the Fed remains alert to any unwarranted easing in financial conditions that would complicate their work.
The week also saw several meaningful economic releases that help inform the inflation and labor-market debates. In addition to the nonfarm payrolls report, easing price pressures were also seen in the December ISM manufacturing and services reports. There was also some attention on little-changed November job openings in the JOLTS report. But while the Fed has remained hopeful about seeing signs of labor-market easing consequent to its policy actions, investors also considered that the robust labor market is a key element in the Fed’s hoped-for path to a soft(ish) landing.
December CPI report out on Thursday. Consensus is currently looking for a flat reading m/m and the y/y rate to drop firmly below 7% for the first time since November 2021.

Yield Curve
Decmeber FOMC Statement December Fed Minutes Balance Sheet Reduction Plan Credit, Liquidity and Balance Sheet Federal Reserve Dot Plots
Treasury.gov yields FOMC Policy Normalization Statement Longer- Run Goals Jan 2022
Foreign Exchange Market
Energy Complex
The Baker Hughes rig count lost 7 this week. There are 772 oil and gas rigs operating in the US – Up 184 over last year.
Metals Complex
Employment Picture
December Jobs Report – BLS Summary Released 1/6/2023 – The US Economy added 223k nonfarm jobs in December and the Unemployment rate was declined to 3.5%. Average hourly earnings increased 9 cents to $32.82. Hiring highlights include +78k Education and Health Services, +67k Leisure and Hospitality, and +28 Construction.
- Average hourly earnings increased 9 cents/0.3% to $32.82.
- U3 unemployment rate declined 0.2% to 3.5%. U6 unemployment rate decreased 0.2% to 6.5%.
- The labor force participation rate was little changed at 62.3%.
- Average work week was declined 0.1 to 34.3 hours.
Weekly Unemployment Claims – Released Thursday 1/5/2023 – The week ending December 31st observed a decrease of 19k in initial claims decreasing to 204k. The four-week moving average of initial jobless claims was down 6.75k to 213,750.
Job Openings & Labor Turnover Survey JOLTS – Released 1/4/2023 – The number of job openings was little changed at 10.5 million on the last business day of November, the U.S. Bureau of Labor Statistics reported. Over the month the number of hires and total separations changed little at 6.1 million and 5.9 million, respectively. Within separations, quits (4.2 million) and layoffs and discharges (1.4 million) changed little.
Employment Cost Index – Released 10/28/2022 – Compensation costs for civilian workers increased 1.2% for the 3-month period ending in September 2022. The 12-month period ending on September 2022 saw compensation costs increase by 5.0%. The 12-month period ending September 2021 increased 3.7%. Wages and salaries increased 5.1 percent over the year and increased 4.2 percent for the 12-month period ending in September 2021. Benefit costs increased 4.9 percent over the year and increased 2.5 percent for the 12-month period ending in September 2021. This report is published quarterly.
This Week’s Economic Data
U.S. Trade Balance – Released 1/5/2023 – The U.S. monthly international trade deficit decreased in November 2022 according to the U.S. Bureau of Economic Analysis and the U.S. Census Bureau. The deficit decreased from $77.8 billion in October (revised) to $61.5 billion in November. November exports were $251.9 billion, $5.1 billion less than October exports. November imports were $313.4 billion, $21.5 billion less than October imports. Year-to-date, the goods and services deficit increased $120.1 billion, or 15.7 percent, from the same period in 2021. Exports increased $439.4 billion or 18.9 percent. Imports increased $559.5 billion or 18.1 percent.
PMI Non-Manufacturing Index – Released 1/5/2023 – Economic activity entered contraction territory in December ending 30 months of expansion — with the Services PMI® registering 49.6 percent — In December, the Services PMI® registered 49.6 percent, 6.9 percentage points lower than November’s reading of 56.5 percent.
PMI Manufacturing Index – Released 1/3/2023 – The December Manufacturing PMI® registered 48.4 percent, 0.6 percentage points lower than the 49 percent recorded in November. Regarding the overall economy, this figure indicates contraction following 30 months of expansion. The Manufacturing PMI® figure is the lowest since May 2020, when it registered 43.5 percent. The New Orders Index remained in contraction territory at 45.2 percent, 2 percentage points lower than the 47.2 percent recorded in November.
U.S. Construction Spending– Released 1/3/2023 – Construction spending during November 2022 was estimated at a seasonally adjusted annual rate of $1,807.5 billion, 0.2 percent above the revised October estimate of $1,803.2 billion. The November figure is 8.5 percent above the November 2021 estimate of $1,665.2 billion. During the first eleven months of this year, construction spending amounted to $1,657.6 billion, 10.5 percent above the $1,499.8 billion for the same period in 2021.
Recent Economic Date
Links take you to the data source
Chicago PMI– Released 12/30/2022 – Chicago PMI remained in contraction territory but increased in December by 7.7 points to 44.9
US Light Vehicle Sales– Released 12/23/2022 – U.S. light vehicle sales were at a seasonally adjusted annual rate (SAAR) of 14.134 million units in November.
Personal Income – Released 12/23/2022 – Personal income increased $80.1 billion, or 0.4 percent in November. Disposable Personal Income increased $68.6 billion or 0.4 percent. Personal Consumption Expenditure increased $19.8 billion or 0.1 percent.
Durable Goods Released 12/23/2022 – New orders for manufactured durable goods in November decreased $5.8 billion or 2.1% to $270.6 billion. Transportation equipment increased up $0.7 billion or 0.8% to $91.8 billion.
New Residential Sales Released 12/23/2022 – Sales of new single-family homes increased 5.8% to 640k, seasonally adjusted, in November. The median sales price of new homes sold in November was $471,200 with an average sales price of $543,600. At the end of November, the seasonally adjusted estimate of new homes for sale was 461k. This represents a supply of 8.6 months at the current sales rate.
Third Estimate of 3rd Quarter 2022 GDP Released 12/22/2022 – Real gross domestic product (GDP) increased at an annual rate of 3.2 percent in the third quarter of 2022 according to the third estimate released by the Bureau of Economic Analysis, in contrast to a decrease of 0.6 percent in the second quarter. The “third” estimate of GDP released today is based on more complete source data than were available for the “second” estimate issued last month. In the second estimate, the increase in real GDP was 2.9 percent. The updated estimates primarily reflected upward revisions to consumer spending and nonresidential fixed investment that were partly offset by a downward revision to private inventory investment. The increase in the third quarter primarily reflected increases in exports and consumer spending that were partly offset by a decrease in housing investment.
Consumer Confidence– Released 12/21/2022 – The Conference Board Consumer Confidence Index® increased in December. The Index now stands at 108.3 (1985=100), up from 101.4 in November.
Existing Home Sales Released 12/21/2022 – Existing home sales decreased in November marking ten consecutive months of declines. Sales declined 7.7% to a seasonally adjusted rate of 4.09 million in November. Sales decreased 35.4% year-over-year. Housing inventory sits at 1.14 million units. Down 6.6% from October’s inventory. Up 2.7% over last year. Unsold inventory sits at a 3.3-month supply. The median existing home price for all housing types was $370,700 which is up 3.5% from November 2021. This marks 129 consecutive months of year-over-year increases, the longest-running streak on record.
Housing Starts– Released 12/20/2022 – New home starts in November were at a seasonally adjusted annual rate of 1.427 million; down 0.5% below October, and 16.4% below last November’s rate. Building Permits were at a seasonally adjusted annual rate of 1.342 million, down 11.2% compared to October, and down 22.4% over last year.
Industrial Production and Capacity Utilization Released 12/15/2022 – In November Industrial production decreased 0.2%. Manufacturing decreased 0.6%. Utilities output increased 3.6%. Mining output decreased 0.7%. Total industrial production was 2.5% higher in November than a year ago. Total capacity utilization decreased 0.2% in November to 79.7% which is 0.1% above its long run average.
Retail Sales– Released 12/15/2022 – U.S. retail sales for November decreased 0.6% to $689.4 billion and retail sales are 6.5% above November 2021. U.S. retail sales for the September 2022 through November 2022 period were up 7.7% from the same period a year ago.
Consumer Price Index – Released 12/13/2022 – Consumer prices increased 0.1% m/m in November following a 0.4% increase in October. Consumer prices are up 7.1% for the 12-month period ending in November. Core consumer prices increased 0.2% m/m in November.
Producer Price Index – Released 12/09/2022 – The PPI for final demand advanced 0.3 percent in November, seasonally adjusted, the U.S. Bureau of Labor Statistics reported. Final demand prices also rose 0.3 percent in both October and September. (See table A.) On an unadjusted basis, the index for final demand moved up 7.4 percent for the 12 months ended in November. In November, most of the increase in the index for final demand is attributable to a 0.4-percent advance in prices for final demand services. The index for final demand goods inched up 0.1
percent. Prices for final demand less foods, energy, and trade services moved up 0.3 percent in November after rising 0.2 percent in October. For the 12 months ended in November, the index for final demand less foods, energy, and trade services increased 4.9 percent.
Consumer Credit – Released 12/7/2022 . In October, consumer credit increased at a seasonally adjusted annual rate of 6.9 percent. Revolving credit increased at an annual rate of 10.4 percent, while nonrevolving credit increased at an annual rate of 5.8 percent.
Next week we get data on Consumer Credit and CPI.
Data Sources:
Bureau of Economic Analysis (BEA)
Congressional Budget Office (CBO)
U.S. Bureau of Labor Statistics (BLS)
Federal Reserve Economic Data (FRED Charts)
CME Fed Watch
U.S. Treasury – Yields
U.S. Census Bureau
Institute for Supply Management (ISM)
Weekly DOL Employment Data
BLS Monthly Jobs Report
JOLTS
US Energy Admin (EIA)
BLS Consumer Price Index CPI
BLS Producer Price Index PPI
Atlanta Fed GDPNOW
NY Fed Nowcast GDP
US Census Bureau Housing Starts
Consumer Credit
USCB Retail Sales
Construction Spending
Federal Reserve Dot Plots
NY Empire Index
Philadelphia Federal Reserve
P/E Ratio Data -Yardeni Research
Technical Analysis Info:
StockCharts.com – Financial Charts
Exponential vs Simple moving average
Other Links:
1973 Arab Oil Embargo
Hunt Brothers Silver
Long-Term Capital bailout


Week 1 Talking Points
Table of Contents
Good Life Advisors – Talking Points – Week 1
Equities were down all week until Fridays Goldilocksish jobs report. We got a slowing in wage growth, rising just 0.3% for the month while creating 223,000 new jobs. This helps the soft landing narrative where the fed can flip to a neutral stance earlier while avoiding a recession. Year over year wage growth was 4.59% and falling. The unemployment rate also fell back to 50 year lows at 3.5%.
Big tech was mostly higher this week, with MSFT a big decliner but META seeing some strength. TSLA continued its recent slide after missing on Q4 deliveries and extending China discounts (the EV space followed Tesla while other automakers and suppliers were stronger). Industrial and precious metals were among the bright spots in materials. Airlines were broadly higher. Homebuilders were boosted by the big slump in Treasury yields. China tech was very strong amid hopes Chinese regulators may be dialing back their crackdown of tech firms. Retail/apparel, building products, restaurants, casinos, semis, and asset managers were among the other outperformers. To the downside, managed-care names were broadly lower, and there were some notable decliners in the MedTech space. E&Ps, mortgage insurers, cloud software, solar, and select grocers and beverage names were also among the laggards.
Despite the start of a new year, the market remained attuned to the same themes that animated it in 2022, including the path of inflation, the state of the labor market, and the Fed’s policy response. On the Fed front, the big development was the release of the December FOMC meeting minutes on Wednesday. While these had been somewhat de-risked by the hawkish takeaways from the meeting itself, the minutes nevertheless served to show that while policymakers felt it was an appropriate time to dial back the pace of rate increases, they did not want to be seen as wavering in commitment to the inflation fight. Though there was no sort of hint as to whether the February meeting might favor a 25 or 50bp hike, the minutes indicated that no participants felt a pivot to rate cuts in 2023 would be appropriate and that the Fed remains alert to any unwarranted easing in financial conditions that would complicate their work.
The week also saw several meaningful economic releases that help inform the inflation and labor-market debates. In addition to the nonfarm payrolls report, easing price pressures were also seen in the December ISM manufacturing and services reports. There was also some attention on little-changed November job openings in the JOLTS report. But while the Fed has remained hopeful about seeing signs of labor-market easing consequent to its policy actions, investors also considered that the robust labor market is a key element in the Fed’s hoped-for path to a soft(ish) landing.
December CPI report out on Thursday. Consensus is currently looking for a flat reading m/m and the y/y rate to drop firmly below 7% for the first time since November 2021.
Yield Curve
Decmeber FOMC Statement December Fed Minutes Balance Sheet Reduction Plan Credit, Liquidity and Balance Sheet Federal Reserve Dot Plots
Treasury.gov yields FOMC Policy Normalization Statement Longer- Run Goals Jan 2022
Foreign Exchange Market
Energy Complex
The Baker Hughes rig count lost 7 this week. There are 772 oil and gas rigs operating in the US – Up 184 over last year.
Metals Complex
Employment Picture
December Jobs Report – BLS Summary Released 1/6/2023 – The US Economy added 223k nonfarm jobs in December and the Unemployment rate was declined to 3.5%. Average hourly earnings increased 9 cents to $32.82. Hiring highlights include +78k Education and Health Services, +67k Leisure and Hospitality, and +28 Construction.
Weekly Unemployment Claims – Released Thursday 1/5/2023 – The week ending December 31st observed a decrease of 19k in initial claims decreasing to 204k. The four-week moving average of initial jobless claims was down 6.75k to 213,750.
Job Openings & Labor Turnover Survey JOLTS – Released 1/4/2023 – The number of job openings was little changed at 10.5 million on the last business day of November, the U.S. Bureau of Labor Statistics reported. Over the month the number of hires and total separations changed little at 6.1 million and 5.9 million, respectively. Within separations, quits (4.2 million) and layoffs and discharges (1.4 million) changed little.
Employment Cost Index – Released 10/28/2022 – Compensation costs for civilian workers increased 1.2% for the 3-month period ending in September 2022. The 12-month period ending on September 2022 saw compensation costs increase by 5.0%. The 12-month period ending September 2021 increased 3.7%. Wages and salaries increased 5.1 percent over the year and increased 4.2 percent for the 12-month period ending in September 2021. Benefit costs increased 4.9 percent over the year and increased 2.5 percent for the 12-month period ending in September 2021. This report is published quarterly.
This Week’s Economic Data
U.S. Trade Balance – Released 1/5/2023 – The U.S. monthly international trade deficit decreased in November 2022 according to the U.S. Bureau of Economic Analysis and the U.S. Census Bureau. The deficit decreased from $77.8 billion in October (revised) to $61.5 billion in November. November exports were $251.9 billion, $5.1 billion less than October exports. November imports were $313.4 billion, $21.5 billion less than October imports. Year-to-date, the goods and services deficit increased $120.1 billion, or 15.7 percent, from the same period in 2021. Exports increased $439.4 billion or 18.9 percent. Imports increased $559.5 billion or 18.1 percent.
PMI Non-Manufacturing Index – Released 1/5/2023 – Economic activity entered contraction territory in December ending 30 months of expansion — with the Services PMI® registering 49.6 percent — In December, the Services PMI® registered 49.6 percent, 6.9 percentage points lower than November’s reading of 56.5 percent.
PMI Manufacturing Index – Released 1/3/2023 – The December Manufacturing PMI® registered 48.4 percent, 0.6 percentage points lower than the 49 percent recorded in November. Regarding the overall economy, this figure indicates contraction following 30 months of expansion. The Manufacturing PMI® figure is the lowest since May 2020, when it registered 43.5 percent. The New Orders Index remained in contraction territory at 45.2 percent, 2 percentage points lower than the 47.2 percent recorded in November.
U.S. Construction Spending– Released 1/3/2023 – Construction spending during November 2022 was estimated at a seasonally adjusted annual rate of $1,807.5 billion, 0.2 percent above the revised October estimate of $1,803.2 billion. The November figure is 8.5 percent above the November 2021 estimate of $1,665.2 billion. During the first eleven months of this year, construction spending amounted to $1,657.6 billion, 10.5 percent above the $1,499.8 billion for the same period in 2021.
Recent Economic Date
Links take you to the data source
Chicago PMI– Released 12/30/2022 – Chicago PMI remained in contraction territory but increased in December by 7.7 points to 44.9
US Light Vehicle Sales– Released 12/23/2022 – U.S. light vehicle sales were at a seasonally adjusted annual rate (SAAR) of 14.134 million units in November.
Personal Income – Released 12/23/2022 – Personal income increased $80.1 billion, or 0.4 percent in November. Disposable Personal Income increased $68.6 billion or 0.4 percent. Personal Consumption Expenditure increased $19.8 billion or 0.1 percent.
Durable Goods Released 12/23/2022 – New orders for manufactured durable goods in November decreased $5.8 billion or 2.1% to $270.6 billion. Transportation equipment increased up $0.7 billion or 0.8% to $91.8 billion.
New Residential Sales Released 12/23/2022 – Sales of new single-family homes increased 5.8% to 640k, seasonally adjusted, in November. The median sales price of new homes sold in November was $471,200 with an average sales price of $543,600. At the end of November, the seasonally adjusted estimate of new homes for sale was 461k. This represents a supply of 8.6 months at the current sales rate.
Third Estimate of 3rd Quarter 2022 GDP Released 12/22/2022 – Real gross domestic product (GDP) increased at an annual rate of 3.2 percent in the third quarter of 2022 according to the third estimate released by the Bureau of Economic Analysis, in contrast to a decrease of 0.6 percent in the second quarter. The “third” estimate of GDP released today is based on more complete source data than were available for the “second” estimate issued last month. In the second estimate, the increase in real GDP was 2.9 percent. The updated estimates primarily reflected upward revisions to consumer spending and nonresidential fixed investment that were partly offset by a downward revision to private inventory investment. The increase in the third quarter primarily reflected increases in exports and consumer spending that were partly offset by a decrease in housing investment.
Consumer Confidence– Released 12/21/2022 – The Conference Board Consumer Confidence Index® increased in December. The Index now stands at 108.3 (1985=100), up from 101.4 in November.
Existing Home Sales Released 12/21/2022 – Existing home sales decreased in November marking ten consecutive months of declines. Sales declined 7.7% to a seasonally adjusted rate of 4.09 million in November. Sales decreased 35.4% year-over-year. Housing inventory sits at 1.14 million units. Down 6.6% from October’s inventory. Up 2.7% over last year. Unsold inventory sits at a 3.3-month supply. The median existing home price for all housing types was $370,700 which is up 3.5% from November 2021. This marks 129 consecutive months of year-over-year increases, the longest-running streak on record.
Housing Starts– Released 12/20/2022 – New home starts in November were at a seasonally adjusted annual rate of 1.427 million; down 0.5% below October, and 16.4% below last November’s rate. Building Permits were at a seasonally adjusted annual rate of 1.342 million, down 11.2% compared to October, and down 22.4% over last year.
Industrial Production and Capacity Utilization Released 12/15/2022 – In November Industrial production decreased 0.2%. Manufacturing decreased 0.6%. Utilities output increased 3.6%. Mining output decreased 0.7%. Total industrial production was 2.5% higher in November than a year ago. Total capacity utilization decreased 0.2% in November to 79.7% which is 0.1% above its long run average.
Retail Sales– Released 12/15/2022 – U.S. retail sales for November decreased 0.6% to $689.4 billion and retail sales are 6.5% above November 2021. U.S. retail sales for the September 2022 through November 2022 period were up 7.7% from the same period a year ago.
Consumer Price Index – Released 12/13/2022 – Consumer prices increased 0.1% m/m in November following a 0.4% increase in October. Consumer prices are up 7.1% for the 12-month period ending in November. Core consumer prices increased 0.2% m/m in November.
Producer Price Index – Released 12/09/2022 – The PPI for final demand advanced 0.3 percent in November, seasonally adjusted, the U.S. Bureau of Labor Statistics reported. Final demand prices also rose 0.3 percent in both October and September. (See table A.) On an unadjusted basis, the index for final demand moved up 7.4 percent for the 12 months ended in November. In November, most of the increase in the index for final demand is attributable to a 0.4-percent advance in prices for final demand services. The index for final demand goods inched up 0.1
percent. Prices for final demand less foods, energy, and trade services moved up 0.3 percent in November after rising 0.2 percent in October. For the 12 months ended in November, the index for final demand less foods, energy, and trade services increased 4.9 percent.
Consumer Credit – Released 12/7/2022 . In October, consumer credit increased at a seasonally adjusted annual rate of 6.9 percent. Revolving credit increased at an annual rate of 10.4 percent, while nonrevolving credit increased at an annual rate of 5.8 percent.
Next week we get data on Consumer Credit and CPI.
Data Sources:
Bureau of Economic Analysis (BEA)
Congressional Budget Office (CBO)
U.S. Bureau of Labor Statistics (BLS)
Federal Reserve Economic Data (FRED Charts)
CME Fed Watch
U.S. Treasury – Yields
U.S. Census Bureau
Institute for Supply Management (ISM)
Weekly DOL Employment Data
BLS Monthly Jobs Report
JOLTS
US Energy Admin (EIA)
BLS Consumer Price Index CPI
BLS Producer Price Index PPI
Atlanta Fed GDPNOW
NY Fed Nowcast GDP
US Census Bureau Housing Starts
Consumer Credit
USCB Retail Sales
Construction Spending
Federal Reserve Dot Plots
NY Empire Index
Philadelphia Federal Reserve
P/E Ratio Data -Yardeni Research
Technical Analysis Info:
StockCharts.com – Financial Charts
Exponential vs Simple moving average
Other Links:
1973 Arab Oil Embargo
Hunt Brothers Silver
Long-Term Capital bailout
Categories:
Tags: