Good Life Advisors – Talking Points – Week 3
Debt Ceiling Battle Coming
The US hit the debt ceiling on Thursday prompting the Treasury to take action. Secretary Yellen says the agency will implement extraordinary measures so we don’t default. She said those actions will prevent default until June. The market wasn’t too concerned as the focus remains on inflation. We’ll see how long Washington wants to play chicken with a default. The next few months will surely provide some surprises.
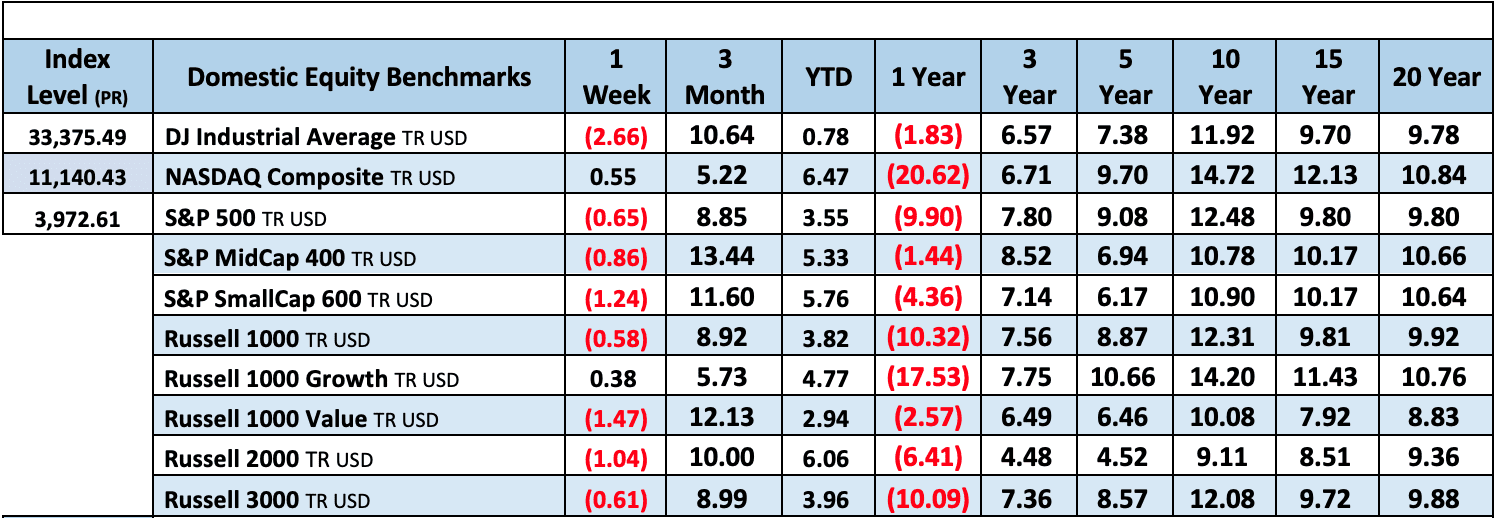
Major US equity indices finished mostly lower over the holiday-shortened week, with a Friday bounce for the S&P not enough to completely erase earlier slides. As of last Friday, the S&P had risen nearly 4.2% for the year, ending just shy of the 4000 mark and crossing above its 200-day moving average; this Wednesday saw the index post its worst session since 15-Dec though it regained the 200 dma by close on Friday. The Nasdaq clawed back into the green thanks to Friday’s outsized gains (with GOOGL and NFLX among the big drivers). Treasuries were mostly firmer, with yields coming off worst levels after a big Wednesday rally that saw the 10Y finish at 3.37% (the lowest mark since September and in contrast to the 3.88% at the end of 2022). The dollar was weaker overall, with the DXY (0.2%). Gold finished slightly higher, gaining 0.3%. Oil settled higher as well, with WTI ending the week up 2% with the market narrative still focused on the demand prospects from China’s normalization.
The Fed’s consistent raise-and-hold messaging also continued to be a drag on sentiment. Several policy makers took the opportunity to speak ahead of the blackout period before the 1-Feb FOMC meeting. Governor Brainard 9voter) was one of the more dovish speakers, reaffirming that it will take time under restrictive monetary policy to return inflation to the 2% target, though she conceded that recent inflation readings have been promising. NY Fed President Williams (voter) also stressed that the Fed still has work to do. Dallas Fed’s Logan (voter) argued rates could have to move to a higher level than expected, while Boston’s Collins (nonvoter) said she can see rates topping 5% before the Fed pauses.
We saw another string of layoff announcements, which came alongside corporate earnings calls highlighting cost management to help preserve margins. Notably Microsoft axing 10,000 and Alphabet (Google parent) cutting 12,000 jobs. The weekly initial jobless claims dropped back below 200k, another pointing to a soft landing despite worries elsewhere. There was continued evidence of easing supply chain stresses and softening input prices. The beaten-down housing market saw a ray of light this week with a notable jump in mortgage demand. Retiring Kansas City Fed President George pointed to the health of consumer balance sheets. China is still seen to be a major growth driver as economic activity normalizes after the easing of Covid restrictions. And in terms of positioning, BofA noted this week that allocation to US equities is now the most underweight since October 2005.
The Q4 earnings season began to ramp up this week, with 26 S&P constituents reporting. According to FactSet’s latest Earnings Insight report, thus far (with 11% of the index having reported), the blended earnings decline for the quarter is 4.6%, lower than the 3.2% decline expected as of 31-Dec. The number and magnitude of earnings surprises is also below five- and ten-year averages. The blended revenue growth rate of 3.7% is also below the 3.9% expected at the end of the quarter.
Among the larger reporters, PG organic growth was light , with management saying FY23 EPS may come in at the low end of guidance on cost headwinds. MS beat with Global Wealth Management a bright spot. NFLX posted a big beat on subs, and analysts were positive on FCF and better FY23 margin guidance. Goldman Sachs logged its biggest earnings miss since 2011 amid higher provision and elevated expenses, while capital markets also came in below expectations. Schlumberger beat with strong results from Digital & Integration, though FCF was weak on continued capex investments. PNC financial missed with a larger-than-expected provision build amid a weakening economic outlook, and revenue-growth guidance disappointed. State Street surprised to the upside while guidance for 20% net interest income growth in FY23 was above the Street.
This week will be very busy on the earnings front, with 93 S&P constituents reporting. Among the other major names will be MSFT, V, JNJ, TSLA, MA, CVX, DHR, ABT, VZ, CMCSA, TXN, RTX, T, UNP, BA, INTC, LMT, and AXP. In terms of major economic releases, investors will process December building permits (Monday); January flash PMIs (Tuesday); Q4 GDP, December durable-goods orders, and December new-home sales (Thursday); and December PCE and pending-home sales (Friday). The calendar is free of Fedspeak as the bank is entering its “quiet period” ahead of the Feb 1st FOMC meeting. The CME FedWatch Tool has a 25bp hike coming in at a 99% chance, and sows the March meeting at an 80% chance of another 25bp.

Fixed Income
Yield Curve
December FOMC Statement December Fed Minutes Balance Sheet Reduction Plan Credit, Liquidity and Balance Sheet Federal Reserve Dot Plots
Treasury.gov yields FOMC Policy Normalization Statement Longer- Run Goals Jan 2022
Foreign Exchange Market
Energy Complex
The Baker Hughes rig count lost 4 this week. There are 771 oil and gas rigs operating in the US – Up 167 over last year.
Metals Complex
Employment Picture
Weekly Unemployment Claims– Released Thursday 1/19/2023 – The week ending January 14th observed a decrease of 15k in initial claims decreasing to 190k. The four-week moving average of initial jobless claims was down 6.5k to 206k.
December Jobs Report – BLS Summary – Released 1/6/2023 – The US Economy added 223k nonfarm jobs in December and the Unemployment rate was declined to 3.5%. Average hourly earnings increased 9 cents to $32.82. Hiring highlights include +78k Education and Health Services, +67k Leisure and Hospitality, and +28 Construction.
- Average hourly earnings increased 9 cents/ 0.3% to $32.82.
- U3 unemployment rate declined 0.2% to 3.5%. U6 unemployment rate decreased 0.2% to 6.5%.
- The labor force participation rate was little changed at 62.3%.
- Average work week was declined 0.1 to 34.3 hours.
Job Openings & Labor Turnover Survey – JOLTS – Released 1/4/2023 – The number of job openings was little changed at 10.5 million on the last business day of November, the US Bureau of Labor Statistics reported. Over the month, the number of hires and total separations changed little at 6.1 million and 5.9 million, respectively. Within separations, quits (4.2 million) and layoffs and discharges (1.4 million) changed little.
Employment Cost Index – Released 10/28/2022 – Compensation costs for civilian workers increased 1.2% for the 3-month period ending in September 2022. The 12-month period ending in September 2022 saw compensation costs increase by 5%. The 12-month period ending September 2021 increased 3.7%. Wages and salaries increased 5.1% over the year and increased 4.2% for the 12-month period ending in September 2021. Benefit costs increased 4.9% over the year and increased 2.5% for the 12-month period ending in September 2021. This report is published quarterly.
This Week’s Economic Data
Links take you to the data source
Existing Home Sales – Released 1/20/2023 – Existing home sales decreased in December marking eleven consecutive months of declines. Sales declined 1.5% to a seasonally adjusted rate of 4.02 million in December. Sales decreased 34% year-over-year. Housing inventory sits at 970k units, down 13.4% from November’s inventory, up 10.2% over last year. Unsold inventory sits at a 2.9-month supply. The median existing home price for all housing types was $366,900 which is up 2.3% from December 2021. This marks 130 consecutive months of year-over-year increases, the longest-running streak on record.
Housing Starts – Released 1/19/2023 – New home starts in December were at a seasonally adjusted annual rate of 1.382 million; down 1.4% below November, and 21.8% below last December’s rate. Building Permits were at a seasonally adjusted annual rate of 1.33 million, down 1.6% compared to November, and down 29.9% over last year.
Industrial Production and Capacity Utilization – Released 1/18/2023 – In December, Industrial production decreased 0.7%. Manufacturing decreased 1.3%. Utilities output increased 3.8%. Mining output decreased 0.9%. Total industrial production was 1.6% higher in December than a year ago. Total capacity utilization decreased 0.6% in December to 78.8% which is 0.8% below its long run average.
Retail Sales – Released 1/18/2023 – US retail sales for December decreased 1.1% to $677.1 billion, but retail sales are 6% above December 2021. US retail sales for the October 2022 through December 2022 period were up 6.7% from the same period a year ago.
Producer Price Index – Released 1/18/2023 – The PPI for final demand declined 0.5% in December, seasonally adjusted, the US Bureau of Labor Statistics reported. Final demand prices advanced 0.2% in November and 0.4% in October. On an unadjusted basis, the index for final demand increased 6.2% in 2022 after rising 10% in 2021.
Recent Economic Date
Links take you to the data source
Consumer Price Index – Released 1/12/2023 – Consumer prices decreased 0.1% m/m in December following a 0.1% increase in November. Consumer prices are up 6.5% for the 12-month period ending in December. Core consumer prices increased 0.3% m/m in December.
Consumer Credit – Released 1/9/2023 – In November, consumer credit increased at a seasonally adjusted annual rate of 7.1%. Revolving credit increased at an annual rate of 16.9%, while nonrevolving credit increased at an annual rate of 3.9%.
U.S. Trade Balance – Released 1/5/2023 – The US monthly international trade deficit decreased in November 2022 according to the US Bureau of Economic Analysis and the US Census Bureau. The deficit decreased from $77.8 billion in October (revised) to $61.5 billion in NOvember. November exports were $251.9 billion, $5.1 billion less than October exports. November imports were $313.4 billion, $21.5 billion less than October imports. YEar-to-date, the goods and services deficit increased $120.1 billion, or 15.7%, from the same period in 2021. Exports increased $439.4 billion or 18.9%. Imports increased $559.5 billion or 18.1%.
PMI Non-Manufacturing Index – Released 1/5/2023 – Economic activity entered contraction territory in December ending 30 months of expansion – with the Services PMI® registered 49.6%, 6.9 percentage points lower than November’s reading of 56.5%.
U.S. Construction Spending – Released 1/3/2023 – Construction spending during November 2022 was estimated at a seasonally adjusted annual rate of $1,807.5 billion, 0.2% above the revised October estimate of $1,803.2 billion. The November figure is 8.5% above the NOvember 2021 estimate of $1,665.2 billion. During the first eleven months of this year, construction spending amounted to $1,657.6 billion, 10.5% above the $1,499.8 billion for the same period in 2021.
Chicago PMI – Released 12/30/2022 – Chicago PMI remained in contraction territory but increased in December by 7.7 points to 44.9.
US Light Vehicle Sales – Released 12/23/2022 – US light vehicle sales were at a seasonally adjusted annual rate (SAAR) of 14.134 million units in November.
Personal Income – Released 12/23/2022 – Personal income increased $80.1 billion, or 0.4% in November. Disposable Personal Income increased $68.6 billion or 0.4%. Personal Consumption Expenditure increased $19.8 billion or 0.1%.
Durable Goods – Released 12/23/2022 – New orders for manufactured durable goods in November decreased $5.8 billion or 2.1% to $270.6 billion. Transportation equipment increased up $0.7 billion or 0.8% to $91.8 billion.
New Residential Sales – Released 12/23/2022 – Sales of new single-family homes increased 5.8% to 640k, seasonally adjusted, in November. The median sales price of new homes sold in November was $471,200 with an average sales price of $543,600. At the end of November, the seasonally adjusted estimate of new homes for sale was 461k. This represents a supply of 8.6 months at the current sales rate.
Third Estimate of 3rd Quarter 2022 GDP – Released 12/22/2022 – Real gross domestic product (GDP) increased at an annual rate of 3.2% in the third quarter of 2022 according to the third estimate released by the Bureau of Economic Analysis, in contrast to a decrease of 0.6% in the second quarter. The “third” estimate of GDP released today is based on more complete source data than were available for the “second” estimate issued last month. In the second estimate, the increase in real GDP was 2.9%. The updated estimates primarily reflected upward revisions to consumer spending and nonresidential fixed investment that were partly offset by a downward revision to private inventory investment. The increase in the third quarter primarily reflected increases in exports and consumer spending that were partly offset by a decrease in housing investment.
Consumer Confidence – Released 12/21/2022 – The Conference Board Consumer Confidence Index® increased in December. The Index now stands at 108.3 (1985=100), up from 101.4 in November.
Next week we get data on the 1st estimate of 4th quarter 2022 GDP, New Residential Sales, Durable Goods, and Personal Income.
Data Sources:
Bureau of Economic Analysis (BEA)
Congressional Budget Office (CBO)
U.S. Bureau of Labor Statistics (BLS)
Federal Reserve Economic Data (FRED Charts)
CME Fed Watch
U.S. Treasury – Yields
U.S. Census Bureau
Institute for Supply Management (ISM)
Weekly DOL Employment Data
BLS Monthly Jobs Report
JOLTS
US Energy Admin (EIA)
BLS Consumer Price Index CPI
BLS Producer Price Index PPI
Atlanta Fed GDPNOW
NY Fed Nowcast GDP
US Census Bureau Housing Starts
Consumer Credit
USCB Retail Sales
Construction Spending
Federal Reserve Dot Plots
NY Empire Index
Philadelphia Federal Reserve
P/E Ratio Data -Yardeni Research
Technical Analysis Info:
StockCharts.com – Financial Charts
Exponential vs Simple moving average
Other Links:
1973 Arab Oil Embargo
Hunt Brothers Silver
Long-Term Capital bailout


Week 3 Talking Points
Table of Contents
Good Life Advisors – Talking Points – Week 3
Debt Ceiling Battle Coming
The US hit the debt ceiling on Thursday prompting the Treasury to take action. Secretary Yellen says the agency will implement extraordinary measures so we don’t default. She said those actions will prevent default until June. The market wasn’t too concerned as the focus remains on inflation. We’ll see how long Washington wants to play chicken with a default. The next few months will surely provide some surprises.
Major US equity indices finished mostly lower over the holiday-shortened week, with a Friday bounce for the S&P not enough to completely erase earlier slides. As of last Friday, the S&P had risen nearly 4.2% for the year, ending just shy of the 4000 mark and crossing above its 200-day moving average; this Wednesday saw the index post its worst session since 15-Dec though it regained the 200 dma by close on Friday. The Nasdaq clawed back into the green thanks to Friday’s outsized gains (with GOOGL and NFLX among the big drivers). Treasuries were mostly firmer, with yields coming off worst levels after a big Wednesday rally that saw the 10Y finish at 3.37% (the lowest mark since September and in contrast to the 3.88% at the end of 2022). The dollar was weaker overall, with the DXY (0.2%). Gold finished slightly higher, gaining 0.3%. Oil settled higher as well, with WTI ending the week up 2% with the market narrative still focused on the demand prospects from China’s normalization.
The Fed’s consistent raise-and-hold messaging also continued to be a drag on sentiment. Several policy makers took the opportunity to speak ahead of the blackout period before the 1-Feb FOMC meeting. Governor Brainard 9voter) was one of the more dovish speakers, reaffirming that it will take time under restrictive monetary policy to return inflation to the 2% target, though she conceded that recent inflation readings have been promising. NY Fed President Williams (voter) also stressed that the Fed still has work to do. Dallas Fed’s Logan (voter) argued rates could have to move to a higher level than expected, while Boston’s Collins (nonvoter) said she can see rates topping 5% before the Fed pauses.
We saw another string of layoff announcements, which came alongside corporate earnings calls highlighting cost management to help preserve margins. Notably Microsoft axing 10,000 and Alphabet (Google parent) cutting 12,000 jobs. The weekly initial jobless claims dropped back below 200k, another pointing to a soft landing despite worries elsewhere. There was continued evidence of easing supply chain stresses and softening input prices. The beaten-down housing market saw a ray of light this week with a notable jump in mortgage demand. Retiring Kansas City Fed President George pointed to the health of consumer balance sheets. China is still seen to be a major growth driver as economic activity normalizes after the easing of Covid restrictions. And in terms of positioning, BofA noted this week that allocation to US equities is now the most underweight since October 2005.
The Q4 earnings season began to ramp up this week, with 26 S&P constituents reporting. According to FactSet’s latest Earnings Insight report, thus far (with 11% of the index having reported), the blended earnings decline for the quarter is 4.6%, lower than the 3.2% decline expected as of 31-Dec. The number and magnitude of earnings surprises is also below five- and ten-year averages. The blended revenue growth rate of 3.7% is also below the 3.9% expected at the end of the quarter.
Among the larger reporters, PG organic growth was light , with management saying FY23 EPS may come in at the low end of guidance on cost headwinds. MS beat with Global Wealth Management a bright spot. NFLX posted a big beat on subs, and analysts were positive on FCF and better FY23 margin guidance. Goldman Sachs logged its biggest earnings miss since 2011 amid higher provision and elevated expenses, while capital markets also came in below expectations. Schlumberger beat with strong results from Digital & Integration, though FCF was weak on continued capex investments. PNC financial missed with a larger-than-expected provision build amid a weakening economic outlook, and revenue-growth guidance disappointed. State Street surprised to the upside while guidance for 20% net interest income growth in FY23 was above the Street.
This week will be very busy on the earnings front, with 93 S&P constituents reporting. Among the other major names will be MSFT, V, JNJ, TSLA, MA, CVX, DHR, ABT, VZ, CMCSA, TXN, RTX, T, UNP, BA, INTC, LMT, and AXP. In terms of major economic releases, investors will process December building permits (Monday); January flash PMIs (Tuesday); Q4 GDP, December durable-goods orders, and December new-home sales (Thursday); and December PCE and pending-home sales (Friday). The calendar is free of Fedspeak as the bank is entering its “quiet period” ahead of the Feb 1st FOMC meeting. The CME FedWatch Tool has a 25bp hike coming in at a 99% chance, and sows the March meeting at an 80% chance of another 25bp.
Fixed Income
Yield Curve
December FOMC Statement December Fed Minutes Balance Sheet Reduction Plan Credit, Liquidity and Balance Sheet Federal Reserve Dot Plots
Treasury.gov yields FOMC Policy Normalization Statement Longer- Run Goals Jan 2022
Foreign Exchange Market
Energy Complex
The Baker Hughes rig count lost 4 this week. There are 771 oil and gas rigs operating in the US – Up 167 over last year.
Metals Complex
Employment Picture
Weekly Unemployment Claims– Released Thursday 1/19/2023 – The week ending January 14th observed a decrease of 15k in initial claims decreasing to 190k. The four-week moving average of initial jobless claims was down 6.5k to 206k.
December Jobs Report – BLS Summary – Released 1/6/2023 – The US Economy added 223k nonfarm jobs in December and the Unemployment rate was declined to 3.5%. Average hourly earnings increased 9 cents to $32.82. Hiring highlights include +78k Education and Health Services, +67k Leisure and Hospitality, and +28 Construction.
Job Openings & Labor Turnover Survey – JOLTS – Released 1/4/2023 – The number of job openings was little changed at 10.5 million on the last business day of November, the US Bureau of Labor Statistics reported. Over the month, the number of hires and total separations changed little at 6.1 million and 5.9 million, respectively. Within separations, quits (4.2 million) and layoffs and discharges (1.4 million) changed little.
Employment Cost Index – Released 10/28/2022 – Compensation costs for civilian workers increased 1.2% for the 3-month period ending in September 2022. The 12-month period ending in September 2022 saw compensation costs increase by 5%. The 12-month period ending September 2021 increased 3.7%. Wages and salaries increased 5.1% over the year and increased 4.2% for the 12-month period ending in September 2021. Benefit costs increased 4.9% over the year and increased 2.5% for the 12-month period ending in September 2021. This report is published quarterly.
This Week’s Economic Data
Links take you to the data source
Existing Home Sales – Released 1/20/2023 – Existing home sales decreased in December marking eleven consecutive months of declines. Sales declined 1.5% to a seasonally adjusted rate of 4.02 million in December. Sales decreased 34% year-over-year. Housing inventory sits at 970k units, down 13.4% from November’s inventory, up 10.2% over last year. Unsold inventory sits at a 2.9-month supply. The median existing home price for all housing types was $366,900 which is up 2.3% from December 2021. This marks 130 consecutive months of year-over-year increases, the longest-running streak on record.
Housing Starts – Released 1/19/2023 – New home starts in December were at a seasonally adjusted annual rate of 1.382 million; down 1.4% below November, and 21.8% below last December’s rate. Building Permits were at a seasonally adjusted annual rate of 1.33 million, down 1.6% compared to November, and down 29.9% over last year.
Industrial Production and Capacity Utilization – Released 1/18/2023 – In December, Industrial production decreased 0.7%. Manufacturing decreased 1.3%. Utilities output increased 3.8%. Mining output decreased 0.9%. Total industrial production was 1.6% higher in December than a year ago. Total capacity utilization decreased 0.6% in December to 78.8% which is 0.8% below its long run average.
Retail Sales – Released 1/18/2023 – US retail sales for December decreased 1.1% to $677.1 billion, but retail sales are 6% above December 2021. US retail sales for the October 2022 through December 2022 period were up 6.7% from the same period a year ago.
Producer Price Index – Released 1/18/2023 – The PPI for final demand declined 0.5% in December, seasonally adjusted, the US Bureau of Labor Statistics reported. Final demand prices advanced 0.2% in November and 0.4% in October. On an unadjusted basis, the index for final demand increased 6.2% in 2022 after rising 10% in 2021.
Recent Economic Date
Links take you to the data source
Consumer Price Index – Released 1/12/2023 – Consumer prices decreased 0.1% m/m in December following a 0.1% increase in November. Consumer prices are up 6.5% for the 12-month period ending in December. Core consumer prices increased 0.3% m/m in December.
Consumer Credit – Released 1/9/2023 – In November, consumer credit increased at a seasonally adjusted annual rate of 7.1%. Revolving credit increased at an annual rate of 16.9%, while nonrevolving credit increased at an annual rate of 3.9%.
U.S. Trade Balance – Released 1/5/2023 – The US monthly international trade deficit decreased in November 2022 according to the US Bureau of Economic Analysis and the US Census Bureau. The deficit decreased from $77.8 billion in October (revised) to $61.5 billion in NOvember. November exports were $251.9 billion, $5.1 billion less than October exports. November imports were $313.4 billion, $21.5 billion less than October imports. YEar-to-date, the goods and services deficit increased $120.1 billion, or 15.7%, from the same period in 2021. Exports increased $439.4 billion or 18.9%. Imports increased $559.5 billion or 18.1%.
PMI Non-Manufacturing Index – Released 1/5/2023 – Economic activity entered contraction territory in December ending 30 months of expansion – with the Services PMI® registered 49.6%, 6.9 percentage points lower than November’s reading of 56.5%.
U.S. Construction Spending – Released 1/3/2023 – Construction spending during November 2022 was estimated at a seasonally adjusted annual rate of $1,807.5 billion, 0.2% above the revised October estimate of $1,803.2 billion. The November figure is 8.5% above the NOvember 2021 estimate of $1,665.2 billion. During the first eleven months of this year, construction spending amounted to $1,657.6 billion, 10.5% above the $1,499.8 billion for the same period in 2021.
Chicago PMI – Released 12/30/2022 – Chicago PMI remained in contraction territory but increased in December by 7.7 points to 44.9.
US Light Vehicle Sales – Released 12/23/2022 – US light vehicle sales were at a seasonally adjusted annual rate (SAAR) of 14.134 million units in November.
Personal Income – Released 12/23/2022 – Personal income increased $80.1 billion, or 0.4% in November. Disposable Personal Income increased $68.6 billion or 0.4%. Personal Consumption Expenditure increased $19.8 billion or 0.1%.
Durable Goods – Released 12/23/2022 – New orders for manufactured durable goods in November decreased $5.8 billion or 2.1% to $270.6 billion. Transportation equipment increased up $0.7 billion or 0.8% to $91.8 billion.
New Residential Sales – Released 12/23/2022 – Sales of new single-family homes increased 5.8% to 640k, seasonally adjusted, in November. The median sales price of new homes sold in November was $471,200 with an average sales price of $543,600. At the end of November, the seasonally adjusted estimate of new homes for sale was 461k. This represents a supply of 8.6 months at the current sales rate.
Third Estimate of 3rd Quarter 2022 GDP – Released 12/22/2022 – Real gross domestic product (GDP) increased at an annual rate of 3.2% in the third quarter of 2022 according to the third estimate released by the Bureau of Economic Analysis, in contrast to a decrease of 0.6% in the second quarter. The “third” estimate of GDP released today is based on more complete source data than were available for the “second” estimate issued last month. In the second estimate, the increase in real GDP was 2.9%. The updated estimates primarily reflected upward revisions to consumer spending and nonresidential fixed investment that were partly offset by a downward revision to private inventory investment. The increase in the third quarter primarily reflected increases in exports and consumer spending that were partly offset by a decrease in housing investment.
Consumer Confidence – Released 12/21/2022 – The Conference Board Consumer Confidence Index® increased in December. The Index now stands at 108.3 (1985=100), up from 101.4 in November.
Next week we get data on the 1st estimate of 4th quarter 2022 GDP, New Residential Sales, Durable Goods, and Personal Income.
Data Sources:
Bureau of Economic Analysis (BEA)
Congressional Budget Office (CBO)
U.S. Bureau of Labor Statistics (BLS)
Federal Reserve Economic Data (FRED Charts)
CME Fed Watch
U.S. Treasury – Yields
U.S. Census Bureau
Institute for Supply Management (ISM)
Weekly DOL Employment Data
BLS Monthly Jobs Report
JOLTS
US Energy Admin (EIA)
BLS Consumer Price Index CPI
BLS Producer Price Index PPI
Atlanta Fed GDPNOW
NY Fed Nowcast GDP
US Census Bureau Housing Starts
Consumer Credit
USCB Retail Sales
Construction Spending
Federal Reserve Dot Plots
NY Empire Index
Philadelphia Federal Reserve
P/E Ratio Data -Yardeni Research
Technical Analysis Info:
StockCharts.com – Financial Charts
Exponential vs Simple moving average
Other Links:
1973 Arab Oil Embargo
Hunt Brothers Silver
Long-Term Capital bailout
Categories:
Tags: