New All-Time Highs on a Stinker Jobs Report
Both the Dow and S&P closed at all-time highs on Friday as investors focused on what little positives came out of the jobs report – namely that the report will likely push out the tapering of asset purchases and any potential Fed tightening.
Payroll expectations were for close to a million jobs being created in April but the economy only added 266k nonfarm jobs. Average hourly earnings increased by 21 cents to $30.17. Hiring highlights include +331k Leisure and Hospitality, +48k Government, -79k Professional and Business Services. Economists noted the historic miss in payroll employment did not stem from technical issues such as seasonal adjustment and indicated that outside of leisure and hospitality, hiring all but stalled in April. The US economy still has 8.2M fewer jobs than Feb-20. However, the workweek and wages rose unexpectedly, which more than made up for the miss in hiring. As a result, private income growth appeared to pick up in April from the already strong pace seen last quarter.
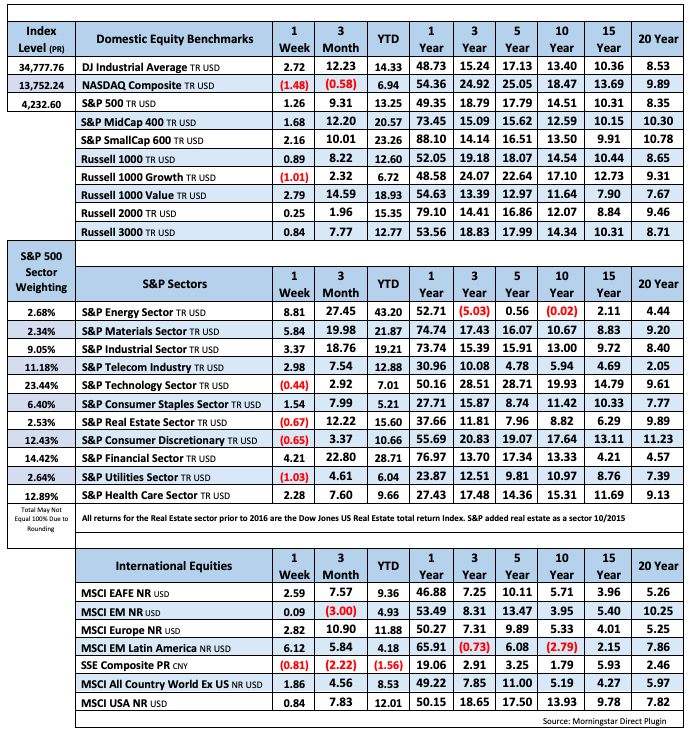
Value trounced growth, outperforming by almost 400bps bringing the YTD outperformance to 1200 bps.
Fixed Income

4/28/21 FOMC Statement FOMC Minutes Credit, Liquidity and Balance Sheet Federal Reserve Dot Plots
US Corporate Debt Tops 7 Trillion. Treasury.gov yields FOMC Policy Normalization Statement Longer Run Goals August 2020
Global Bond Yields
Daily US Treasury Yields
Foreign Exchange Market
Energy Complex
Gasoline setting up for a breakout above $2.20 a gallon.
The Baker Hughes rig count gained 8 this week. There are 448 oil and gas rigs operating in the US – up 74 over last year.
- Brent Crude Oil gained 2.71% this week closing at $68.25/bbl
- WTI Crude Oil gained 2.08% this week to close at $64.90/bbl
- Heating Oil add 4.59% this week closing at $1.011/gallon
- Natural Gas rose 2.44% this week closing at $2.958 per million BTUs
- Unleaded Gas gained 3.55% this week closing at $2.127/gallon
Metals Complex
- Gold lost 0.57% this week closing at $1767.70/oz
- Silver lost 0.77% on the week closing at $25.87/oz
- Palladium gained 3.44% this week closing at $2959.60/oz
- Platinum lost 2.26% this week closing at $1205.20/oz
- Copper gained 3.04% this week closing at $4.47/lb
Employment Picture
April Jobs Report – BLS Summary – Released 5/7/2021 – The US Economy added 266k nonfarm jobs in April and the Unemployment rate was little changed at 6.1%. Average hourly earnings increased by 21 cents to $30.17. Hiring highlights include +331k Leisure and Hospitality, +48k Government, -79k Professional and Business Services.
Economists noted the historic miss in payroll employment did not stem from technical issues such as seasonal adjustment and indicated that outside of leisure and hospitality, hiring all but stalled in April. The US economy still has 8.2M fewer jobs than Feb-20. However, the workweek and wages rose unexpectedly, which more than made up for the miss in hiring. As a result, private income growth appeared to pick up in April from the already strong pace seen last quarter. There were some indications that labor supply is adjusting, however. The labor force participation rate increased, signaling more workers made their services available during the month. Perhaps not surprisingly, the gains were made up largely by young people while older adults continued to stay away. One interpretation of today’s somewhat muddled report is that the economy is going through a short-term imbalance between labor demand and supply as Covid fears, lack of childcare and generous fiscal support serve to delay workers from taking jobs. These impacts may diminish through the year, allowing further recovery in hiring. Input materials are another constraint that may be longer lived. For example, semiconductor shortages continued to weigh on automobile manufacturing in April.
- Average hourly earnings increased by 21 cents to $30.17.
- U3 unemployment rate was little changed at 6.1%. U6 unemployment rate declined to 10.4%.
- The labor force participation rate was little changed at 61.7%.
- Average workweek increased by 0.1 hour to 35.0 hours.
Weekly Unemployment Claims – Released Thursday 5/6/2021 – Initial jobless claims for the week ending May 1st decreased 92k to 498k. The 4-week moving average was 560k, a decrease of 61k. This is the lowest level for this average since 3/14/2020 when the average was 225.5k.
Employment Cost Index – Released 4/30/2021 – Compensation costs for civilian workers increased 0.9% for the 3-month period ending in March 2021. The 12 month period ending on March 2021 saw compensation costs increase by 2.6%. The 12 month period ending March 2020 increased 2.8%. Wages and salaries increased 2.7 percent over the year and increased 3.1 percent for the 12-month period ending in March 2020. Benefit costs increased 2.5 percent over the year and increased 2.1 percent for the 12-month period ending in March 2020. This report is published quarterly.
Job Openings & Labor Turnover Survey JOLTS – Released 4/6/2021 – The U.S. Bureau of Labor Statistics reported the number and rate of job openings increased to 7.4 million on the last business day of February. Over the month, hires increased to 5.7 million and separations were little changed at 5.5 million. Within separations, the quits rate was unchanged at 2.3%. The layoffs and discharges rates were unchanged at 1.2%.
This Week’s Economic Data
Links take you to the data source
Consumer Credit – Released 5/7/2021 – Consumer credit increased at a seasonally adjusted annual rate of 5.1 percent during the first quarter. Revolving credit increased at an annual rate of 2.4 percent, while nonrevolving credit increased at an annual rate of 5.9 percent. In March, consumer credit increased at an annual rate of 7.4 percent
PMI Non-Manufacturing Index – Released 5/5/2021 – Economic activity in the non-manufacturing sector grew in April for the 11th consecutive month. ISM Non-Manufacturing registered 62.7 percent, which is 1.0 percentage point below the adjusted March reading of 63.7 percent.
US Light Vehicle Sales – Released 5/5/2021 – U.S. light-vehicle sales were at a seasonally adjusted annual rate (SAAR) of 18.507 million units in April.
U.S. Trade Balance – Released 5/4/2021 – According to the U.S. Census Bureau of Economic Analysis, the goods and services deficit increased in March by $3.9 billion to $74.4 billion. March exports were $200.0 billion, $12.4 billion more than February exports. March imports were $274.5 billion, $16.4 billion more than February imports. Year to date the goods and services deficit increased $83.2 billion or 64.2%, from the same period in 2020. Year to date exports and imports decreased $21.0 billion or 3.5% and increased $62.2 billion or 8.5% respectively.
PMI Manufacturing Index – Released 5/3/2021 – April PMI declined 4.0% to 60.7% from March’s reading of 64.7%. The New Orders Index was down 3.7% from March’s reading of 68.0% to 64.3%. The Production Index registered 62.5%, down 5.6%.
U.S. Construction Spending – Released 5/3/2021 – Construction spending increased 0.2% in March measuring at a seasonally adjusted annual rate of $1,513.1 billion. The March figure is 5.3% above the March 2020 estimate. Private construction spending was 0.7% above the revised February estimate at $1,160.9 billion. Public construction spending was 1.5% below the revised February estimate at $343.9 billion.
Recent Economic Data
Links take you to the data source
Chicago PMI – Released 4/30/2021 – Chicago PMI increased to 72.1 points in April. This marks ten consecutive months above the 50-mark following a full year under it. Among the main five indicators, order backlogs saw the largest increase, while supplier deliveries saw the largest decline.
Personal Income – Released 4/30/2021 – Personal income increased $4.21 trillion or 21.1 percent in March according to estimates released today by the Bureau of Economic Analysis. Disposable personal income (DPI) increased $4.18 trillion or 23.6 percent and personal consumption expenditures (PCE) increased $616.0 billion or 4.2 percent.
Advance Estimate of 1st Quarter 2021 GDP – Released 4/29/2021 – Real gross domestic product (GDP) increased at an annual rate of 6.4 percent in the first quarter of 2021, according to the advance estimate released by the Bureau of Economic Analysis. The fourth quarter of 2020 saw an increase of 4.3 percent in real GDP. The increase in real GDP in the first quarter reflected increases in personal consumption expenditures (PCE), nonresidential fixed investment, federal government spending, residential fixed investment, and state and local government spending that were partly offset by decreases in private inventory investment and exports. Imports, which are a subtraction in the calculation of GDP, increased.
Consumer Confidence – Released 4/27/2021 – The Consumer confidence index increased 11.7% in April following a sharp increase in March. The Index now shows its highest reading in a year of 121.7, up from 109.0 in March.
Durable Goods – Released 4/26/2021 – New orders for manufactured durable goods in March increased $1.4 billion or 0.5% to $256.3 billion. Fabricated metal products led the increase rising $1.2 billion or 3.6% to $35.4 billion.
New Residential Sales – Released 4/23/2021 – Sales of new single-family homes increased 20.7% to 1,021,000, seasonally adjusted, in March. The median sales price of new homes sold in March was $330,800 with an average sales price of $397,800. At the end of March the seasonally adjusted estimate of new homes for sale was 307k. This represents a supply of 3.6 months at the current sales rate.
Existing Home Sales – Released 4/22/2021 – Existing home sales decreased in March following a decline in February. Sales decreased 3.7% to a seasonally adjusted rate of 6.01 million in March. Sales are currently up 12.3% from one year ago. Housing inventory sits at 1.07 million units. Up 3.9% from February’s inventory. Down 28.2% over last year. Unsold inventory sits at a 2.1 month supply. The median existing home price for all housing types was $329,100.
Housing Starts – Released 4/16/2021 – New home starts in March were at a seasonally adjusted annual rate of 1.739 million; up 19.4% above February and 37.0% above last March’s rate. Building Permits were at a seasonally adjusted annual rate of 1.766 million, up 2.7% compared to February and up 30.2% over last year.
Retail Sales – Released 4/15/2021 – U.S. retail sales for March increased 9.8% to $619.1 billion. U.S. retail sales are up 27.7% year/y.
Industrial Production and Capacity Utilization – Released 4/15/2021 – In March Industrial production increased 1.4%. Manufacturing increased 2.7%. Mining increased 5.7%. Utilities output decreased 11.4%. Total industrial production was up 2.5% at an annual rate for the first quarter of 2021. Total industrial production was 105.6% of its 2012 average which is 1.0% higher in March than a year ago, but still 3.4% below its pre-pandemic level. Total capacity utilization increased 1.0% to 74.4% in March which is 5.2% below its long-run average.
Consumer Price Index – Released 4/13/2021 – The Consumer Price Index increased 0.6% in March. Core CPI, which excludes food and energy was up 0.3%. The monthly changes left total CPI up 2.6% year-over-year and core CPI up 1.6%.
Producer Price Index – Released 4/9/2021 – The Producer Price Index for final demand increased 1.0% in March. PPI less food and energy increased 0.9% in March.
Next week we get data on PPI, CPI, Industrial Production and Capacity Utilization, Retail Sales, and JOLTS.
Data Sources:
Bureau of Economic Analysis (BEA)
Congressional Budget Office (CBO)
U.S. Bureau of Labor Statistics (BLS)
Federal Reserve Economic Data (FRED Charts)
CME Fed Watch
U.S. Treasury – Yields
U.S. Census Bureau
Institute for Supply Management (ISM)
Weekly DOL Employment Data
BLS Monthly Jobs Report
JOLTS
US Energy Admin (EIA)
BLS Consumer Price Index CPI
BLS Producer Price Index PPI
Atlanta Fed GDPNOW
NY Fed Nowcast GDP
US Census Bureau Housing Starts
Consumer Credit
USCB Retail Sales
Construction Spending
Federal Reserve Dot Plots
NY Empire Index
Philadelphia Federal Reserve
P/E Ratio Data -Yardeni Research
Technical Analysis Info:
StockCharts.com – Financial Charts
Exponential vs Simple moving average
Other Links:
1973 Arab Oil Embargo
Hunt Brothers Silver
Long-Term Capital bailout


Week 18 Talking Points
New All-Time Highs on a Stinker Jobs Report
Both the Dow and S&P closed at all-time highs on Friday as investors focused on what little positives came out of the jobs report – namely that the report will likely push out the tapering of asset purchases and any potential Fed tightening.
Payroll expectations were for close to a million jobs being created in April but the economy only added 266k nonfarm jobs. Average hourly earnings increased by 21 cents to $30.17. Hiring highlights include +331k Leisure and Hospitality, +48k Government, -79k Professional and Business Services. Economists noted the historic miss in payroll employment did not stem from technical issues such as seasonal adjustment and indicated that outside of leisure and hospitality, hiring all but stalled in April. The US economy still has 8.2M fewer jobs than Feb-20. However, the workweek and wages rose unexpectedly, which more than made up for the miss in hiring. As a result, private income growth appeared to pick up in April from the already strong pace seen last quarter.
Value trounced growth, outperforming by almost 400bps bringing the YTD outperformance to 1200 bps.
Table of Contents
Fixed Income
4/28/21 FOMC Statement FOMC Minutes Credit, Liquidity and Balance Sheet Federal Reserve Dot Plots
US Corporate Debt Tops 7 Trillion. Treasury.gov yields FOMC Policy Normalization Statement Longer Run Goals August 2020
Global Bond Yields
Daily US Treasury Yields
Foreign Exchange Market
Energy Complex
Gasoline setting up for a breakout above $2.20 a gallon.
The Baker Hughes rig count gained 8 this week. There are 448 oil and gas rigs operating in the US – up 74 over last year.
Metals Complex
Employment Picture
April Jobs Report – BLS Summary – Released 5/7/2021 – The US Economy added 266k nonfarm jobs in April and the Unemployment rate was little changed at 6.1%. Average hourly earnings increased by 21 cents to $30.17. Hiring highlights include +331k Leisure and Hospitality, +48k Government, -79k Professional and Business Services.
Economists noted the historic miss in payroll employment did not stem from technical issues such as seasonal adjustment and indicated that outside of leisure and hospitality, hiring all but stalled in April. The US economy still has 8.2M fewer jobs than Feb-20. However, the workweek and wages rose unexpectedly, which more than made up for the miss in hiring. As a result, private income growth appeared to pick up in April from the already strong pace seen last quarter. There were some indications that labor supply is adjusting, however. The labor force participation rate increased, signaling more workers made their services available during the month. Perhaps not surprisingly, the gains were made up largely by young people while older adults continued to stay away. One interpretation of today’s somewhat muddled report is that the economy is going through a short-term imbalance between labor demand and supply as Covid fears, lack of childcare and generous fiscal support serve to delay workers from taking jobs. These impacts may diminish through the year, allowing further recovery in hiring. Input materials are another constraint that may be longer lived. For example, semiconductor shortages continued to weigh on automobile manufacturing in April.
Weekly Unemployment Claims – Released Thursday 5/6/2021 – Initial jobless claims for the week ending May 1st decreased 92k to 498k. The 4-week moving average was 560k, a decrease of 61k. This is the lowest level for this average since 3/14/2020 when the average was 225.5k.
Employment Cost Index – Released 4/30/2021 – Compensation costs for civilian workers increased 0.9% for the 3-month period ending in March 2021. The 12 month period ending on March 2021 saw compensation costs increase by 2.6%. The 12 month period ending March 2020 increased 2.8%. Wages and salaries increased 2.7 percent over the year and increased 3.1 percent for the 12-month period ending in March 2020. Benefit costs increased 2.5 percent over the year and increased 2.1 percent for the 12-month period ending in March 2020. This report is published quarterly.
Job Openings & Labor Turnover Survey JOLTS – Released 4/6/2021 – The U.S. Bureau of Labor Statistics reported the number and rate of job openings increased to 7.4 million on the last business day of February. Over the month, hires increased to 5.7 million and separations were little changed at 5.5 million. Within separations, the quits rate was unchanged at 2.3%. The layoffs and discharges rates were unchanged at 1.2%.
This Week’s Economic Data
Links take you to the data source
Consumer Credit – Released 5/7/2021 – Consumer credit increased at a seasonally adjusted annual rate of 5.1 percent during the first quarter. Revolving credit increased at an annual rate of 2.4 percent, while nonrevolving credit increased at an annual rate of 5.9 percent. In March, consumer credit increased at an annual rate of 7.4 percent
PMI Non-Manufacturing Index – Released 5/5/2021 – Economic activity in the non-manufacturing sector grew in April for the 11th consecutive month. ISM Non-Manufacturing registered 62.7 percent, which is 1.0 percentage point below the adjusted March reading of 63.7 percent.
US Light Vehicle Sales – Released 5/5/2021 – U.S. light-vehicle sales were at a seasonally adjusted annual rate (SAAR) of 18.507 million units in April.
U.S. Trade Balance – Released 5/4/2021 – According to the U.S. Census Bureau of Economic Analysis, the goods and services deficit increased in March by $3.9 billion to $74.4 billion. March exports were $200.0 billion, $12.4 billion more than February exports. March imports were $274.5 billion, $16.4 billion more than February imports. Year to date the goods and services deficit increased $83.2 billion or 64.2%, from the same period in 2020. Year to date exports and imports decreased $21.0 billion or 3.5% and increased $62.2 billion or 8.5% respectively.
PMI Manufacturing Index – Released 5/3/2021 – April PMI declined 4.0% to 60.7% from March’s reading of 64.7%. The New Orders Index was down 3.7% from March’s reading of 68.0% to 64.3%. The Production Index registered 62.5%, down 5.6%.
U.S. Construction Spending – Released 5/3/2021 – Construction spending increased 0.2% in March measuring at a seasonally adjusted annual rate of $1,513.1 billion. The March figure is 5.3% above the March 2020 estimate. Private construction spending was 0.7% above the revised February estimate at $1,160.9 billion. Public construction spending was 1.5% below the revised February estimate at $343.9 billion.
Recent Economic Data
Links take you to the data source
Chicago PMI – Released 4/30/2021 – Chicago PMI increased to 72.1 points in April. This marks ten consecutive months above the 50-mark following a full year under it. Among the main five indicators, order backlogs saw the largest increase, while supplier deliveries saw the largest decline.
Personal Income – Released 4/30/2021 – Personal income increased $4.21 trillion or 21.1 percent in March according to estimates released today by the Bureau of Economic Analysis. Disposable personal income (DPI) increased $4.18 trillion or 23.6 percent and personal consumption expenditures (PCE) increased $616.0 billion or 4.2 percent.
Advance Estimate of 1st Quarter 2021 GDP – Released 4/29/2021 – Real gross domestic product (GDP) increased at an annual rate of 6.4 percent in the first quarter of 2021, according to the advance estimate released by the Bureau of Economic Analysis. The fourth quarter of 2020 saw an increase of 4.3 percent in real GDP. The increase in real GDP in the first quarter reflected increases in personal consumption expenditures (PCE), nonresidential fixed investment, federal government spending, residential fixed investment, and state and local government spending that were partly offset by decreases in private inventory investment and exports. Imports, which are a subtraction in the calculation of GDP, increased.
Consumer Confidence – Released 4/27/2021 – The Consumer confidence index increased 11.7% in April following a sharp increase in March. The Index now shows its highest reading in a year of 121.7, up from 109.0 in March.
Durable Goods – Released 4/26/2021 – New orders for manufactured durable goods in March increased $1.4 billion or 0.5% to $256.3 billion. Fabricated metal products led the increase rising $1.2 billion or 3.6% to $35.4 billion.
New Residential Sales – Released 4/23/2021 – Sales of new single-family homes increased 20.7% to 1,021,000, seasonally adjusted, in March. The median sales price of new homes sold in March was $330,800 with an average sales price of $397,800. At the end of March the seasonally adjusted estimate of new homes for sale was 307k. This represents a supply of 3.6 months at the current sales rate.
Existing Home Sales – Released 4/22/2021 – Existing home sales decreased in March following a decline in February. Sales decreased 3.7% to a seasonally adjusted rate of 6.01 million in March. Sales are currently up 12.3% from one year ago. Housing inventory sits at 1.07 million units. Up 3.9% from February’s inventory. Down 28.2% over last year. Unsold inventory sits at a 2.1 month supply. The median existing home price for all housing types was $329,100.
Housing Starts – Released 4/16/2021 – New home starts in March were at a seasonally adjusted annual rate of 1.739 million; up 19.4% above February and 37.0% above last March’s rate. Building Permits were at a seasonally adjusted annual rate of 1.766 million, up 2.7% compared to February and up 30.2% over last year.
Retail Sales – Released 4/15/2021 – U.S. retail sales for March increased 9.8% to $619.1 billion. U.S. retail sales are up 27.7% year/y.
Industrial Production and Capacity Utilization – Released 4/15/2021 – In March Industrial production increased 1.4%. Manufacturing increased 2.7%. Mining increased 5.7%. Utilities output decreased 11.4%. Total industrial production was up 2.5% at an annual rate for the first quarter of 2021. Total industrial production was 105.6% of its 2012 average which is 1.0% higher in March than a year ago, but still 3.4% below its pre-pandemic level. Total capacity utilization increased 1.0% to 74.4% in March which is 5.2% below its long-run average.
Consumer Price Index – Released 4/13/2021 – The Consumer Price Index increased 0.6% in March. Core CPI, which excludes food and energy was up 0.3%. The monthly changes left total CPI up 2.6% year-over-year and core CPI up 1.6%.
Producer Price Index – Released 4/9/2021 – The Producer Price Index for final demand increased 1.0% in March. PPI less food and energy increased 0.9% in March.
Next week we get data on PPI, CPI, Industrial Production and Capacity Utilization, Retail Sales, and JOLTS.
Data Sources:
Bureau of Economic Analysis (BEA)
Congressional Budget Office (CBO)
U.S. Bureau of Labor Statistics (BLS)
Federal Reserve Economic Data (FRED Charts)
CME Fed Watch
U.S. Treasury – Yields
U.S. Census Bureau
Institute for Supply Management (ISM)
Weekly DOL Employment Data
BLS Monthly Jobs Report
JOLTS
US Energy Admin (EIA)
BLS Consumer Price Index CPI
BLS Producer Price Index PPI
Atlanta Fed GDPNOW
NY Fed Nowcast GDP
US Census Bureau Housing Starts
Consumer Credit
USCB Retail Sales
Construction Spending
Federal Reserve Dot Plots
NY Empire Index
Philadelphia Federal Reserve
P/E Ratio Data -Yardeni Research
Technical Analysis Info:
StockCharts.com – Financial Charts
Exponential vs Simple moving average
Other Links:
1973 Arab Oil Embargo
Hunt Brothers Silver
Long-Term Capital bailout
Categories:
Tags: