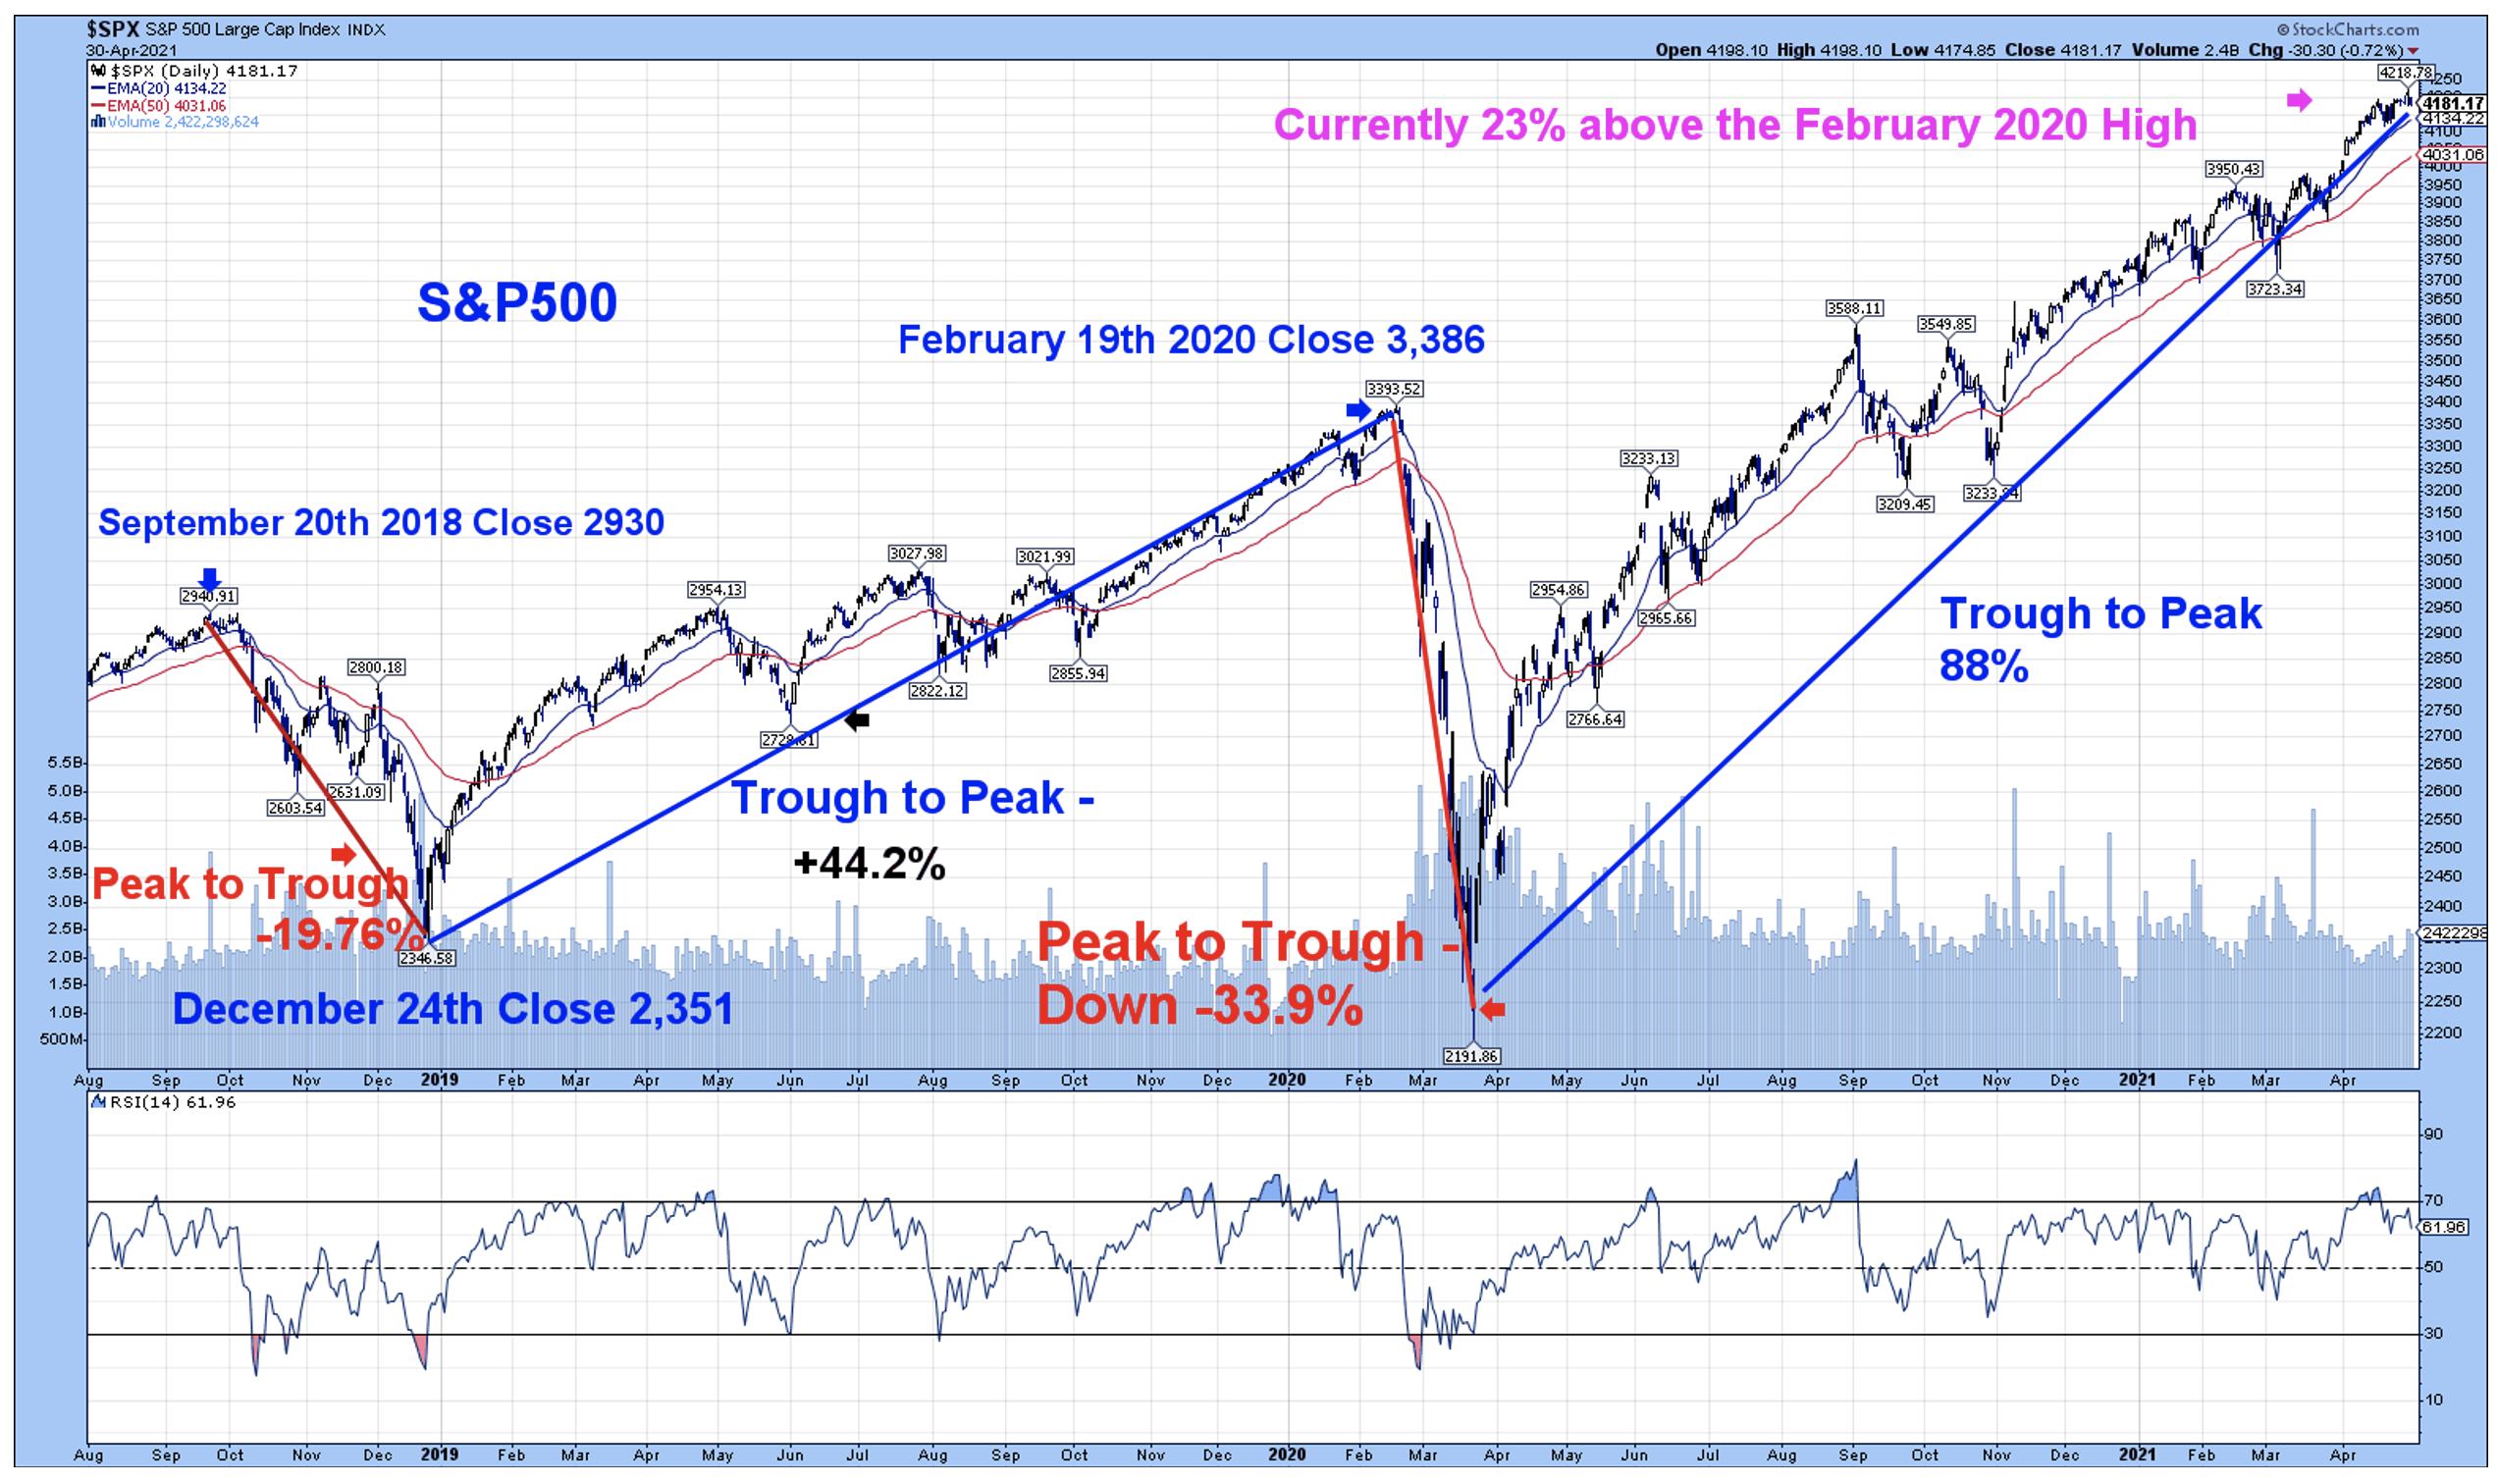
Feeling a Little Toppy
According to Factset, with 60% of the S&P 500 having reported, 86% are above estimates. The blended earnings growth for the S&P 500 is 45.8% Which would be the highest y/y earnings growth rate since Q1 2010 (55.4%) if that number holds. All eleven sectors have higher earnings growth rates or smaller earnings declines today (compared to March 31) due to positive EPS surprises.
All of the big names crushed estimates, Apple, Microsoft, Amazon, Alphabet, Facebook and yes, Tesla all exceeded expectations on strong revenue growth – Fed Chair Powell said it wasn’t time to start talking about tapering asset purchases, reiterating it’ll take substantial further progress until the Fed’s employment and inflation goals are reached. The 1st Q advance GDP number was up at a 6.4% annualized rate
So why were we flat to down for the week?
Is it possible that most of the good news is already baked in? The forward 12-month P/E ratio for the S&P 500 is 22, this is well above the 5 and 10-year average (17.9) (16.0). Things are starting to feel a bit toppy.

Fixed Income
1/27/21 FOMC Statement FOMC Minutes Credit, Liquidity and Balance Sheet Federal Reserve Dot Plots
US Corporate Debt Tops 7 Trillion. Treasury.gov yields FOMC Policy Normalization Statement Longer Run Goals August 2020
Global Bond Yields
Daily US Treasury Yields
Foreign Exchange Market
Energy Complex
The Baker Hughes rig count gained 2 this week. There are 440 oil and gas rigs operating in the US – up 32 over last year.
- Brent Crude Oil gained 0.50% this week closing at $66.45/bbl
- WTI Crude Oil gained 2.32% this week to close at $63.58/bbl
- Heating Oil gained 2.49% this week closing at $1.92/gallon
- Natural Gas gained 4.01% this week closing at $2.93 per million BTUs
- Unleaded Gas gained 3.55% this week closing at $2.08/gallon
Metals Complex
- Gold lost 0.57% this week closing at $1767.70/oz
- Silver lost 0.77% on the week closing at $25.87/oz
- Palladium gained 3.44% this week closing at $2959.60/oz
- Platinum lost 2.26% this week closing at $1205.20/oz
- Copper gained 3.04% this week closing at $4.47/lb
Employment Picture
Employment Cost Index – Released 4/30/2021 – Compensation costs for civilian workers increased 0.9% for the 3-month period ending in March 2021. The 12 month period ending on March 2021 saw compensation costs increase by 2.6%. The 12 month period ending March 2020 increased 2.8%. Wages and salaries increased 2.7 percent over the year and increased 3.1 percent for the 12-month period ending in March 2020. Benefit costs increased 2.5 percent over the year and increased 2.1 percent for the 12-month period ending in March 2020. This report is published quarterly.
Weekly Unemployment Claims – Released Thursday 4/29/2021 – Initial jobless claims for the week ending April 24th decreased 13k to 553k. The 4-week moving average was 612k, a decrease of 44k.
Job Openings & Labor Turnover Survey JOLTS – Released 4/6/2021 – The U.S. Bureau of Labor Statistics reported the number and rate of job openings increased to 7.4 million on the last business day of February. Over the month, hires increased to 5.7 million and separations were little changed at 5.5 million. Within separations, the quits rate was unchanged at 2.3%. The layoffs and discharges rates were unchanged at 1.2%.
March Jobs Report – BLS Summary – Released 4/2/2021 – The US Economy added 916k nonfarm jobs in March and the Unemployment rate declined 0.2% to 6.0%. Average hourly earnings declined by 4 cents to $29.96. Hiring highlights include +280k Leisure and Hospitality, +136k Government, +110k Construction, and +101k Education and Health Services.
- Average hourly earnings declined 4 cents to $29.96.
- U3 unemployment rate declined 0.2% to 6.0%. U6 unemployment rate declined to 10.7%.
- The labor force participation rate was little changed at 61.5%.
Average workweek increased by 0.3 hour to 34.9 hours
This Week’s Economic Data
Links take you to the data source
Chicago PMI – Released 4/30/2021 – Chicago PMI increased to 72.1 points in April. This marks ten consecutive months above the 50-mark following a full year under it. Among the main five indicators, Order backlogs saw the largest increase, while supplier deliveries saw the largest decline.
Personal Income – Released 4/30/2021 – Personal income increased $4.21 trillion or 21.1 percent in March according to estimates released today by the Bureau of Economic Analysis. Disposable personal income (DPI) increased $4.18 trillion or 23.6 percent and personal consumption expenditures (PCE) increased $616.0 billion or 4.2 percent.
Advance Estimate of 1st Quarter 2021 GDP – Released 4/29/2021 – Real gross domestic product (GDP) increased at an annual rate of 6.4 percent in the first quarter of 2021, according to the advance estimate released by the Bureau of Economic Analysis. The fourth quarter of 2020 saw an increase of 4.3 percent in real GDP. The increase in real GDP in the first quarter reflected increases in personal consumption expenditures (PCE), nonresidential fixed investment, federal government spending, residential fixed investment, and state and local government spending that were partly offset by decreases in private inventory investment and exports. Imports, which are a subtraction in the calculation of GDP, increased.
Consumer Confidence – Released 4/27/2021 – The Consumer confidence index increased 11.7% in April following a sharp increase in March. The Index now shows its highest reading in a year of 121.7, up from 109.0 in March.
Durable Goods – Released 4/26/2021 – New orders for manufactured durable goods in March increased $1.4 billion or 0.5% to $256.3 billion. Fabricated metal products led the increase raising $1.2 billion or 3.6% to $35.4 billion.
Recent Economic Data
Links take you to the data source
New Residential Sales – Released 4/23/2021 – Sales of new single-family homes increased 20.7% to 1,021,000, seasonally adjusted, in March. The median sales price of new homes sold in March was $330,800 with an average sales price of $397,800. At the end of March, the seasonally adjusted estimate of new homes for sale was 307k. This represents a supply of 3.6 months at the current sales rate.
Existing Home Sales – Released 4/22/2021 – Existing home sales decreased in March following a decline in February. Sales decreased 3.7% to a seasonally adjusted rate of 6.01 million in March. Sales are currently up 12.3% from one year ago. Housing inventory sits at 1.07 million units. Up 3.9% from February’s inventory. Down 28.2% over last year. Unsold inventory sits at a 2.1 month supply. The median existing home price for all housing types was $329,100.
Housing Starts – Released 4/16/2021 – New home starts in March were at a seasonally adjusted annual rate of 1.739 million; up 19.4% above February and 37.0% above last March’s rate. Building Permits were at a seasonally adjusted annual rate of 1.766 million, up 2.7% compared to February and up 30.2% over last year.
Retail Sales – Released 4/15/2021 – U.S. retail sales for March increased 9.8% to $619.1 billion. U.S. retail sales are up 27.7% year/y.
Industrial Production and Capacity Utilization – Released 4/15/2021 – In March Industrial production increased 1.4%. Manufacturing increased 2.7%. Mining increased 5.7%. Utilities output decreased 11.4%. Total industrial production was up 2.5% at an annual rate for the first quarter of 2021. Total industrial production was 105.6% of its 2012 average which is 1.0% higher in March than a year ago, but still 3.4% below its pre-pandemic level. Total capacity utilization increased 1.0% to 74.4% in March which is 5.2% below its long-run average.
Consumer Price Index – Released 4/13/2021 – The Consumer Price Index increased 0.6% in March. Core CPI, which excludes food and energy was up 0.3%. The monthly changes left total CPI up 2.6% year-over-year and core CPI up 1.6%.
Producer Price Index – Released 4/9/2021 – The Producer Price Index for final demand increased 1.0% in March. PPI less food and energy increased 0.9% in March.
Consumer Credit – Released 4/7/2021 – In February, consumer credit increased at a seasonally adjusted rate of 7.9%. Revolving credit increased at an annual rate of 10.1%, while nonrevolving credit increased at an annual rate of 7.3%. Total Outstanding consumer credit is currently at $4.2058 trillion.
U.S. Trade Balance – Released 4/7/2021 – According to the U.S. Census Bureau of Economic Analysis, the goods and services deficit increased in February by $3.3 billion to $71.1 billion. February exports were $187.3 billion, $5.0 billion less than January exports. February imports were $258.3 billion, $1.7 billion less than January imports. Year over year the goods and services deficit increased $56.5 billion or 68.6%. Year–over–year exports and imports decreased $36.2 billion or 8.7% and increased $20.3 billion or 4.1% respectively.
PMI Non-Manufacturing Index – Released 4/5/2021 – Economic activity in the non-manufacturing sector grew in March for the tenth consecutive month. ISM Non-Manufacturing registered 63.7 percent, which is 8.4 percentage points above the adjusted February reading of 55.3 percent.
US Light Vehicle Sales – Released 4/2/2021 – U.S. light vehicle sales were at a seasonally adjusted annual rate (SAAR) of 17.747 million units in March.
PMI Manufacturing Index – Released 4/1/2021 – March PMI increased 3.9% to 64.7% from February’s reading of 60.8%. The New Orders Index was up 3.2% from February’s reading of 64.8% to 68.0%. The Production Index registered 68.1%, up 4.9%.
U.S. Construction Spending – Released 4/1/2021 – Construction spending declined 0.8% in February measuring at a seasonally adjusted annual rate of $1,516.9 billion. The February figure is 5.3% above the February 2019 estimate. Private construction spending was 0.5% below the revised January estimate at $1,171.6 billion. Public construction spending was 1.7% below the revised January estimate at $357.4 billion.
Next week we get data on U.S. Construction Spending, PMI Manufacturing, PMI Services, U.S. Light Vehicle Sales, U.S. Trade Balance, Consumer Credit, and the April Jobs Report.
Data Sources:
Bureau of Economic Analysis (BEA)
Congressional Budget Office (CBO)
U.S. Bureau of Labor Statistics (BLS)
Federal Reserve Economic Data (FRED Charts)
CME Fed Watch
U.S. Treasury – Yields
U.S. Census Bureau
Institute for Supply Management (ISM)
Weekly DOL Employment Data
BLS Monthly Jobs Report
JOLTS
US Energy Admin (EIA)
BLS Consumer Price Index CPI
BLS Producer Price Index PPI
Atlanta Fed GDPNOW
NY Fed Nowcast GDP
US Census Bureau Housing Starts
Consumer Credit
USCB Retail Sales
Construction Spending
Federal Reserve Dot Plots
NY Empire Index
Philadelphia Federal Reserve
P/E Ratio Data -Yardeni Research
Technical Analysis Info:
StockCharts.com – Financial Charts
Exponential vs Simple moving average
Other Links:
1973 Arab Oil Embargo
Hunt Brothers Silver
Long-Term Capital bailout


Week 17 Talking Points
Feeling a Little Toppy
According to Factset, with 60% of the S&P 500 having reported, 86% are above estimates. The blended earnings growth for the S&P 500 is 45.8% Which would be the highest y/y earnings growth rate since Q1 2010 (55.4%) if that number holds. All eleven sectors have higher earnings growth rates or smaller earnings declines today (compared to March 31) due to positive EPS surprises.
All of the big names crushed estimates, Apple, Microsoft, Amazon, Alphabet, Facebook and yes, Tesla all exceeded expectations on strong revenue growth – Fed Chair Powell said it wasn’t time to start talking about tapering asset purchases, reiterating it’ll take substantial further progress until the Fed’s employment and inflation goals are reached. The 1st Q advance GDP number was up at a 6.4% annualized rate
So why were we flat to down for the week?
Is it possible that most of the good news is already baked in? The forward 12-month P/E ratio for the S&P 500 is 22, this is well above the 5 and 10-year average (17.9) (16.0). Things are starting to feel a bit toppy.
Table of Contents
Fixed Income
1/27/21 FOMC Statement FOMC Minutes Credit, Liquidity and Balance Sheet Federal Reserve Dot Plots
US Corporate Debt Tops 7 Trillion. Treasury.gov yields FOMC Policy Normalization Statement Longer Run Goals August 2020
Global Bond Yields
Daily US Treasury Yields
Foreign Exchange Market
Energy Complex
The Baker Hughes rig count gained 2 this week. There are 440 oil and gas rigs operating in the US – up 32 over last year.
Metals Complex
Employment Picture
Employment Cost Index – Released 4/30/2021 – Compensation costs for civilian workers increased 0.9% for the 3-month period ending in March 2021. The 12 month period ending on March 2021 saw compensation costs increase by 2.6%. The 12 month period ending March 2020 increased 2.8%. Wages and salaries increased 2.7 percent over the year and increased 3.1 percent for the 12-month period ending in March 2020. Benefit costs increased 2.5 percent over the year and increased 2.1 percent for the 12-month period ending in March 2020. This report is published quarterly.
Weekly Unemployment Claims – Released Thursday 4/29/2021 – Initial jobless claims for the week ending April 24th decreased 13k to 553k. The 4-week moving average was 612k, a decrease of 44k.
Job Openings & Labor Turnover Survey JOLTS – Released 4/6/2021 – The U.S. Bureau of Labor Statistics reported the number and rate of job openings increased to 7.4 million on the last business day of February. Over the month, hires increased to 5.7 million and separations were little changed at 5.5 million. Within separations, the quits rate was unchanged at 2.3%. The layoffs and discharges rates were unchanged at 1.2%.
March Jobs Report – BLS Summary – Released 4/2/2021 – The US Economy added 916k nonfarm jobs in March and the Unemployment rate declined 0.2% to 6.0%. Average hourly earnings declined by 4 cents to $29.96. Hiring highlights include +280k Leisure and Hospitality, +136k Government, +110k Construction, and +101k Education and Health Services.
Average workweek increased by 0.3 hour to 34.9 hours
This Week’s Economic Data
Links take you to the data source
Chicago PMI – Released 4/30/2021 – Chicago PMI increased to 72.1 points in April. This marks ten consecutive months above the 50-mark following a full year under it. Among the main five indicators, Order backlogs saw the largest increase, while supplier deliveries saw the largest decline.
Personal Income – Released 4/30/2021 – Personal income increased $4.21 trillion or 21.1 percent in March according to estimates released today by the Bureau of Economic Analysis. Disposable personal income (DPI) increased $4.18 trillion or 23.6 percent and personal consumption expenditures (PCE) increased $616.0 billion or 4.2 percent.
Advance Estimate of 1st Quarter 2021 GDP – Released 4/29/2021 – Real gross domestic product (GDP) increased at an annual rate of 6.4 percent in the first quarter of 2021, according to the advance estimate released by the Bureau of Economic Analysis. The fourth quarter of 2020 saw an increase of 4.3 percent in real GDP. The increase in real GDP in the first quarter reflected increases in personal consumption expenditures (PCE), nonresidential fixed investment, federal government spending, residential fixed investment, and state and local government spending that were partly offset by decreases in private inventory investment and exports. Imports, which are a subtraction in the calculation of GDP, increased.
Consumer Confidence – Released 4/27/2021 – The Consumer confidence index increased 11.7% in April following a sharp increase in March. The Index now shows its highest reading in a year of 121.7, up from 109.0 in March.
Durable Goods – Released 4/26/2021 – New orders for manufactured durable goods in March increased $1.4 billion or 0.5% to $256.3 billion. Fabricated metal products led the increase raising $1.2 billion or 3.6% to $35.4 billion.
Recent Economic Data
Links take you to the data source
New Residential Sales – Released 4/23/2021 – Sales of new single-family homes increased 20.7% to 1,021,000, seasonally adjusted, in March. The median sales price of new homes sold in March was $330,800 with an average sales price of $397,800. At the end of March, the seasonally adjusted estimate of new homes for sale was 307k. This represents a supply of 3.6 months at the current sales rate.
Existing Home Sales – Released 4/22/2021 – Existing home sales decreased in March following a decline in February. Sales decreased 3.7% to a seasonally adjusted rate of 6.01 million in March. Sales are currently up 12.3% from one year ago. Housing inventory sits at 1.07 million units. Up 3.9% from February’s inventory. Down 28.2% over last year. Unsold inventory sits at a 2.1 month supply. The median existing home price for all housing types was $329,100.
Housing Starts – Released 4/16/2021 – New home starts in March were at a seasonally adjusted annual rate of 1.739 million; up 19.4% above February and 37.0% above last March’s rate. Building Permits were at a seasonally adjusted annual rate of 1.766 million, up 2.7% compared to February and up 30.2% over last year.
Retail Sales – Released 4/15/2021 – U.S. retail sales for March increased 9.8% to $619.1 billion. U.S. retail sales are up 27.7% year/y.
Industrial Production and Capacity Utilization – Released 4/15/2021 – In March Industrial production increased 1.4%. Manufacturing increased 2.7%. Mining increased 5.7%. Utilities output decreased 11.4%. Total industrial production was up 2.5% at an annual rate for the first quarter of 2021. Total industrial production was 105.6% of its 2012 average which is 1.0% higher in March than a year ago, but still 3.4% below its pre-pandemic level. Total capacity utilization increased 1.0% to 74.4% in March which is 5.2% below its long-run average.
Consumer Price Index – Released 4/13/2021 – The Consumer Price Index increased 0.6% in March. Core CPI, which excludes food and energy was up 0.3%. The monthly changes left total CPI up 2.6% year-over-year and core CPI up 1.6%.
Producer Price Index – Released 4/9/2021 – The Producer Price Index for final demand increased 1.0% in March. PPI less food and energy increased 0.9% in March.
Consumer Credit – Released 4/7/2021 – In February, consumer credit increased at a seasonally adjusted rate of 7.9%. Revolving credit increased at an annual rate of 10.1%, while nonrevolving credit increased at an annual rate of 7.3%. Total Outstanding consumer credit is currently at $4.2058 trillion.
U.S. Trade Balance – Released 4/7/2021 – According to the U.S. Census Bureau of Economic Analysis, the goods and services deficit increased in February by $3.3 billion to $71.1 billion. February exports were $187.3 billion, $5.0 billion less than January exports. February imports were $258.3 billion, $1.7 billion less than January imports. Year over year the goods and services deficit increased $56.5 billion or 68.6%. Year–over–year exports and imports decreased $36.2 billion or 8.7% and increased $20.3 billion or 4.1% respectively.
PMI Non-Manufacturing Index – Released 4/5/2021 – Economic activity in the non-manufacturing sector grew in March for the tenth consecutive month. ISM Non-Manufacturing registered 63.7 percent, which is 8.4 percentage points above the adjusted February reading of 55.3 percent.
US Light Vehicle Sales – Released 4/2/2021 – U.S. light vehicle sales were at a seasonally adjusted annual rate (SAAR) of 17.747 million units in March.
PMI Manufacturing Index – Released 4/1/2021 – March PMI increased 3.9% to 64.7% from February’s reading of 60.8%. The New Orders Index was up 3.2% from February’s reading of 64.8% to 68.0%. The Production Index registered 68.1%, up 4.9%.
U.S. Construction Spending – Released 4/1/2021 – Construction spending declined 0.8% in February measuring at a seasonally adjusted annual rate of $1,516.9 billion. The February figure is 5.3% above the February 2019 estimate. Private construction spending was 0.5% below the revised January estimate at $1,171.6 billion. Public construction spending was 1.7% below the revised January estimate at $357.4 billion.
Next week we get data on U.S. Construction Spending, PMI Manufacturing, PMI Services, U.S. Light Vehicle Sales, U.S. Trade Balance, Consumer Credit, and the April Jobs Report.
Data Sources:
Bureau of Economic Analysis (BEA)
Congressional Budget Office (CBO)
U.S. Bureau of Labor Statistics (BLS)
Federal Reserve Economic Data (FRED Charts)
CME Fed Watch
U.S. Treasury – Yields
U.S. Census Bureau
Institute for Supply Management (ISM)
Weekly DOL Employment Data
BLS Monthly Jobs Report
JOLTS
US Energy Admin (EIA)
BLS Consumer Price Index CPI
BLS Producer Price Index PPI
Atlanta Fed GDPNOW
NY Fed Nowcast GDP
US Census Bureau Housing Starts
Consumer Credit
USCB Retail Sales
Construction Spending
Federal Reserve Dot Plots
NY Empire Index
Philadelphia Federal Reserve
P/E Ratio Data -Yardeni Research
Technical Analysis Info:
StockCharts.com – Financial Charts
Exponential vs Simple moving average
Other Links:
1973 Arab Oil Embargo
Hunt Brothers Silver
Long-Term Capital bailout
Categories:
Tags: