Good Life Advisors – Talking Points – Week 13
1st Quarter Ends In the Black
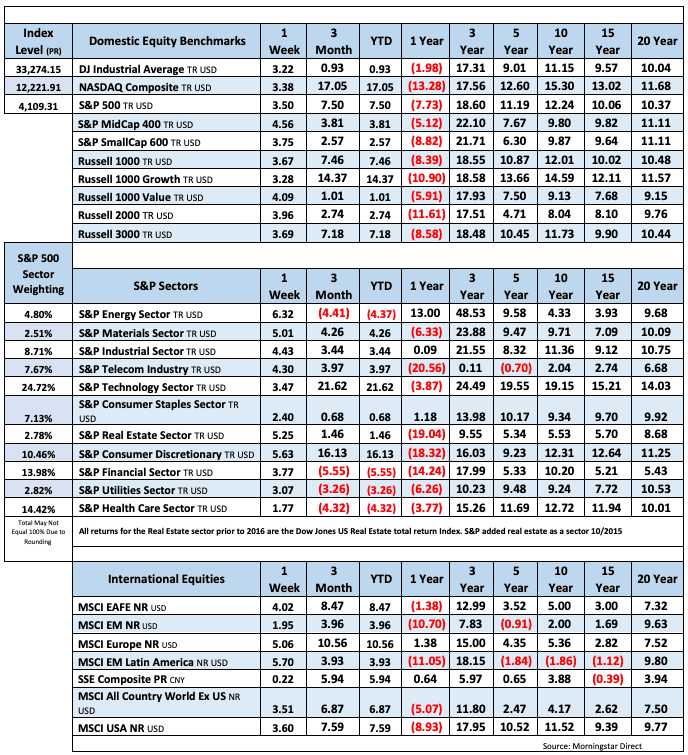
We end the 1st quarter with both equity and fixed income markets up for the year. The S&P 500 gained over 7% in the first three months, while the US bond aggregate rose 3%.
US equities were higher for the week, with the S&P 500 and Nasdaq Composite logging their third straight weekly gain amid a very quiet week of trading and a general calming of headlines from the banking industry. Treasuries were weaker, with the curve flattening. The 2Y yield climbed back above 4%, and the 2/10 spread inversion widened further into negative territory after ending last week above -40bp. The dollar was down overall for the week, dropping on the euro and sterling crosses but faring well vs. the yen; DXY (0.5%). Gold finished up slightly, rising 0.1% and posting its fifth consecutive weekly gain. Oil had a good week, with WTI +9.3% against a backdrop of waning concerns about bank-related pressures, and export disruptions from Iraq.
There was a good deal of Fedspeak this week, but nothing to meaningfully shift the narrative. Most acknowledged the uncertainties stemming from the current banking backdrop and said the Fed needs to be alert; Boston Fed President Collins and Governor Jefferson also both noted the Fed has more work to do on getting inflation back down to the 2% target. On the economic front, March consumer confidence rose a bit on the back of improved expectations, though there was a dip in respondents characterizing jobs as “plentiful.” February pending-home sales rose for the third straight month. And on Friday, February core PCE price growth came in below consensus, and the final UMich March consumer sentiment report showed a dip in year-ahead inflation expectations from the preliminary read.
Beyond those areas, the week was very thin on catalysts, though the market continued to debate the possible paths ahead. Bulls continue to take comfort from the ongoing banking stabilization, some more supportive economic data (including softer February core PCE price inflation), and easing bond-market volatility. Sentiment and positioning dynamics are also being flagged as supportive. But there still remain concerns about another wave of bank-deposit outflows (with eyes on money-market inflows), as well as stretched valuations, worries about the resilience of the consumer, and the disconnect between market expectations for a pivot to rate cuts and a Fed that has stayed closer to the higher-for-longer mantra.
Next week will see a step up in terms of catalysts, particularly on the economic front, with March ISM manufacturing (Monday), February JOLTS (Tuesday), and March ADP employment and ISM services (Wednesday). The March nonfarm employment report will come out next Friday, April 7th, though the market will be closed for Good Friday.
Fixed Income

Yield Curve
January FOMC Statement January Fed Minutes Balance Sheet Reduction Plan Credit, Liquidity and Balance Sheet Federal Reserve Dot Plots
Treasury.gov yields FOMC Policy Normalization Statement Longer- Run Goals Jan 2022
Foreign Exchange Market
Energy Complex
The Baker Hughes rig count was down by 3 this week. There are 755 oil and gas rigs operating in the US – Up 82 over last year.
Metals Complex
Employment Picture
Weekly Unemployment Claims – Released Thursday 3/30/2023 – The week ending March 25th observed a increase of 7k in initial claims increasing to 198k. The four-week moving average of initial jobless claims was up by 2k to 198.25k.
February Jobs Report – BLS Summary – Released 3/10/2023 – The US Economy added 311k nonfarm jobs in February and the Unemployment rate increased 0.2% to 3.6%. Average hourly earnings increased 8 cents to $33.09. Hiring highlights include +105k Leisure and Hospitality, +74k Education and Health Services, +50k Retail Trade, +46 Government, and +45k Professional and Business Services.
- Average hourly earnings increased 8 cents/0.2% to $33.09.
- U3 unemployment rate increased 0.2% to 3.6%. U6 unemployment rate increased 0.2% to 6.8%.
- The labor force participation rate was little changed at 62.5%.
- Average work week decreased by 0.1 to 34.5 hours.
Job Openings & Labor Turnover Survey JOLTS – Released 3/8/2023 – The number of job openings decreased to 10.8 million on the last business day of January, the U.S. Bureau of Labor Statistics reported. Over the month, the number of hires and total separations changed little at 6.4 million and 5.9 million, respectively. Within separations, quits (3.9 million) and layoffs and discharges (1.7 million) increased.
Employment Cost Index – Released 1/31/2023 – Compensation costs for civilian workers increased 1.0% for the 3-month period ending in December 2022. The 12-month period ending on December 2022 saw compensation costs increase by 5.1%. The 12-month period ending December 2021 increased 4.0%. Wages and salaries increased 5.1 percent over the year and increased 4.5 percent for the 12-month period ending in December 2021. Benefit costs increased 4.9 percent over the year and increased 2.8 percent for the 12-month period ending in December 2021. This report is published quarterly.
This Week’s Economic Data
Links take you to the data source
Chicago PMI – Released 3/31/2023 – Chicago PMI remained in contraction territory but increased in March to 43.8 points up from 43.6 points in February. This marks seven months in contractionary territory.
Personal Income – Released 3/31/2023 – Personal income increased $72.9 billion, or 0.3 percent in February. Disposable Personal Income increased $89.9 billion or 0.5 percent. Personal Consumption Expenditure increased $27.9 billion or 10.2 percent.
Third Estimate of 4th Quarter 2022 GDP – Released 3/30/2023 – Real gross domestic product (GDP) increased at an annual rate of 2.6 percent in the fourth quarter of 2022 according to the third estimate released by the Bureau of Economic Analysis, following an increase of 3.2 percent in the third quarter of 2022. The second estimate saw real GDP increase 2.7% and the advance estimate saw real GDP increase by 2.9%. The GDP estimate released today is based on source data that are more complete than the advance and second estimate. The increase in real GDP reflected increases in private inventory investment, consumer spending, federal government spending, state and local government spending, and nonresidential fixed investment that were partly offset by decreases in residential fixed investment and exports. Imports, which are a subtraction in the calculation of GDP, decreased. The revision primarily reflected downward revisions to exports and consumer spending. Imports, which are a subtraction in the calculation of GDP, were revised down.
Consumer Confidence – Released 3/28/2023 – The Conference Board Consumer Confidence Index® increased in March. The Index now stands at 104.2 (1985=100), up from 103.4 in February.
Recent Economic Date
Links take you to the data source
Durable Goods – Released 3/24/2023 – New orders for manufactured durable goods in February decreased $2.6 billion or 1.0% to $268.4 billion. Transportation equipment led the decrease down $2.6 billion or 2.8% to $89.4 billion.
New Residential Sales – Released 3/23/2023 – Sales of new single-family homes increased 1.1% to 640k, seasonally adjusted, in February. The median sales price of new homes sold in February was $438,200 with an average sales price of $498,700. At the end of February, the seasonally adjusted estimate of new homes for sale was 436k. This represents a supply of 8.2 months at the current sales rate.
Existing Home Sales – Released 3/21/2023 – Existing home sales increased in February following twelve consecutive months of declines. Sales increased 14.5% to a seasonally adjusted rate of 4.58 million in February. Sales decreased 22.6% year-over-year. Housing inventory sits at 980k units. Identical to January’s inventory. Up 15.3% over last year. Unsold inventory sits at a 2.6-month supply. The median existing home price for all housing types was $363,000 which is down 0.2% from February 2022. February ended 131 consecutive months of year-over-year increases, the longest-running streak on record.
Industrial Production and Capacity Utilization – Released 3/17/2023 – In February Industrial production was unchanged. Manufacturing increased 0.1%. Utilities output increased 0.5%. Mining output declined 0.6%. Total industrial production was 0.2% lower in February than a year ago. Total capacity utilization was unchanged in February at 78.0% which is 1.6% below its long run average.
Housing Starts – Released 3/16/2023 – New home starts in February were at a seasonally adjusted annual rate of 1.450 million; up 9.8% above January, but 18.4% below last February’s rate. Building Permits were at a seasonally adjusted annual rate of 1.524 million, up 13.8% compared to January, but down 17.9% over last year.
Producer Price Index – Released 3/15/2023 – The PPI for final demand decreased 0.1 percent in February, seasonally adjusted, the U.S. Bureau of Labor Statistics reported. Final demand prices increased 0.3 percent in January but decreased 0.2 percent in December. On an unadjusted basis, the index for final demand increased 4.6 percent year over year.
Retail Sales – Released 3/15/2023 – U.S. retail sales for February decreased 0.4% to $697.9 billion but retail sales are 5.4% above February 2022. U.S. retail sales for the December 2022 through February 2023 period were up 6.4% from the same period a year ago.
Consumer Price Index – Released 3/14/2023 – Consumer prices increased 0.4% m/m in February following a 0.5% increase in January. Consumer prices are up 6.0% for the 12-month period ending in February. Core consumer prices increased 0.5% m/m in February.
U.S. Trade Balance – Released 3/8/2023 – The U.S. monthly international trade deficit increased in January 2023 according to the U.S. Bureau of Economic Analysis and the U.S. Census Bureau. The deficit increased from $67.2 billion in December (revised) to $68.3 billion in January. January exports were $257.5 billion, $8.5 billion more than December exports. January imports were $325.8 billion, $9.6 billion more than December imports. Year-over-year, the goods and services deficit decreased $19.2 billion, or 21.9 percent, from January 2022. Exports increased $30.2 billion or 13.3 percent. Imports increased $11.0 billion or 3.5 percent.
Consumer Credit – Released 3/7/2023 – In January, consumer credit increased at a seasonally adjusted annual rate of 3.7 percent. Revolving credit increased at an annual rate of 11.1 percent, while nonrevolving credit increased at an annual rate of 1.2 percent.
US Light Vehicle Sales – Released 3/3/2023 – U.S. light vehicle sales were at a seasonally adjusted annual rate (SAAR) of 14.886 million units in February.
PMI Non-Manufacturing Index – Released 3/3/2023 – Economic activity fell in February. The Services PMI® registered 55.1 percent, 0.1 percentage points lower than January. In January the Services PMI® registered 55.2 percent.
PMI Manufacturing Index – Released 3/1/2023 – The February Manufacturing PMI® registered 47.7 percent, 0.3 percentage point higher than the 47.4 percent recorded in January. Regarding the overall economy, this figure indicates three months of contraction following 30 months of expansion. The New Orders Index remained in contraction territory at 47.0 percent, 4.5 percentage points higher than the 42.5 percent recorded in January. The production index declined 0.7 percentage points to 47.3.
U.S. Construction Spending – Released 3/1/2023 – Construction spending during January 2023 was estimated at a seasonally adjusted annual rate of $1,825.7 billion, 0.1 percent below the revised December estimate of $1,827.5 billion. The January figure is 5.7 percent above the January 2022 estimate of $1,726.6 billion.
Next week we get data on U.S. Construction Spending, Manufacturing PMI, Services PMI, Consumer Credit, U.S. Trade Balance, JOLTS, and the March Jobs Report.
Data Sources:
Bureau of Economic Analysis (BEA)
Congressional Budget Office (CBO)
U.S. Bureau of Labor Statistics (BLS)
Federal Reserve Economic Data (FRED Charts)
CME Fed Watch
U.S. Treasury – Yields
U.S. Census Bureau
Institute for Supply Management (ISM)
Weekly DOL Employment Data
BLS Monthly Jobs Report
JOLTS
US Energy Admin (EIA)
BLS Consumer Price Index CPI
BLS Producer Price Index PPI
Atlanta Fed GDPNOW
NY Fed Nowcast GDP
US Census Bureau Housing Starts
Consumer Credit
USCB Retail Sales
Construction Spending
Federal Reserve Dot Plots
NY Empire Index
Philadelphia Federal Reserve
P/E Ratio Data -Yardeni Research
Technical Analysis Info:
StockCharts.com – Financial Charts
Exponential vs Simple moving average
Other Links:
1973 Arab Oil Embargo
Hunt Brothers Silver
Long-Term Capital bailout


Week 13 Talking Points
Table of Contents
Good Life Advisors – Talking Points – Week 13
1st Quarter Ends In the Black
We end the 1st quarter with both equity and fixed income markets up for the year. The S&P 500 gained over 7% in the first three months, while the US bond aggregate rose 3%.
US equities were higher for the week, with the S&P 500 and Nasdaq Composite logging their third straight weekly gain amid a very quiet week of trading and a general calming of headlines from the banking industry. Treasuries were weaker, with the curve flattening. The 2Y yield climbed back above 4%, and the 2/10 spread inversion widened further into negative territory after ending last week above -40bp. The dollar was down overall for the week, dropping on the euro and sterling crosses but faring well vs. the yen; DXY (0.5%). Gold finished up slightly, rising 0.1% and posting its fifth consecutive weekly gain. Oil had a good week, with WTI +9.3% against a backdrop of waning concerns about bank-related pressures, and export disruptions from Iraq.
There was a good deal of Fedspeak this week, but nothing to meaningfully shift the narrative. Most acknowledged the uncertainties stemming from the current banking backdrop and said the Fed needs to be alert; Boston Fed President Collins and Governor Jefferson also both noted the Fed has more work to do on getting inflation back down to the 2% target. On the economic front, March consumer confidence rose a bit on the back of improved expectations, though there was a dip in respondents characterizing jobs as “plentiful.” February pending-home sales rose for the third straight month. And on Friday, February core PCE price growth came in below consensus, and the final UMich March consumer sentiment report showed a dip in year-ahead inflation expectations from the preliminary read.
Beyond those areas, the week was very thin on catalysts, though the market continued to debate the possible paths ahead. Bulls continue to take comfort from the ongoing banking stabilization, some more supportive economic data (including softer February core PCE price inflation), and easing bond-market volatility. Sentiment and positioning dynamics are also being flagged as supportive. But there still remain concerns about another wave of bank-deposit outflows (with eyes on money-market inflows), as well as stretched valuations, worries about the resilience of the consumer, and the disconnect between market expectations for a pivot to rate cuts and a Fed that has stayed closer to the higher-for-longer mantra.
Next week will see a step up in terms of catalysts, particularly on the economic front, with March ISM manufacturing (Monday), February JOLTS (Tuesday), and March ADP employment and ISM services (Wednesday). The March nonfarm employment report will come out next Friday, April 7th, though the market will be closed for Good Friday.
Fixed Income
Yield Curve
January FOMC Statement January Fed Minutes Balance Sheet Reduction Plan Credit, Liquidity and Balance Sheet Federal Reserve Dot Plots
Treasury.gov yields FOMC Policy Normalization Statement Longer- Run Goals Jan 2022
Foreign Exchange Market
Energy Complex
The Baker Hughes rig count was down by 3 this week. There are 755 oil and gas rigs operating in the US – Up 82 over last year.
Metals Complex
Employment Picture
Weekly Unemployment Claims – Released Thursday 3/30/2023 – The week ending March 25th observed a increase of 7k in initial claims increasing to 198k. The four-week moving average of initial jobless claims was up by 2k to 198.25k.
February Jobs Report – BLS Summary – Released 3/10/2023 – The US Economy added 311k nonfarm jobs in February and the Unemployment rate increased 0.2% to 3.6%. Average hourly earnings increased 8 cents to $33.09. Hiring highlights include +105k Leisure and Hospitality, +74k Education and Health Services, +50k Retail Trade, +46 Government, and +45k Professional and Business Services.
Job Openings & Labor Turnover Survey JOLTS – Released 3/8/2023 – The number of job openings decreased to 10.8 million on the last business day of January, the U.S. Bureau of Labor Statistics reported. Over the month, the number of hires and total separations changed little at 6.4 million and 5.9 million, respectively. Within separations, quits (3.9 million) and layoffs and discharges (1.7 million) increased.
Employment Cost Index – Released 1/31/2023 – Compensation costs for civilian workers increased 1.0% for the 3-month period ending in December 2022. The 12-month period ending on December 2022 saw compensation costs increase by 5.1%. The 12-month period ending December 2021 increased 4.0%. Wages and salaries increased 5.1 percent over the year and increased 4.5 percent for the 12-month period ending in December 2021. Benefit costs increased 4.9 percent over the year and increased 2.8 percent for the 12-month period ending in December 2021. This report is published quarterly.
This Week’s Economic Data
Links take you to the data source
Chicago PMI – Released 3/31/2023 – Chicago PMI remained in contraction territory but increased in March to 43.8 points up from 43.6 points in February. This marks seven months in contractionary territory.
Personal Income – Released 3/31/2023 – Personal income increased $72.9 billion, or 0.3 percent in February. Disposable Personal Income increased $89.9 billion or 0.5 percent. Personal Consumption Expenditure increased $27.9 billion or 10.2 percent.
Third Estimate of 4th Quarter 2022 GDP – Released 3/30/2023 – Real gross domestic product (GDP) increased at an annual rate of 2.6 percent in the fourth quarter of 2022 according to the third estimate released by the Bureau of Economic Analysis, following an increase of 3.2 percent in the third quarter of 2022. The second estimate saw real GDP increase 2.7% and the advance estimate saw real GDP increase by 2.9%. The GDP estimate released today is based on source data that are more complete than the advance and second estimate. The increase in real GDP reflected increases in private inventory investment, consumer spending, federal government spending, state and local government spending, and nonresidential fixed investment that were partly offset by decreases in residential fixed investment and exports. Imports, which are a subtraction in the calculation of GDP, decreased. The revision primarily reflected downward revisions to exports and consumer spending. Imports, which are a subtraction in the calculation of GDP, were revised down.
Consumer Confidence – Released 3/28/2023 – The Conference Board Consumer Confidence Index® increased in March. The Index now stands at 104.2 (1985=100), up from 103.4 in February.
Recent Economic Date
Links take you to the data source
Durable Goods – Released 3/24/2023 – New orders for manufactured durable goods in February decreased $2.6 billion or 1.0% to $268.4 billion. Transportation equipment led the decrease down $2.6 billion or 2.8% to $89.4 billion.
New Residential Sales – Released 3/23/2023 – Sales of new single-family homes increased 1.1% to 640k, seasonally adjusted, in February. The median sales price of new homes sold in February was $438,200 with an average sales price of $498,700. At the end of February, the seasonally adjusted estimate of new homes for sale was 436k. This represents a supply of 8.2 months at the current sales rate.
Existing Home Sales – Released 3/21/2023 – Existing home sales increased in February following twelve consecutive months of declines. Sales increased 14.5% to a seasonally adjusted rate of 4.58 million in February. Sales decreased 22.6% year-over-year. Housing inventory sits at 980k units. Identical to January’s inventory. Up 15.3% over last year. Unsold inventory sits at a 2.6-month supply. The median existing home price for all housing types was $363,000 which is down 0.2% from February 2022. February ended 131 consecutive months of year-over-year increases, the longest-running streak on record.
Industrial Production and Capacity Utilization – Released 3/17/2023 – In February Industrial production was unchanged. Manufacturing increased 0.1%. Utilities output increased 0.5%. Mining output declined 0.6%. Total industrial production was 0.2% lower in February than a year ago. Total capacity utilization was unchanged in February at 78.0% which is 1.6% below its long run average.
Housing Starts – Released 3/16/2023 – New home starts in February were at a seasonally adjusted annual rate of 1.450 million; up 9.8% above January, but 18.4% below last February’s rate. Building Permits were at a seasonally adjusted annual rate of 1.524 million, up 13.8% compared to January, but down 17.9% over last year.
Producer Price Index – Released 3/15/2023 – The PPI for final demand decreased 0.1 percent in February, seasonally adjusted, the U.S. Bureau of Labor Statistics reported. Final demand prices increased 0.3 percent in January but decreased 0.2 percent in December. On an unadjusted basis, the index for final demand increased 4.6 percent year over year.
Retail Sales – Released 3/15/2023 – U.S. retail sales for February decreased 0.4% to $697.9 billion but retail sales are 5.4% above February 2022. U.S. retail sales for the December 2022 through February 2023 period were up 6.4% from the same period a year ago.
Consumer Price Index – Released 3/14/2023 – Consumer prices increased 0.4% m/m in February following a 0.5% increase in January. Consumer prices are up 6.0% for the 12-month period ending in February. Core consumer prices increased 0.5% m/m in February.
U.S. Trade Balance – Released 3/8/2023 – The U.S. monthly international trade deficit increased in January 2023 according to the U.S. Bureau of Economic Analysis and the U.S. Census Bureau. The deficit increased from $67.2 billion in December (revised) to $68.3 billion in January. January exports were $257.5 billion, $8.5 billion more than December exports. January imports were $325.8 billion, $9.6 billion more than December imports. Year-over-year, the goods and services deficit decreased $19.2 billion, or 21.9 percent, from January 2022. Exports increased $30.2 billion or 13.3 percent. Imports increased $11.0 billion or 3.5 percent.
Consumer Credit – Released 3/7/2023 – In January, consumer credit increased at a seasonally adjusted annual rate of 3.7 percent. Revolving credit increased at an annual rate of 11.1 percent, while nonrevolving credit increased at an annual rate of 1.2 percent.
US Light Vehicle Sales – Released 3/3/2023 – U.S. light vehicle sales were at a seasonally adjusted annual rate (SAAR) of 14.886 million units in February.
PMI Non-Manufacturing Index – Released 3/3/2023 – Economic activity fell in February. The Services PMI® registered 55.1 percent, 0.1 percentage points lower than January. In January the Services PMI® registered 55.2 percent.
PMI Manufacturing Index – Released 3/1/2023 – The February Manufacturing PMI® registered 47.7 percent, 0.3 percentage point higher than the 47.4 percent recorded in January. Regarding the overall economy, this figure indicates three months of contraction following 30 months of expansion. The New Orders Index remained in contraction territory at 47.0 percent, 4.5 percentage points higher than the 42.5 percent recorded in January. The production index declined 0.7 percentage points to 47.3.
U.S. Construction Spending – Released 3/1/2023 – Construction spending during January 2023 was estimated at a seasonally adjusted annual rate of $1,825.7 billion, 0.1 percent below the revised December estimate of $1,827.5 billion. The January figure is 5.7 percent above the January 2022 estimate of $1,726.6 billion.
Next week we get data on U.S. Construction Spending, Manufacturing PMI, Services PMI, Consumer Credit, U.S. Trade Balance, JOLTS, and the March Jobs Report.
Data Sources:
Bureau of Economic Analysis (BEA)
Congressional Budget Office (CBO)
U.S. Bureau of Labor Statistics (BLS)
Federal Reserve Economic Data (FRED Charts)
CME Fed Watch
U.S. Treasury – Yields
U.S. Census Bureau
Institute for Supply Management (ISM)
Weekly DOL Employment Data
BLS Monthly Jobs Report
JOLTS
US Energy Admin (EIA)
BLS Consumer Price Index CPI
BLS Producer Price Index PPI
Atlanta Fed GDPNOW
NY Fed Nowcast GDP
US Census Bureau Housing Starts
Consumer Credit
USCB Retail Sales
Construction Spending
Federal Reserve Dot Plots
NY Empire Index
Philadelphia Federal Reserve
P/E Ratio Data -Yardeni Research
Technical Analysis Info:
StockCharts.com – Financial Charts
Exponential vs Simple moving average
Other Links:
1973 Arab Oil Embargo
Hunt Brothers Silver
Long-Term Capital bailout
Categories:
Tags: