Good Life Advisors – Talking Points – Week 14
US equities were mostly lower for the week, with the S&P and Nasdaq finishing somewhat lower after three weeks of gains. Treasuries were firmer with the curve steepening. The 2Y yield touched a low of 3.68% before finishing above 3.80% amid persistent expectations that the Fed may need to begin cutting rates in H2. The dollar notched its fourth consecutive weekly drop and its fifth in the past six weeks; DXY (0.6%). Gold was higher for the sixth consecutive week, crossing above $2000/oz and even nearing a record high on Tuesday before pulling back. Oil added to last week’s gains after OPEC+ announced a surprise output cut last weekend. WTI crude rose 6.6% but did not rise much above the $80/barrel mark, which has been a soft ceiling since November 2022.
Growth concerns moved back to the forefront of the market’s mind during the holiday-shortened week amid a steady stream of weaker-than-expected economic reports. While these firmed expectations for the Fed to pause its rate hikes at the 3-May FOMC meeting, at the same time, they provided additional fuel for hard-landing/recessionary concerns. And given some Fedspeak pushing back against pivot expectations and reiterating its higher-for-longer mantra, a “bad news is bad” mood took some hold of the mindset this week. There were also some early signs of weaker loan demand and tighter credit terms that did nothing to help the shift in atmosphere.
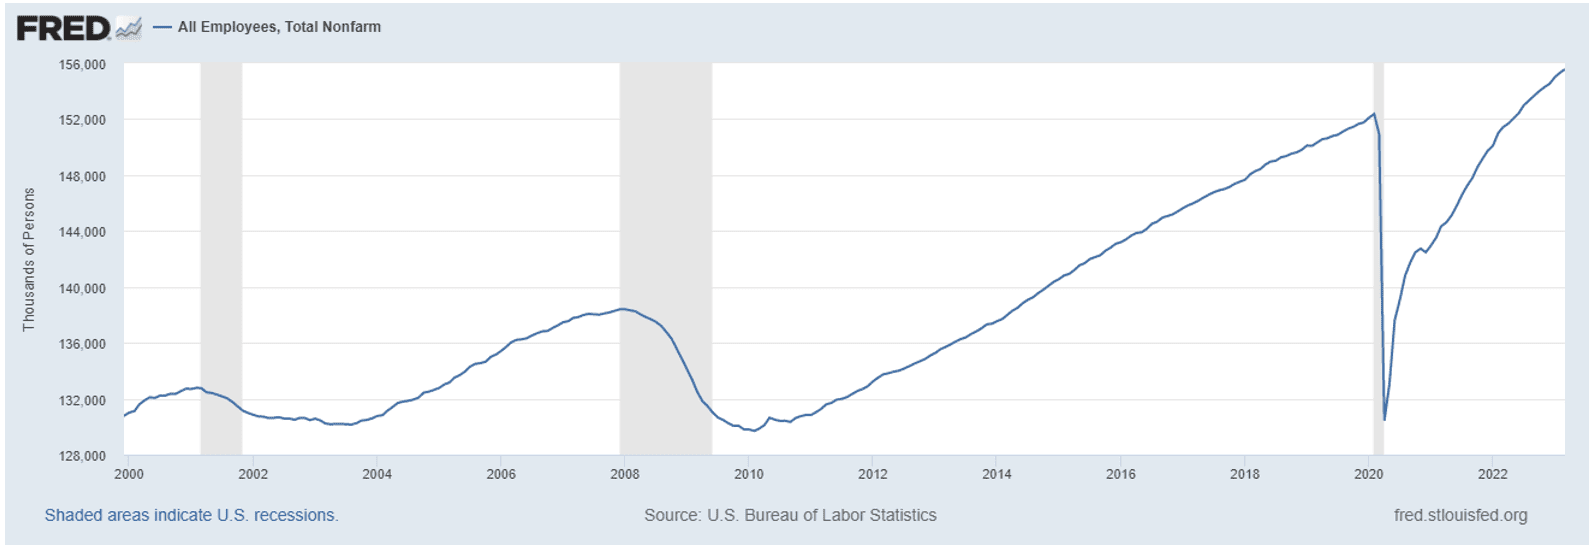
All that said, there were also advocates for a more bullish view this week. Bank-crisis headlines appear to have stabilized, and there has as yet been no indication of further threats to the system. The labor market, while slowing, remains healthy (and this is a key input for the soft-landing thesis). March nonfarm payrolls report showed the US economy added 236k jobs in March.
The total number of employed persons in the US exceeds pre-covid highs.
While the labor force participation rate is back to 2018 highs.

Fixed Income
Yield Curve
January FOMC Statement January Fed Minutes Balance Sheet Reduction Plan Credit, Liquidity and Balance Sheet Federal Reserve Dot Plots
Treasury.gov yields FOMC Policy Normalization Statement Longer- Run Goals Jan 2022
Foreign Exchange Market
Energy Complex
The Baker Hughes rig count was down by 4 this week. There are 751 oil and gas rigs operating in the US – Up 62 over last year.
Metals Complex
Employment Picture
March Jobs Report – BLS Summary – Released 4/7/2023 – The US Economy added 236k nonfarm jobs in March and the Unemployment rate was little changed at 3.5%. Average hourly earnings increased 9 cents to $33.18. Hiring highlights include +72k Leisure and Hospitality, +65k Education and Health Services, +47 Government, and +39k Professional and Business Services.
- Average hourly earnings increased 9 cents/0.3% to $33.18.
- U3 unemployment rate was little changed at 3.5%. U6 unemployment rate decreased 0.1% to 6.7%.
- The labor force participation rate was little changed at 62.6%.
- Average work week decreased by 0.1 to 34.4 hours.
Weekly Unemployment Claims – Released Thursday 4/6/2023 – The week ending April 1st observed a decrease of 18k in initial claims decreasing to 228k. The four-week moving average of initial jobless claims was up by 4.25k to 237.75k.
Job Openings & Labor Turnover Survey JOLTS – Released 4/4/2023 – The number of job openings decreased to 9.9 million on the last business day of February, the U.S. Bureau of Labor Statistics reported. Over the month the number of hires and total separations changed little at 6.2 million and 5.8 million, respectively. Within separations, quits (4.0 million) increased and layoffs and discharges (1.5 million) decreased.
Employment Cost Index – Released 1/31/2023 – Compensation costs for civilian workers increased 1.0% for the 3-month period ending in December 2022. The 12-month period ending on December 2022 saw compensation costs increase by 5.1%. The 12-month period ending December 2021 increased 4.0%. Wages and salaries increased 5.1 percent over the year and increased 4.5 percent for the 12-month period ending in December 2021. Benefit costs increased 4.9 percent over the year and increased 2.8 percent for the 12-month period ending in December 2021. This report is published quarterly.
This Week’s Economic Data
Links take you to the data source
Consumer Credit – Released 4/7/2023 – In February, consumer credit increased at a seasonally adjusted annual rate of 3.8 percent. Revolving credit increased at an annual rate of 5.0 percent, while nonrevolving credit increased at an annual rate of 3.4 percent.
U.S. Trade Balance – Released 4/5/2023 – The U.S. monthly international trade deficit increased in February 2023 according to the U.S. Bureau of Economic Analysis and the U.S. Census Bureau. The deficit increased from $68.7 billion in January (revised) to $70.5 billion in February. February exports were $251.2 billion, $6.9 billion less than January exports. February imports were $321.7 billion, $5.0 billion less than January imports. Year-to-date, the goods and services deficit decreased $35.5 billion, or 20.3 percent, from the same period in 2022. Exports increased $49.5 billion or 10.8 percent. Imports increased $14.0 billion or 2.2 percent.
PMI Non-Manufacturing Index – Released 4/5/2023 – Economic activity remained in expansionary territory in March. The Services PMI® registered 51.2 percent, 3.9 percentage points lower than February. In February, the Services PMI® registered 55.1 percent.
PMI Manufacturing Index – Released 4/3/2023 – The March Manufacturing PMI® registered 46.3 percent, 1.4 percentage point lower than the 47.7 percent recorded in February. Regarding the overall economy, this figure indicates four months of contraction following 30 months of expansion. The New Orders Index remained in contraction territory at 44.3 percent, 2.7 percentage points lower than the 47.0 percent recorded in February. The production index increased 0.5 percentage points to 47.8.
U.S. Construction Spending – Released 4/3/2023 – Construction spending during February 2023 was estimated at a seasonally adjusted annual rate of $1,844.4 billion, 0.1 percent below the revised January estimate of $1,845.4 billion. The February figure is 5.2 percent above the February 2022 estimate of $1,753.1 billion.
Recent Economic Date
Links take you to the data source
US Light Vehicle Sales – Released 3/31/2023 – U.S. light vehicle sales were at a seasonally adjusted annual rate (SAAR) of 14.896 million units in February.
Chicago PMI – Released 3/31/2023 – Chicago PMI remained in contraction territory but increased in March to 43.8 points up from 43.6 points in February. This marks seven months in contractionary territory.
Personal Income – Released 3/31/2023 – Personal income increased $72.9 billion, or 0.3 percent in February. Disposable Personal Income increased $89.9 billion or 0.5 percent. Personal Consumption Expenditure increased $27.9 billion or 10.2 percent.
Third Estimate of 4th Quarter 2022 GDP – Released 3/30/2023 – Real gross domestic product (GDP) increased at an annual rate of 2.6 percent in the fourth quarter of 2022 according to the third estimate released by the Bureau of Economic Analysis, following an increase of 3.2 percent in the third quarter of 2022. The second estimate saw real GDP increase 2.7% and the advance estimate saw real GDP increase by 2.9%.The GDP estimate released today is based on source data that are more complete than the advance and second estimate. The increase in real GDP reflected increases in private inventory investment, consumer spending, federal government spending, state and local government spending, and nonresidential fixed investment that were partly offset by decreases in residential fixed investment and exports. Imports, which are a subtraction in the calculation of GDP, decreased. The revision primarily reflected downward revisions to exports and consumer spending. Imports, which are a subtraction in the calculation of GDP, were revised down.
Consumer Confidence – Released 3/28/2023 – The Conference Board Consumer Confidence Index® increased in March. The Index now stands at 104.2 (1985=100), up from 103.4 in February.
Durable Goods – Released 3/24/2023 – New orders for manufactured durable goods in February decreased $2.6 billion or 1.0% to $268.4 billion. Transportation equipment led the decrease down $2.6 billion or 2.8% to $89.4 billion.
New Residential Sales – Released 3/23/2023 – Sales of new single-family homes increased 1.1% to 640k, seasonally adjusted, in February. The median sales price of new homes sold in February was $438,200 with an average sales price of $498,700. At the end of February, the seasonally adjusted estimate of new homes for sale was 436k. This represents a supply of 8.2 months at the current sales rate.
Existing Home Sales – Released 3/21/2023 – Existing home sales increased in February following twelve consecutive months of declines. Sales increased 14.5% to a seasonally adjusted rate of 4.58 million in February. Sales decreased 22.6% year-over-year. Housing inventory sits at 980k units. Identical to January’s inventory. Up 15.3% over last year. Unsold inventory sits at a 2.6-month supply. The median existing home price for all housing types was $363,000 which is down 0.2% from February 2022. February ended 131 consecutive months of year-over-year increases, the longest-running streak on record.
Industrial Production and Capacity Utilization – Released 3/17/2023 – In February Industrial production was unchanged. Manufacturing increased 0.1%. Utilities output increased 0.5%. Mining output declined 0.6%. Total industrial production was 0.2% lower in February than a year ago. Total capacity utilization was unchanged in February at 78.0% which is 1.6% below its long run average.
Housing Starts – Released 3/16/2023 – New home starts in February were at a seasonally adjusted annual rate of 1.450 million, up 9.8% above January, but 18.4% below last February’s rate. Building Permits were at a seasonally adjusted annual rate of 1.524 million, up 13.8% compared to January, but down 17.9% over last year.
Producer Price Index – Released 3/15/2023 – The PPI for final demand decreased 0.1 percent in February, seasonally adjusted, the U.S. Bureau of Labor Statistics reported. Final demand prices increased 0.3 percent in January but decreased 0.2 percent in December. On an unadjusted basis, the index for final demand increased 4.6 percent year over year.
Retail Sales – Released 3/15/2023 – U.S. retail sales for February decreased 0.4% to $697.9 billion but retail sales are 5.4% above February 2022. U.S. retail sales for December 2022 through February 2023 period were up 6.4% from the same period a year ago.
Consumer Price Index – Released 3/14/2023 – Consumer prices increased 0.4% m/m in February, following a 0.5% increase in January. Consumer prices are up 6.0% for the 12-month period ending in February. Core consumer prices increased 0.5% m/m in February.
Next week we get data on CPI, PPI, Retail Sales, and Industrial Production and Capacity Utilization.
Data Sources:
Bureau of Economic Analysis (BEA)
Congressional Budget Office (CBO)
U.S. Bureau of Labor Statistics (BLS)
Federal Reserve Economic Data (FRED Charts)
CME Fed Watch
U.S. Treasury – Yields
U.S. Census Bureau
Institute for Supply Management (ISM)
Weekly DOL Employment Data
BLS Monthly Jobs Report
JOLTS
US Energy Admin (EIA)
BLS Consumer Price Index CPI
BLS Producer Price Index PPI
Atlanta Fed GDPNOW
NY Fed Nowcast GDP
US Census Bureau Housing Starts
Consumer Credit
USCB Retail Sales
Construction Spending
Federal Reserve Dot Plots
NY Empire Index
Philadelphia Federal Reserve
P/E Ratio Data -Yardeni Research
Technical Analysis Info:
StockCharts.com – Financial Charts
Exponential vs Simple moving average
Other Links:
1973 Arab Oil Embargo
Hunt Brothers Silver
Long-Term Capital bailout


Week 14 Talking Points
Table of Contents
Good Life Advisors – Talking Points – Week 14
US equities were mostly lower for the week, with the S&P and Nasdaq finishing somewhat lower after three weeks of gains. Treasuries were firmer with the curve steepening. The 2Y yield touched a low of 3.68% before finishing above 3.80% amid persistent expectations that the Fed may need to begin cutting rates in H2. The dollar notched its fourth consecutive weekly drop and its fifth in the past six weeks; DXY (0.6%). Gold was higher for the sixth consecutive week, crossing above $2000/oz and even nearing a record high on Tuesday before pulling back. Oil added to last week’s gains after OPEC+ announced a surprise output cut last weekend. WTI crude rose 6.6% but did not rise much above the $80/barrel mark, which has been a soft ceiling since November 2022.
Growth concerns moved back to the forefront of the market’s mind during the holiday-shortened week amid a steady stream of weaker-than-expected economic reports. While these firmed expectations for the Fed to pause its rate hikes at the 3-May FOMC meeting, at the same time, they provided additional fuel for hard-landing/recessionary concerns. And given some Fedspeak pushing back against pivot expectations and reiterating its higher-for-longer mantra, a “bad news is bad” mood took some hold of the mindset this week. There were also some early signs of weaker loan demand and tighter credit terms that did nothing to help the shift in atmosphere.
All that said, there were also advocates for a more bullish view this week. Bank-crisis headlines appear to have stabilized, and there has as yet been no indication of further threats to the system. The labor market, while slowing, remains healthy (and this is a key input for the soft-landing thesis). March nonfarm payrolls report showed the US economy added 236k jobs in March.
The total number of employed persons in the US exceeds pre-covid highs.
While the labor force participation rate is back to 2018 highs.
Fixed Income
Yield Curve
January FOMC Statement January Fed Minutes Balance Sheet Reduction Plan Credit, Liquidity and Balance Sheet Federal Reserve Dot Plots
Treasury.gov yields FOMC Policy Normalization Statement Longer- Run Goals Jan 2022
Foreign Exchange Market
Energy Complex
The Baker Hughes rig count was down by 4 this week. There are 751 oil and gas rigs operating in the US – Up 62 over last year.
Metals Complex
Employment Picture
March Jobs Report – BLS Summary – Released 4/7/2023 – The US Economy added 236k nonfarm jobs in March and the Unemployment rate was little changed at 3.5%. Average hourly earnings increased 9 cents to $33.18. Hiring highlights include +72k Leisure and Hospitality, +65k Education and Health Services, +47 Government, and +39k Professional and Business Services.
Weekly Unemployment Claims – Released Thursday 4/6/2023 – The week ending April 1st observed a decrease of 18k in initial claims decreasing to 228k. The four-week moving average of initial jobless claims was up by 4.25k to 237.75k.
Job Openings & Labor Turnover Survey JOLTS – Released 4/4/2023 – The number of job openings decreased to 9.9 million on the last business day of February, the U.S. Bureau of Labor Statistics reported. Over the month the number of hires and total separations changed little at 6.2 million and 5.8 million, respectively. Within separations, quits (4.0 million) increased and layoffs and discharges (1.5 million) decreased.
Employment Cost Index – Released 1/31/2023 – Compensation costs for civilian workers increased 1.0% for the 3-month period ending in December 2022. The 12-month period ending on December 2022 saw compensation costs increase by 5.1%. The 12-month period ending December 2021 increased 4.0%. Wages and salaries increased 5.1 percent over the year and increased 4.5 percent for the 12-month period ending in December 2021. Benefit costs increased 4.9 percent over the year and increased 2.8 percent for the 12-month period ending in December 2021. This report is published quarterly.
This Week’s Economic Data
Links take you to the data source
Consumer Credit – Released 4/7/2023 – In February, consumer credit increased at a seasonally adjusted annual rate of 3.8 percent. Revolving credit increased at an annual rate of 5.0 percent, while nonrevolving credit increased at an annual rate of 3.4 percent.
U.S. Trade Balance – Released 4/5/2023 – The U.S. monthly international trade deficit increased in February 2023 according to the U.S. Bureau of Economic Analysis and the U.S. Census Bureau. The deficit increased from $68.7 billion in January (revised) to $70.5 billion in February. February exports were $251.2 billion, $6.9 billion less than January exports. February imports were $321.7 billion, $5.0 billion less than January imports. Year-to-date, the goods and services deficit decreased $35.5 billion, or 20.3 percent, from the same period in 2022. Exports increased $49.5 billion or 10.8 percent. Imports increased $14.0 billion or 2.2 percent.
PMI Non-Manufacturing Index – Released 4/5/2023 – Economic activity remained in expansionary territory in March. The Services PMI® registered 51.2 percent, 3.9 percentage points lower than February. In February, the Services PMI® registered 55.1 percent.
PMI Manufacturing Index – Released 4/3/2023 – The March Manufacturing PMI® registered 46.3 percent, 1.4 percentage point lower than the 47.7 percent recorded in February. Regarding the overall economy, this figure indicates four months of contraction following 30 months of expansion. The New Orders Index remained in contraction territory at 44.3 percent, 2.7 percentage points lower than the 47.0 percent recorded in February. The production index increased 0.5 percentage points to 47.8.
U.S. Construction Spending – Released 4/3/2023 – Construction spending during February 2023 was estimated at a seasonally adjusted annual rate of $1,844.4 billion, 0.1 percent below the revised January estimate of $1,845.4 billion. The February figure is 5.2 percent above the February 2022 estimate of $1,753.1 billion.
Recent Economic Date
Links take you to the data source
US Light Vehicle Sales – Released 3/31/2023 – U.S. light vehicle sales were at a seasonally adjusted annual rate (SAAR) of 14.896 million units in February.
Chicago PMI – Released 3/31/2023 – Chicago PMI remained in contraction territory but increased in March to 43.8 points up from 43.6 points in February. This marks seven months in contractionary territory.
Personal Income – Released 3/31/2023 – Personal income increased $72.9 billion, or 0.3 percent in February. Disposable Personal Income increased $89.9 billion or 0.5 percent. Personal Consumption Expenditure increased $27.9 billion or 10.2 percent.
Third Estimate of 4th Quarter 2022 GDP – Released 3/30/2023 – Real gross domestic product (GDP) increased at an annual rate of 2.6 percent in the fourth quarter of 2022 according to the third estimate released by the Bureau of Economic Analysis, following an increase of 3.2 percent in the third quarter of 2022. The second estimate saw real GDP increase 2.7% and the advance estimate saw real GDP increase by 2.9%.The GDP estimate released today is based on source data that are more complete than the advance and second estimate. The increase in real GDP reflected increases in private inventory investment, consumer spending, federal government spending, state and local government spending, and nonresidential fixed investment that were partly offset by decreases in residential fixed investment and exports. Imports, which are a subtraction in the calculation of GDP, decreased. The revision primarily reflected downward revisions to exports and consumer spending. Imports, which are a subtraction in the calculation of GDP, were revised down.
Consumer Confidence – Released 3/28/2023 – The Conference Board Consumer Confidence Index® increased in March. The Index now stands at 104.2 (1985=100), up from 103.4 in February.
Durable Goods – Released 3/24/2023 – New orders for manufactured durable goods in February decreased $2.6 billion or 1.0% to $268.4 billion. Transportation equipment led the decrease down $2.6 billion or 2.8% to $89.4 billion.
New Residential Sales – Released 3/23/2023 – Sales of new single-family homes increased 1.1% to 640k, seasonally adjusted, in February. The median sales price of new homes sold in February was $438,200 with an average sales price of $498,700. At the end of February, the seasonally adjusted estimate of new homes for sale was 436k. This represents a supply of 8.2 months at the current sales rate.
Existing Home Sales – Released 3/21/2023 – Existing home sales increased in February following twelve consecutive months of declines. Sales increased 14.5% to a seasonally adjusted rate of 4.58 million in February. Sales decreased 22.6% year-over-year. Housing inventory sits at 980k units. Identical to January’s inventory. Up 15.3% over last year. Unsold inventory sits at a 2.6-month supply. The median existing home price for all housing types was $363,000 which is down 0.2% from February 2022. February ended 131 consecutive months of year-over-year increases, the longest-running streak on record.
Industrial Production and Capacity Utilization – Released 3/17/2023 – In February Industrial production was unchanged. Manufacturing increased 0.1%. Utilities output increased 0.5%. Mining output declined 0.6%. Total industrial production was 0.2% lower in February than a year ago. Total capacity utilization was unchanged in February at 78.0% which is 1.6% below its long run average.
Housing Starts – Released 3/16/2023 – New home starts in February were at a seasonally adjusted annual rate of 1.450 million, up 9.8% above January, but 18.4% below last February’s rate. Building Permits were at a seasonally adjusted annual rate of 1.524 million, up 13.8% compared to January, but down 17.9% over last year.
Producer Price Index – Released 3/15/2023 – The PPI for final demand decreased 0.1 percent in February, seasonally adjusted, the U.S. Bureau of Labor Statistics reported. Final demand prices increased 0.3 percent in January but decreased 0.2 percent in December. On an unadjusted basis, the index for final demand increased 4.6 percent year over year.
Retail Sales – Released 3/15/2023 – U.S. retail sales for February decreased 0.4% to $697.9 billion but retail sales are 5.4% above February 2022. U.S. retail sales for December 2022 through February 2023 period were up 6.4% from the same period a year ago.
Consumer Price Index – Released 3/14/2023 – Consumer prices increased 0.4% m/m in February, following a 0.5% increase in January. Consumer prices are up 6.0% for the 12-month period ending in February. Core consumer prices increased 0.5% m/m in February.
Next week we get data on CPI, PPI, Retail Sales, and Industrial Production and Capacity Utilization.
Data Sources:
Bureau of Economic Analysis (BEA)
Congressional Budget Office (CBO)
U.S. Bureau of Labor Statistics (BLS)
Federal Reserve Economic Data (FRED Charts)
CME Fed Watch
U.S. Treasury – Yields
U.S. Census Bureau
Institute for Supply Management (ISM)
Weekly DOL Employment Data
BLS Monthly Jobs Report
JOLTS
US Energy Admin (EIA)
BLS Consumer Price Index CPI
BLS Producer Price Index PPI
Atlanta Fed GDPNOW
NY Fed Nowcast GDP
US Census Bureau Housing Starts
Consumer Credit
USCB Retail Sales
Construction Spending
Federal Reserve Dot Plots
NY Empire Index
Philadelphia Federal Reserve
P/E Ratio Data -Yardeni Research
Technical Analysis Info:
StockCharts.com – Financial Charts
Exponential vs Simple moving average
Other Links:
1973 Arab Oil Embargo
Hunt Brothers Silver
Long-Term Capital bailout
Categories:
Tags: