Good Life Advisors – Talking Points – Week 12
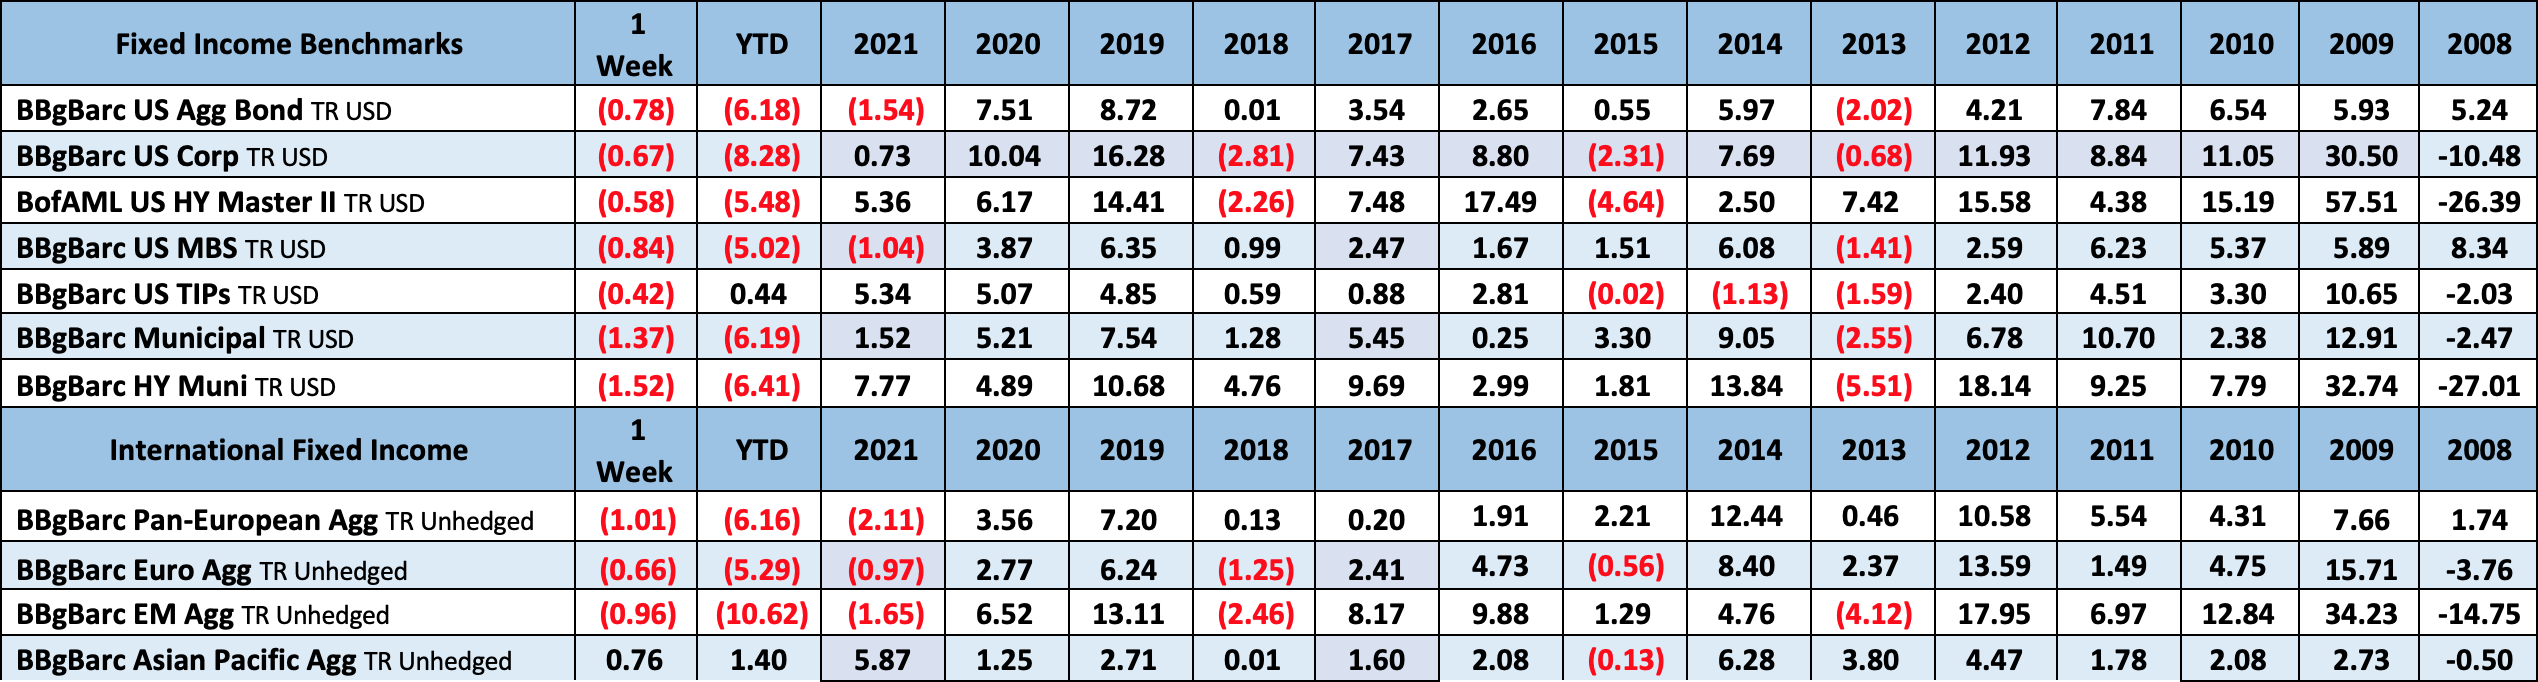
Let’s start with fixed Income. Fed Chair Powell said on Monday that the Fed needs to move “expeditiously” to return monetary policy to a more neutral level. Treasuries sold off sharply this week in response, with the curve continuing to flatten. In fact, the 3-year yield is now higher (2.51%) than the 10 year (2.48%) and the 10 minus 2 spread is down to 18bps. By Friday, markets priced in a ~80% probability of a 50 bp rate hike in May and ~200 bp in cumulative hikes by the end of 2022. CME FedWatch Tool. The bond aggregate is down over 6% ytd with TIPS the sole positive for the year so far.
There was continued focus on the 10 year minus two year spread this week. The spread has been dropping like a rock since the beginning of the year and is making headlines on CNBC. We want to point out that although it can be a sign of a potential recession, it is not the perfect indicator and there are other spread indicators that are also very good at predicting recessions, that are NOT flashing. While the 10 minus 2 is declining, the 10 minus Fed Funds rate is actually climbing, now at its highest rate since 2016.

10 Minus Fed Rate – Also a good indicator
March FOMC Statement Credit, Liquidity and Balance Sheet Federal Reserve Dot Plots
US Corporate Debt Tops 7 Trillion. Treasury.gov yields FOMC Policy Normalization Statement Longer Run Goals August 2020
US equities finished mostly higher after a big rally in the prior week that saw the S&P 500 up over 6%, its best performance since November 2020. With both WTI and Brent crude steady above 100bbl the Energy sector continues to rocket higher, now up over 40% for the year. Utilities and materials both gaining more that 3% this week. Morgan Stanley upgraded their outlook on Utilities and in Materials, the industrial metals drove the upside. Telecom and healthcare were in the red this week. %. The dollar index gained 0.6% with strength in dollar/yen. Gold was up 1.3%. WTI crude jumped 10.5%.
Foreign Exchange Market
Energy Complex
The Baker Hughes rig count gained 7 this week. There are 670 oil and gas rigs operating in the US – Up 253 over last year.
Metals Complex
Employment Picture
Weekly Unemployment Claims – Released Thursday 3/24/2022 – The week ending March 19th observed a decrease of 28k in initial claims declining to 187k. The four-week moving average of initial jobless claims decreased 11.5k to 211.75k.
Job Openings & Labor Turnover Survey JOLTS – Released 3/9/2022 – The U.S. Bureau of Labor Statistics reported the number and rate of job openings was little changed at 11.3 million on the last business day of January. Over the month, hires were little changed at 6.5 million and separations were little changed at 6.1 million. Within separations, the quits rate decreased to 2.8%. The layoffs and discharges rates were little changed at 0.9%.
February Jobs Report – BLS Summary Released 3/4/2022 – The US Economy added 678k nonfarm jobs in February and the Unemployment rate declined to 3.8%. Average hourly earnings were little changed at $31.58. Hiring highlights include +151k Leisure and Hospitality, +86k Professional and Business Services, and +61k Retail Trade.
- Average hourly earnings were little changed at $31.58.
- U3 unemployment rate declined 0.2% to 3.8%. U6 unemployment rate increased 7.2%.
- The labor force participation rate increased to 62.3%.
- Average work week rose 0.1 hour to 34.7 hours.
Employment Cost Index – Released 1/28/2022 – Compensation costs for civilian workers increased 1.0% for the 3-month period ending in December 2021. The 12-month period ending in December 2021 saw compensation costs increase by 4.0%. The 12-month period ending December 2020 increased 2.5%. Wages and salaries increased 4.5 percent over the year and increased 2.6 percent for the 12-month period ending in December 2020. Benefit costs increased 2.8 percent over the year and increased 2.3 percent for the 12-month period ending in December 2020. This report is published quarterly.
This Week’s Economic Data
Links take you to the data source
Durable Goods – Released 3/24/2022 – New orders for manufactured durable goods in February decreased $6.0 billion or 2.2% to $271.5 billion. Transportation equipment led the decrease falling $4.9 billion or 5.6% to $82.6 billion.
New Residential Sales – Released 3/23/2022 – Sales of new single-family homes decreased 2.0% to 772k, seasonally adjusted, in February. The median sales price of new homes sold in February was $400,600 with an average sales price of $511,000. At the end of February, the seasonally adjusted estimate of new homes for sale was 407k. This represents a supply of 6.3 months at the current sales rate.
Recent Economic Data
Links take you to the data source
Existing Home Sales – Released 3/18/2022 – Existing home sales decreased in February following an increase in January. Sales declined 7.2% to a seasonally adjusted rate of 6.02 million in February. Sales decreased 2.4% year-over-year. Housing inventory sits at 870k units. Up 2.4% from January’s inventory. Down 15.5% over last year. Unsold inventory sits at a 1.7-month supply. The median existing home price for all housing types was $357,300 which is up 15.0% from February 2021. This marks 120 consecutive months of year-over-year increases, the longest-running streak on record.
Housing Starts – Released 3/17/2022 – New home starts in February were at a seasonally adjusted annual rate of 1.769 million; up 6.8% above January, and 22.3% above last January’s rate. Building Permits were at a seasonally adjusted annual rate of 1.859 million, down 1.9% compared to January, but up 7.7% over last year.
Industrial Production and Capacity Utilization – Released 3/17/2022 – In February Industrial production increased 0.5%. Manufacturing increased 1.2%. Utilities output declined 2.7%. Mining output increased 0.1%. Total industrial production was 7.5% higher in February than a year ago. Total capacity utilization increased 0.3% to 77.6% in February which is 1.9% below its long run average.
Retail Sales – Released 3/16/2022 – U.S. retail sales for February increased 0.3% to $658.1 billion and retail sales are 17.6% above February 2021. U.S. retail sales for the December 2021 through February 2022 period were up 16.0% from the same period a year ago.
Producer Price Index – Released 3/15/2022 – The Producer Price Index for final demand increased 0.8% in February. PPI less food and energy increased 0.7%. The change in PPI for final demand has increased 10.0% year/y.
Consumer Price Index – Released 3/10/2022 – Consumer prices rose 0.8% m/m in February following a 0.6% gain in January. Consumer prices are up 7.9% for the 12-month period ending in February. Core consumer prices increased 0.5% m/m in February following a 0.6% gain in January.
U.S. Trade Balance – Released 3/8/2022 – According to the U.S. Census Bureau of Economic Analysis the goods and services deficit increased in January by $7.7 billion to $89.7 billion. January exports were $224.4 billion, $3.9 billion less than December exports. January imports were $314.1 billion, $3.8 billion more than December imports. Year-over-year, the goods and services deficit increased $24.6 billion, or 37.7 percent, from January 2021. Exports increased $29.9 billion or 15.4 percent. Imports increased $54.4 billion or 21.0 percent.
Consumer Credit – Released 3/7/2022 – Consumer credit increased at a seasonally adjusted annual rate of 1.9 percent in January. Revolving credit decreased at an annual rate of 0.3 percent, while nonrevolving credit increased at an annual rate of 2.5 percent.
PMI Non-Manufacturing Index – Released 3/3/2022 – Economic activity in the non-manufacturing sector grew in January for the 21st consecutive month. ISM Non-Manufacturing registered 56.5 percent, which is 3.4 percentage points below the adjusted January reading of 59.9 percent.
PMI Manufacturing Index – Released 3/1/2022 – February PMI increased 1.0% to 58.6% up from January’s reading of 57.6%. The New Orders Index was 61.7% up 3.8% from January’s reading of 57.9%. The Production Index registered 58.5%, up 0.7%.
U.S. Construction Spending – Released 3/1/2022 – Construction spending increased 1.3% in January measuring at a seasonally adjusted annual rate of $1,677.2 billion. The January figure is 8.2% above the January 2021 estimate. Private construction spending was 1.5% above the revised December estimate at $1,326.5 billion. Public construction spending was 0.6% above the revised December estimate at $350.7 billion.
Chicago PMI – Released 2/28/2021 – Chicago PMI declined by 8.9 points in February to 56.3. This decline marks the first decline since November 2021. All five of the main five indicators fell, with New Orders and Supplier Deliveries taking the largest hit. Only Inventories edged up over the month.
US Light Vehicle Sales – Released 2/25/2022 – U.S. light vehicle sales were at a seasonally adjusted annual rate (SAAR) of 15.018 million units in January.
Personal Income – Released 2/25/2022 – Personal income increased $9.0 billion or 0.1 percent in January according to estimates released today by the Bureau of Economic Analysis. Disposable personal income (DPI) increased $19.8 billion or 0.1 percent and personal consumption expenditures (PCE) increased $337.2 billion or 2.1 percent.
Second Estimate of 4th Quarter 2021 GDP – Released 2/24/2022 – Real gross domestic product (GDP) increased at an annual rate of 7.0 percent in the fourth quarter of 2021, according to the second estimate released by the Bureau of Economic Analysis. GDP increased 2.3 percent in the third quarter of 2021. The second estimate is based on source data that are more complete than that of the advance estimate. The increase in real GDP primarily reflected increases in private inventory investment, exports, personal consumption expenditures (PCE), and nonresidential fixed investment that were partly offset by decreases in both federal and state and local government spending. Imports, which are a subtraction in the calculation of GDP, increased. The updated estimates primarily reflected upward revisions to nonresidential fixed investment, state and local government spending, and residential fixed investment that were partly offset by downward revisions to personal consumption expenditures (PCE) and exports.
Consumer Confidence – Released 2/22/2022 – The Consumer confidence index decreased in February following a decrease in January. The Index now stands at 110.5, down from 111.1 in January.
Next week we get data on Consumer Confidence, the 3rd Estimate of 4th Q GDP, Personal Income, Chicago PMI, U.S. Construction Spending, Manufacturing PMI, and the March Jobs Report.
Data Sources:
Bureau of Economic Analysis (BEA)
Congressional Budget Office (CBO)
U.S. Bureau of Labor Statistics (BLS)
Federal Reserve Economic Data (FRED Charts)
CME Fed Watch
U.S. Treasury – Yields
U.S. Census Bureau
Institute for Supply Management (ISM)
Weekly DOL Employment Data
BLS Monthly Jobs Report
JOLTS
US Energy Admin (EIA)
BLS Consumer Price Index CPI
BLS Producer Price Index PPI
Atlanta Fed GDPNOW
NY Fed Nowcast GDP
US Census Bureau Housing Starts
Consumer Credit
USCB Retail Sales
Construction Spending
Federal Reserve Dot Plots
NY Empire Index
Philadelphia Federal Reserve
P/E Ratio Data -Yardeni Research
Technical Analysis Info:
StockCharts.com – Financial Charts
Exponential vs Simple moving average
Other Links:
1973 Arab Oil Embargo
Hunt Brothers Silver
Long-Term Capital bailout


Week 12 Talking Points
Good Life Advisors – Talking Points – Week 12
Let’s start with fixed Income. Fed Chair Powell said on Monday that the Fed needs to move “expeditiously” to return monetary policy to a more neutral level. Treasuries sold off sharply this week in response, with the curve continuing to flatten. In fact, the 3-year yield is now higher (2.51%) than the 10 year (2.48%) and the 10 minus 2 spread is down to 18bps. By Friday, markets priced in a ~80% probability of a 50 bp rate hike in May and ~200 bp in cumulative hikes by the end of 2022. CME FedWatch Tool. The bond aggregate is down over 6% ytd with TIPS the sole positive for the year so far.
There was continued focus on the 10 year minus two year spread this week. The spread has been dropping like a rock since the beginning of the year and is making headlines on CNBC. We want to point out that although it can be a sign of a potential recession, it is not the perfect indicator and there are other spread indicators that are also very good at predicting recessions, that are NOT flashing. While the 10 minus 2 is declining, the 10 minus Fed Funds rate is actually climbing, now at its highest rate since 2016.
10 Minus Fed Rate – Also a good indicator
March FOMC Statement Credit, Liquidity and Balance Sheet Federal Reserve Dot Plots
US Corporate Debt Tops 7 Trillion. Treasury.gov yields FOMC Policy Normalization Statement Longer Run Goals August 2020
US equities finished mostly higher after a big rally in the prior week that saw the S&P 500 up over 6%, its best performance since November 2020. With both WTI and Brent crude steady above 100bbl the Energy sector continues to rocket higher, now up over 40% for the year. Utilities and materials both gaining more that 3% this week. Morgan Stanley upgraded their outlook on Utilities and in Materials, the industrial metals drove the upside. Telecom and healthcare were in the red this week. %. The dollar index gained 0.6% with strength in dollar/yen. Gold was up 1.3%. WTI crude jumped 10.5%.
Table of Contents
Foreign Exchange Market
Energy Complex
The Baker Hughes rig count gained 7 this week. There are 670 oil and gas rigs operating in the US – Up 253 over last year.
Metals Complex
Employment Picture
Weekly Unemployment Claims – Released Thursday 3/24/2022 – The week ending March 19th observed a decrease of 28k in initial claims declining to 187k. The four-week moving average of initial jobless claims decreased 11.5k to 211.75k.
Job Openings & Labor Turnover Survey JOLTS – Released 3/9/2022 – The U.S. Bureau of Labor Statistics reported the number and rate of job openings was little changed at 11.3 million on the last business day of January. Over the month, hires were little changed at 6.5 million and separations were little changed at 6.1 million. Within separations, the quits rate decreased to 2.8%. The layoffs and discharges rates were little changed at 0.9%.
February Jobs Report – BLS Summary Released 3/4/2022 – The US Economy added 678k nonfarm jobs in February and the Unemployment rate declined to 3.8%. Average hourly earnings were little changed at $31.58. Hiring highlights include +151k Leisure and Hospitality, +86k Professional and Business Services, and +61k Retail Trade.
Employment Cost Index – Released 1/28/2022 – Compensation costs for civilian workers increased 1.0% for the 3-month period ending in December 2021. The 12-month period ending in December 2021 saw compensation costs increase by 4.0%. The 12-month period ending December 2020 increased 2.5%. Wages and salaries increased 4.5 percent over the year and increased 2.6 percent for the 12-month period ending in December 2020. Benefit costs increased 2.8 percent over the year and increased 2.3 percent for the 12-month period ending in December 2020. This report is published quarterly.
This Week’s Economic Data
Links take you to the data source
Durable Goods – Released 3/24/2022 – New orders for manufactured durable goods in February decreased $6.0 billion or 2.2% to $271.5 billion. Transportation equipment led the decrease falling $4.9 billion or 5.6% to $82.6 billion.
New Residential Sales – Released 3/23/2022 – Sales of new single-family homes decreased 2.0% to 772k, seasonally adjusted, in February. The median sales price of new homes sold in February was $400,600 with an average sales price of $511,000. At the end of February, the seasonally adjusted estimate of new homes for sale was 407k. This represents a supply of 6.3 months at the current sales rate.
Recent Economic Data
Links take you to the data source
Existing Home Sales – Released 3/18/2022 – Existing home sales decreased in February following an increase in January. Sales declined 7.2% to a seasonally adjusted rate of 6.02 million in February. Sales decreased 2.4% year-over-year. Housing inventory sits at 870k units. Up 2.4% from January’s inventory. Down 15.5% over last year. Unsold inventory sits at a 1.7-month supply. The median existing home price for all housing types was $357,300 which is up 15.0% from February 2021. This marks 120 consecutive months of year-over-year increases, the longest-running streak on record.
Housing Starts – Released 3/17/2022 – New home starts in February were at a seasonally adjusted annual rate of 1.769 million; up 6.8% above January, and 22.3% above last January’s rate. Building Permits were at a seasonally adjusted annual rate of 1.859 million, down 1.9% compared to January, but up 7.7% over last year.
Industrial Production and Capacity Utilization – Released 3/17/2022 – In February Industrial production increased 0.5%. Manufacturing increased 1.2%. Utilities output declined 2.7%. Mining output increased 0.1%. Total industrial production was 7.5% higher in February than a year ago. Total capacity utilization increased 0.3% to 77.6% in February which is 1.9% below its long run average.
Retail Sales – Released 3/16/2022 – U.S. retail sales for February increased 0.3% to $658.1 billion and retail sales are 17.6% above February 2021. U.S. retail sales for the December 2021 through February 2022 period were up 16.0% from the same period a year ago.
Producer Price Index – Released 3/15/2022 – The Producer Price Index for final demand increased 0.8% in February. PPI less food and energy increased 0.7%. The change in PPI for final demand has increased 10.0% year/y.
Consumer Price Index – Released 3/10/2022 – Consumer prices rose 0.8% m/m in February following a 0.6% gain in January. Consumer prices are up 7.9% for the 12-month period ending in February. Core consumer prices increased 0.5% m/m in February following a 0.6% gain in January.
U.S. Trade Balance – Released 3/8/2022 – According to the U.S. Census Bureau of Economic Analysis the goods and services deficit increased in January by $7.7 billion to $89.7 billion. January exports were $224.4 billion, $3.9 billion less than December exports. January imports were $314.1 billion, $3.8 billion more than December imports. Year-over-year, the goods and services deficit increased $24.6 billion, or 37.7 percent, from January 2021. Exports increased $29.9 billion or 15.4 percent. Imports increased $54.4 billion or 21.0 percent.
Consumer Credit – Released 3/7/2022 – Consumer credit increased at a seasonally adjusted annual rate of 1.9 percent in January. Revolving credit decreased at an annual rate of 0.3 percent, while nonrevolving credit increased at an annual rate of 2.5 percent.
PMI Non-Manufacturing Index – Released 3/3/2022 – Economic activity in the non-manufacturing sector grew in January for the 21st consecutive month. ISM Non-Manufacturing registered 56.5 percent, which is 3.4 percentage points below the adjusted January reading of 59.9 percent.
PMI Manufacturing Index – Released 3/1/2022 – February PMI increased 1.0% to 58.6% up from January’s reading of 57.6%. The New Orders Index was 61.7% up 3.8% from January’s reading of 57.9%. The Production Index registered 58.5%, up 0.7%.
U.S. Construction Spending – Released 3/1/2022 – Construction spending increased 1.3% in January measuring at a seasonally adjusted annual rate of $1,677.2 billion. The January figure is 8.2% above the January 2021 estimate. Private construction spending was 1.5% above the revised December estimate at $1,326.5 billion. Public construction spending was 0.6% above the revised December estimate at $350.7 billion.
Chicago PMI – Released 2/28/2021 – Chicago PMI declined by 8.9 points in February to 56.3. This decline marks the first decline since November 2021. All five of the main five indicators fell, with New Orders and Supplier Deliveries taking the largest hit. Only Inventories edged up over the month.
US Light Vehicle Sales – Released 2/25/2022 – U.S. light vehicle sales were at a seasonally adjusted annual rate (SAAR) of 15.018 million units in January.
Personal Income – Released 2/25/2022 – Personal income increased $9.0 billion or 0.1 percent in January according to estimates released today by the Bureau of Economic Analysis. Disposable personal income (DPI) increased $19.8 billion or 0.1 percent and personal consumption expenditures (PCE) increased $337.2 billion or 2.1 percent.
Second Estimate of 4th Quarter 2021 GDP – Released 2/24/2022 – Real gross domestic product (GDP) increased at an annual rate of 7.0 percent in the fourth quarter of 2021, according to the second estimate released by the Bureau of Economic Analysis. GDP increased 2.3 percent in the third quarter of 2021. The second estimate is based on source data that are more complete than that of the advance estimate. The increase in real GDP primarily reflected increases in private inventory investment, exports, personal consumption expenditures (PCE), and nonresidential fixed investment that were partly offset by decreases in both federal and state and local government spending. Imports, which are a subtraction in the calculation of GDP, increased. The updated estimates primarily reflected upward revisions to nonresidential fixed investment, state and local government spending, and residential fixed investment that were partly offset by downward revisions to personal consumption expenditures (PCE) and exports.
Consumer Confidence – Released 2/22/2022 – The Consumer confidence index decreased in February following a decrease in January. The Index now stands at 110.5, down from 111.1 in January.
Next week we get data on Consumer Confidence, the 3rd Estimate of 4th Q GDP, Personal Income, Chicago PMI, U.S. Construction Spending, Manufacturing PMI, and the March Jobs Report.
Data Sources:
Bureau of Economic Analysis (BEA)
Congressional Budget Office (CBO)
U.S. Bureau of Labor Statistics (BLS)
Federal Reserve Economic Data (FRED Charts)
CME Fed Watch
U.S. Treasury – Yields
U.S. Census Bureau
Institute for Supply Management (ISM)
Weekly DOL Employment Data
BLS Monthly Jobs Report
JOLTS
US Energy Admin (EIA)
BLS Consumer Price Index CPI
BLS Producer Price Index PPI
Atlanta Fed GDPNOW
NY Fed Nowcast GDP
US Census Bureau Housing Starts
Consumer Credit
USCB Retail Sales
Construction Spending
Federal Reserve Dot Plots
NY Empire Index
Philadelphia Federal Reserve
P/E Ratio Data -Yardeni Research
Technical Analysis Info:
StockCharts.com – Financial Charts
Exponential vs Simple moving average
Other Links:
1973 Arab Oil Embargo
Hunt Brothers Silver
Long-Term Capital bailout
Categories:
Tags: