Good Life Advisors – Talking Points – Week 11
Equities Rebounded Sharply this Week
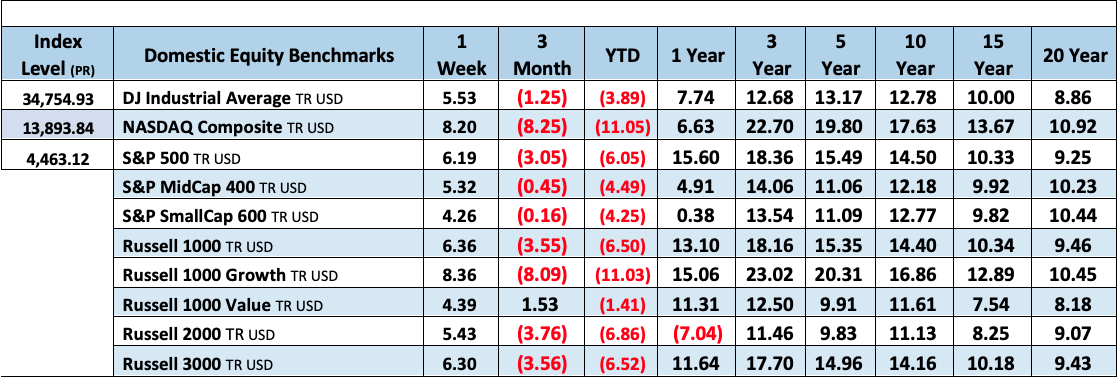
After jumping 6% this week, the S&P 500 is still down 6% for the year.
The market put inits best week since November 2020 with help from a big four-day rally. Fixed income was mixed, with the curve flattening slightly the two-year treasury yield. The dollar was higher thanks to a big gain against the yen; the dollar pulled back on the euro, sterling, and commodity crosses. Gold was weaker, finishing down 2.8%. Oil logged its second consecutive weekly drop, with WTI settling down 5.7% amid a lot of headline volatility about a possible Ukraine ceasefire and some sense China’s Covid outbreak may be moderating.
The Fed finally raised for the first time since the 4th quarter of 2018, hiking by the expected 25bp and saying that ongoing increases may be appropriate. The Ukraine crisis remained much on the market’s mind this week, though there was little change in the situation on the ground other than Russia widening the scope of its largely stalled assault and increased global attention on rising civilian casualties. The market reacted positively to mid-week headlines suggesting there had been progress toward a ceasefire deal, but both sides later indicated that this had been overstated. While Ukrainian neutrality seems like it may be the cornerstone of any eventual deal, Ukraine this week continued to press the world for help, to which the US committed $800M in aid (including advances drone and missile systems).
China contributed multiple strands to this week’s market narrative. Biden spoke with China’s Xi for two hours on Friday, with some focus on Ukraine. Biden stressed the implications and consequences should China provide material support for Russia to conduct its attacks. There were also some signs of slackening in the country’s ongoing Covid surge, which has led to lockdowns in several industrial and tech hubs. But while China reiterated its support for a “zero Covid” approach, it also signaled some willingness to consider the economic and social impacts of its response. Finally, China tech stocks mounted a big rally after some significant recent weakness, helped by pledges of economic support from Beijing and some signs of progress on a cooperation plan with US regulators.
The marked digested several economic releases this week, including below-consensus readings for February PPI, both on the headline and core measures. February retail sales were weaker than forecast after a very strong February. On the housing front, February housing starts, and permits were higher than consensus, but existing-home sales posted a monthly drop, with the release flagging rising mortgage rates and sustained price increases.

Fixed Income
The two-year yield continues to rise, closing this week just shy of 2%, its highest yield since May 2019.
March FOMC Statement Credit, Liquidity and Balance Sheet Federal Reserve Dot Plots
US Corporate Debt Tops 7 Trillion. Treasury.gov yields FOMC Policy Normalization Statement Longer Run Goals August 2020
Global Bond Yields
Foreign Exchange Market
Energy Complex
The Baker Hughes rig count was flat this week. There are 663 oil and gas rigs operating in the US- Up 252 over last year.
Metals Complex
Employment Picture
Weekly Unemployment Claims – Released Thursday 3/17/2022 – The week ending March 12th observed a decrease of 15k in initial claims declining to 214k. The four-week moving average of initial jobless claims decreased 8.75k to 223k.
Job Openings & Labor Turnover Survey JOLTS – Released 3/9/2022 – The U.S. Bureau of Labor Statistics reported the number and rate of job openings was little changed at 11.3 million on the last business day of January. Over the month, hires were little changed at 6.5 million and separations were little changed at 6.1 million. Within separations, the quits rate decreased to 2.8%. The layoffs and discharges rates were little changed at 0.9%.
February Jobs Report – BLS Summary Released 3/4/2022 – The U.S. economy added 678k nonfarm jobs in February and the Unemployment rate declined to 3.8%. Average hourly earnings were little changes at $31.58. Hiring highlights include +151k Leisure and Hospitality, +86k Professional and Business Services, and +61k Retail Trade.
Employment Cost Index – Released 1/28/2022 – Compensation costs for civilian workers increased 1.0% for the 3-month period ending in December 2021. The 12-month period ending in December 2021 saw compensation costs increase by 4%. The 12-month period ending December 2020 increased 2.5%. Wages and salaries increased 4.5% over the year and increased 2.6% for the 12-month period ending in December 2020. Benefit costs increased 2.8% over the year and increased 2.3% for the 12-month period ending in December 2020. This report is published quarterly.
This Week’s Economic Data
Links take you to the data source
Existing Home Sales – Released 3/18/2022 – Existing home sales decreased in February following an increase in January. Sales declined 7.2% to a seasonally adjusted rate of 6.02 million in February. Sales decreased 2.4% year-over-year. Housing inventory sits at 870k units. Up 2.4% from January’s inventory. Down 15.5% over last year. Unsold inventory sits at a 1.7-month supply. The median existing home price for all housing types was $357,300 which is up 15% from February. This marks 120 consecutive months of year-over-year increases, the longest-running streak on record.
Housing Starts – Released 3/17/2022 – New home starts in February were at a seasonally adjusted annual rate of 1.769 million; up 6.8% above January, and 22.3% above last January’s rate. Building permits were at a seasonally adjusted annual rate of 1.859 million, down 1.9% compared to January, but up 7.7% over last year.
Industrial Production and Capacity Utilization – Released 3/17/2022 – In February, Industrial production increased 0.5%. Manufacturing increased 1.2%. Utilities output declined 2.7%. MIning output increased 0.1%. Total industrial production was 7.5% higher in February than a year ago. Total capacity utilization increased 0.3% to 77.6% in February which is 1.9% below its long run average.
Retail Sales – Released 3/16/2022 – U.S. retail sales for February increased 0.3% to $658.1 billion and retail sales are 17.6% above February 2021. U.S. retail sales for the December 2021 through February 2022 period were up to 16% from the same period a year ago.
Producer Price Index – Released 3/15/2022 – The Producer Price Index for final demand increased 0.8% in February. PPI less food and energy increased 0.7% The change in PPI for final demand has increased 10% year/y.
Recent Economic Data
Links take you to the data source
Consumer Price Index – Released 3/10/2022 – Consumer prices rose 0.8% m/m in February following a 0.6% gain in January. Consumer prices are up 7.9% for the 12-month period ending in February. Core consumer prices increased 0.5% m/m in February following a 0.6% gain in January.
U.S. Trade Balance – Released 3/8/2022 – According to the U.S. Census Bureau of Economic Analysis the goods and services deficit increased in January by $7.7 billion to $89.7 billion. January exports were $224.4 billion, $3.9 billion less than December exports. January imports were $314.1 billion, $3.8 billion more than December imports. Year-over-year, the goods and services deficit increased $24.6 billion, or 37.7%, from January 2021. Exports increased $29.9 billion or 15.4%. Imports increased $54.4 billion or 21%.
Consumer Credit – Released 3/7/2022 – Consumer credit increased at a seasonally adjusted annual rate of 1.9% in January. Revolving credit decreased at an annual rate of 0.3%, while nonrevolving credit increased at an annual rate of 2.5%.
PMI Non-Manufacturing Index – Released 3/3/2022 – Economic activity in the non-manufacturing sector grew in January for the 21st consecutive month. ISM Non-Manufacturing registered 56.5%, which is 3.4 percentage points below the adjusted January reading of 59.9%.
PMI Manufacturing Index – Released 3/1/2022 – February PMI increased 1% to 58.6% up from January’s reading of 57.6%. The New Orders Index was 61.7% up 3.8% from January’s reading of 57.9%. The Production Index registered 58.5%, up 0.7%.
U.S. Construction Spending – Released 3/1/2022 – Construction spending increased 1.3% in January measuring at a seasonally adjusted annual rate of $1,677.2 billion. The January figure is 8.2% above the January 2021 estimate. Private construction spending was 1.5% above the revised December estimate at $1,326.5 billion. Public construction spending was 0.6% above the revised December estimate at $350.7 billion.
Chicago PMI – Released 2/28/2021 – Chicago PMI declined by 8.9 points in February to 56.3. This decline marks the first decline since November 2021. All five of the main five indicators fell, with New Orders and Supplier Deliveries taking the largest hit. Only Inventories edged up over the month.
US Light Vehicle Sales – Released 2/25/2022 – U.S. light vehicle sales were at a seasonally adjusted annual rate (SAAR) of 15.018 million units in January.
Personal Income – Released 2/25/2022 – Personal income increased $9 billion or 0.1% in January according to estimates released today by the Bureau of Economic Analysis. Disposable personal income (DPI) increased $19.8 billion or 0.1% and personal consumption expenditures (PCE) increased $337.2 billion or 2.1%.
Durable Goods – Released 2/25/2022 – New orders for manufactured durable goods in January increased $4.3 billion or 1.6% to $277.5 billion. Transportation equipment led the increase rising $3.3 billion or 3.4% to $87.6 billion.
Second Estimate of 4th Quarter 2021 GDP – Released 2/24/2022 – Real gross domestic product (GDP) increased at an annual rate of 7% in the fourth quarter of 2021, according to the second estimate released by the Bureau of Economic Analysis. GDP increased 2.3% in the third quarter of 2021. The second estimate is based on source data that are more complete than that of the advance estimate. The increase in real GDP primarily reflected increases in private inventory investment, exports, personal consumption expenditures (PCE), and nonresidential fixed investment that were partly offset by decreases in both federal and state and local government spending. Imports, which are a subtraction in the calculation of GDP, increased. The updated estimates primarily reflected upward revisions to nonresidential fixed investment, state and local government spending, and residential fixed investment that were partly offset by downward revisions to personal consumption expenditures (PCE) and exports.
New Residential Sales – Released 2/24/2022 – Sales of new single-family homes decreased 4.5% to 801k, seasonally adjusted, in January. The median sales price of new homes sold in January was $423,300 with an average sales price of %496,900. At the end of January, the seasonally adjusted estimate of new homes for sale was 406k. This represents a supply of 6.1 months at the current sales rate.
Consumer Confidence – Released 2/22/2022 – The Consumer confidence index decreased in February following a decrease in January. The Index now stands at 110.5, down from 111.1 in January.
Next week we get data on New Residential Sales and Durable Goods.
Data Sources:
Bureau of Economic Analysis (BEA)
Congressional Budget Office (CBO)
U.S. Bureau of Labor Statistics (BLS)
Federal Reserve Economic Data (FRED Charts)
CME Fed Watch
U.S. Treasury – Yields
U.S. Census Bureau
Institute for Supply Management (ISM)
Weekly DOL Employment Data
BLS Monthly Jobs Report
JOLTS
US Energy Admin (EIA)
BLS Consumer Price Index CPI
BLS Producer Price Index PPI
Atlanta Fed GDPNOW
NY Fed Nowcast GDP
US Census Bureau Housing Starts
Consumer Credit
USCB Retail Sales
Construction Spending
Federal Reserve Dot Plots
NY Empire Index
Philadelphia Federal Reserve
P/E Ratio Data -Yardeni Research
Technical Analysis Info:
StockCharts.com – Financial Charts
Exponential vs Simple moving average
Other Links:
1973 Arab Oil Embargo
Hunt Brothers Silver
Long-Term Capital bailout


Week 11 Talking Points
Good Life Advisors – Talking Points – Week 11
Equities Rebounded Sharply this Week
After jumping 6% this week, the S&P 500 is still down 6% for the year.
The market put inits best week since November 2020 with help from a big four-day rally. Fixed income was mixed, with the curve flattening slightly the two-year treasury yield. The dollar was higher thanks to a big gain against the yen; the dollar pulled back on the euro, sterling, and commodity crosses. Gold was weaker, finishing down 2.8%. Oil logged its second consecutive weekly drop, with WTI settling down 5.7% amid a lot of headline volatility about a possible Ukraine ceasefire and some sense China’s Covid outbreak may be moderating.
The Fed finally raised for the first time since the 4th quarter of 2018, hiking by the expected 25bp and saying that ongoing increases may be appropriate. The Ukraine crisis remained much on the market’s mind this week, though there was little change in the situation on the ground other than Russia widening the scope of its largely stalled assault and increased global attention on rising civilian casualties. The market reacted positively to mid-week headlines suggesting there had been progress toward a ceasefire deal, but both sides later indicated that this had been overstated. While Ukrainian neutrality seems like it may be the cornerstone of any eventual deal, Ukraine this week continued to press the world for help, to which the US committed $800M in aid (including advances drone and missile systems).
China contributed multiple strands to this week’s market narrative. Biden spoke with China’s Xi for two hours on Friday, with some focus on Ukraine. Biden stressed the implications and consequences should China provide material support for Russia to conduct its attacks. There were also some signs of slackening in the country’s ongoing Covid surge, which has led to lockdowns in several industrial and tech hubs. But while China reiterated its support for a “zero Covid” approach, it also signaled some willingness to consider the economic and social impacts of its response. Finally, China tech stocks mounted a big rally after some significant recent weakness, helped by pledges of economic support from Beijing and some signs of progress on a cooperation plan with US regulators.
The marked digested several economic releases this week, including below-consensus readings for February PPI, both on the headline and core measures. February retail sales were weaker than forecast after a very strong February. On the housing front, February housing starts, and permits were higher than consensus, but existing-home sales posted a monthly drop, with the release flagging rising mortgage rates and sustained price increases.
Table of Contents
Fixed Income
The two-year yield continues to rise, closing this week just shy of 2%, its highest yield since May 2019.
March FOMC Statement Credit, Liquidity and Balance Sheet Federal Reserve Dot Plots
US Corporate Debt Tops 7 Trillion. Treasury.gov yields FOMC Policy Normalization Statement Longer Run Goals August 2020
Global Bond Yields
Foreign Exchange Market
Energy Complex
The Baker Hughes rig count was flat this week. There are 663 oil and gas rigs operating in the US- Up 252 over last year.
Metals Complex
Employment Picture
Weekly Unemployment Claims – Released Thursday 3/17/2022 – The week ending March 12th observed a decrease of 15k in initial claims declining to 214k. The four-week moving average of initial jobless claims decreased 8.75k to 223k.
Job Openings & Labor Turnover Survey JOLTS – Released 3/9/2022 – The U.S. Bureau of Labor Statistics reported the number and rate of job openings was little changed at 11.3 million on the last business day of January. Over the month, hires were little changed at 6.5 million and separations were little changed at 6.1 million. Within separations, the quits rate decreased to 2.8%. The layoffs and discharges rates were little changed at 0.9%.
February Jobs Report – BLS Summary Released 3/4/2022 – The U.S. economy added 678k nonfarm jobs in February and the Unemployment rate declined to 3.8%. Average hourly earnings were little changes at $31.58. Hiring highlights include +151k Leisure and Hospitality, +86k Professional and Business Services, and +61k Retail Trade.
Employment Cost Index – Released 1/28/2022 – Compensation costs for civilian workers increased 1.0% for the 3-month period ending in December 2021. The 12-month period ending in December 2021 saw compensation costs increase by 4%. The 12-month period ending December 2020 increased 2.5%. Wages and salaries increased 4.5% over the year and increased 2.6% for the 12-month period ending in December 2020. Benefit costs increased 2.8% over the year and increased 2.3% for the 12-month period ending in December 2020. This report is published quarterly.
This Week’s Economic Data
Links take you to the data source
Existing Home Sales – Released 3/18/2022 – Existing home sales decreased in February following an increase in January. Sales declined 7.2% to a seasonally adjusted rate of 6.02 million in February. Sales decreased 2.4% year-over-year. Housing inventory sits at 870k units. Up 2.4% from January’s inventory. Down 15.5% over last year. Unsold inventory sits at a 1.7-month supply. The median existing home price for all housing types was $357,300 which is up 15% from February. This marks 120 consecutive months of year-over-year increases, the longest-running streak on record.
Housing Starts – Released 3/17/2022 – New home starts in February were at a seasonally adjusted annual rate of 1.769 million; up 6.8% above January, and 22.3% above last January’s rate. Building permits were at a seasonally adjusted annual rate of 1.859 million, down 1.9% compared to January, but up 7.7% over last year.
Industrial Production and Capacity Utilization – Released 3/17/2022 – In February, Industrial production increased 0.5%. Manufacturing increased 1.2%. Utilities output declined 2.7%. MIning output increased 0.1%. Total industrial production was 7.5% higher in February than a year ago. Total capacity utilization increased 0.3% to 77.6% in February which is 1.9% below its long run average.
Retail Sales – Released 3/16/2022 – U.S. retail sales for February increased 0.3% to $658.1 billion and retail sales are 17.6% above February 2021. U.S. retail sales for the December 2021 through February 2022 period were up to 16% from the same period a year ago.
Producer Price Index – Released 3/15/2022 – The Producer Price Index for final demand increased 0.8% in February. PPI less food and energy increased 0.7% The change in PPI for final demand has increased 10% year/y.
Recent Economic Data
Links take you to the data source
Consumer Price Index – Released 3/10/2022 – Consumer prices rose 0.8% m/m in February following a 0.6% gain in January. Consumer prices are up 7.9% for the 12-month period ending in February. Core consumer prices increased 0.5% m/m in February following a 0.6% gain in January.
U.S. Trade Balance – Released 3/8/2022 – According to the U.S. Census Bureau of Economic Analysis the goods and services deficit increased in January by $7.7 billion to $89.7 billion. January exports were $224.4 billion, $3.9 billion less than December exports. January imports were $314.1 billion, $3.8 billion more than December imports. Year-over-year, the goods and services deficit increased $24.6 billion, or 37.7%, from January 2021. Exports increased $29.9 billion or 15.4%. Imports increased $54.4 billion or 21%.
Consumer Credit – Released 3/7/2022 – Consumer credit increased at a seasonally adjusted annual rate of 1.9% in January. Revolving credit decreased at an annual rate of 0.3%, while nonrevolving credit increased at an annual rate of 2.5%.
PMI Non-Manufacturing Index – Released 3/3/2022 – Economic activity in the non-manufacturing sector grew in January for the 21st consecutive month. ISM Non-Manufacturing registered 56.5%, which is 3.4 percentage points below the adjusted January reading of 59.9%.
PMI Manufacturing Index – Released 3/1/2022 – February PMI increased 1% to 58.6% up from January’s reading of 57.6%. The New Orders Index was 61.7% up 3.8% from January’s reading of 57.9%. The Production Index registered 58.5%, up 0.7%.
U.S. Construction Spending – Released 3/1/2022 – Construction spending increased 1.3% in January measuring at a seasonally adjusted annual rate of $1,677.2 billion. The January figure is 8.2% above the January 2021 estimate. Private construction spending was 1.5% above the revised December estimate at $1,326.5 billion. Public construction spending was 0.6% above the revised December estimate at $350.7 billion.
Chicago PMI – Released 2/28/2021 – Chicago PMI declined by 8.9 points in February to 56.3. This decline marks the first decline since November 2021. All five of the main five indicators fell, with New Orders and Supplier Deliveries taking the largest hit. Only Inventories edged up over the month.
US Light Vehicle Sales – Released 2/25/2022 – U.S. light vehicle sales were at a seasonally adjusted annual rate (SAAR) of 15.018 million units in January.
Personal Income – Released 2/25/2022 – Personal income increased $9 billion or 0.1% in January according to estimates released today by the Bureau of Economic Analysis. Disposable personal income (DPI) increased $19.8 billion or 0.1% and personal consumption expenditures (PCE) increased $337.2 billion or 2.1%.
Durable Goods – Released 2/25/2022 – New orders for manufactured durable goods in January increased $4.3 billion or 1.6% to $277.5 billion. Transportation equipment led the increase rising $3.3 billion or 3.4% to $87.6 billion.
Second Estimate of 4th Quarter 2021 GDP – Released 2/24/2022 – Real gross domestic product (GDP) increased at an annual rate of 7% in the fourth quarter of 2021, according to the second estimate released by the Bureau of Economic Analysis. GDP increased 2.3% in the third quarter of 2021. The second estimate is based on source data that are more complete than that of the advance estimate. The increase in real GDP primarily reflected increases in private inventory investment, exports, personal consumption expenditures (PCE), and nonresidential fixed investment that were partly offset by decreases in both federal and state and local government spending. Imports, which are a subtraction in the calculation of GDP, increased. The updated estimates primarily reflected upward revisions to nonresidential fixed investment, state and local government spending, and residential fixed investment that were partly offset by downward revisions to personal consumption expenditures (PCE) and exports.
New Residential Sales – Released 2/24/2022 – Sales of new single-family homes decreased 4.5% to 801k, seasonally adjusted, in January. The median sales price of new homes sold in January was $423,300 with an average sales price of %496,900. At the end of January, the seasonally adjusted estimate of new homes for sale was 406k. This represents a supply of 6.1 months at the current sales rate.
Consumer Confidence – Released 2/22/2022 – The Consumer confidence index decreased in February following a decrease in January. The Index now stands at 110.5, down from 111.1 in January.
Next week we get data on New Residential Sales and Durable Goods.
Data Sources:
Bureau of Economic Analysis (BEA)
Congressional Budget Office (CBO)
U.S. Bureau of Labor Statistics (BLS)
Federal Reserve Economic Data (FRED Charts)
CME Fed Watch
U.S. Treasury – Yields
U.S. Census Bureau
Institute for Supply Management (ISM)
Weekly DOL Employment Data
BLS Monthly Jobs Report
JOLTS
US Energy Admin (EIA)
BLS Consumer Price Index CPI
BLS Producer Price Index PPI
Atlanta Fed GDPNOW
NY Fed Nowcast GDP
US Census Bureau Housing Starts
Consumer Credit
USCB Retail Sales
Construction Spending
Federal Reserve Dot Plots
NY Empire Index
Philadelphia Federal Reserve
P/E Ratio Data -Yardeni Research
Technical Analysis Info:
StockCharts.com – Financial Charts
Exponential vs Simple moving average
Other Links:
1973 Arab Oil Embargo
Hunt Brothers Silver
Long-Term Capital bailout
Categories:
Tags: