Good Life Advisors – Talking Points – Week 13
Yield curve flattening was the biggest story of the week, with the 2Y/10Y inverting for the first time since 2019, while the 5Y/30Y spread inverting this week for the first time since 2006. In addition to the Fed policy outlook, the flattening also came as the bear market rally theme continued to gain traction. Goldman Sachs strategist David Kostin warned this week he expects a large number of negative earnings surprises in Q1 earnings, driven by profit growth weakness in consumer sectors, which are particularly exposed to inflation. However, JPMorgan’s Marko Kolanovic wrote this week that there’s too much negativity in the markets, arguing that equity and credit markets have historically fared well at the start of tightening cycles and that real rates are still extremely negative and thus stimulative.
The week’s headlines around Russia and Ukraine were fairly volatile. Earlier this week, Russia pledged to scale back its campaign in parts of the country. However, the prospects for a breakthrough were immediately met with skepticism. Russia’s attacks near Kyiv continued, though the latest reports indicated that Ukrainian forces stepped up their offensive against Russian units around the capital. Western officials have also continued to assess Russia’s next moves amid reports Moscow is trying to regroup for a major offensive in Donbas region. Peace talks resumed Friday.
Inflation, commodities, and energy prices remain key overhangs. President Biden announced this week that the US would release 1M bpd from the SPR as part of a coordinated release with Western countries and allies. Longer-dated oil futures rallied after the decision as traders see the move leading to higher prices in the future, while some expect the move to disincentivize production. Friday’s ISM Manufacturing headline print was weaker than expected though the prices index surged 11.5 points, the biggest gain since Dec-20. However, some economists have continued to argue that US consumer balance sheets remain healthy, offsetting the pinch from higher oil and gasoline prices.
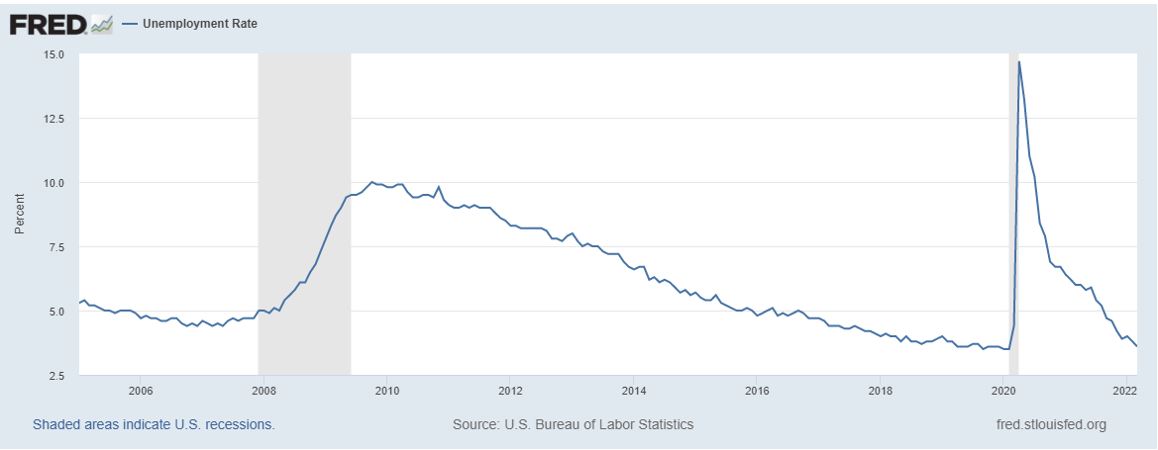
March nonfarm payrolls came in at 431K, weaker than consensus for 478K and a step-down from February’s upwardly revised 750K monthly pace (had been a big beat at the initial 678K reading). January also revised up to 504K from initial 481K. Release noted continued gains in leisure/hospitality, though this group still 1.5M below February 2020 employment levels. Retail employment, professional services other big gainers with both of those categories well above pre-pandemic levels. Unemployment rate registered 3.6%, lower than consensus for 3.7% and prior month’s 3.8%. Average hourly earnings up 0.4% m/m, in line with consensus but an uptick from February’s 0.1% pace. March labor force participation rate came in at 62.4% vs. 62.3% in February, hitting a new post-pandemic high. Average workweek dropped to 34.6 hours from prior month’s 34.8. Overall, report not that far off forecasts, still showing healthy job gains (though too early to show any pressure from rate hikes).
The major averages were little changed to modestly higher this week. S&P 500 and Nasdaq each edged out a third-straight weekly gain. Bond proxy REITs and utilities led the market, while defensive groups including food and beverages were better. Travel and leisure rallied this weeks with airlines and cruise lines among best performers. Big tech was mixed though software and internet/social media were higher. Other momentum/liquidity-oriented groups outperformed including cloud software, payments, fintech and solar. Semis were weaker amid cautious sell-side commentary. Retail was hit by factors including consumer concerns and ongoing margin and supply chain pressures. Home builders were hit by the highest mortgage rates since 2018. Energy followed crude lower, while materials were also weighed down by the week’s commodity selloff. Financials were the worst performing sector with banks down on the big curve flattening move. Treasuries were mostly weaker with the curve flattening and several key segments inverting. The dollar was weaker against the euro but firmer against yen and sterling. Gold finished down 1.6%. Bitcoin futures were up 4.5%. WTI crude ended down 12.8%, worst since Apr-20.

Fixed Income
March FOMC Statement Credit, Liquidity and Balance Sheet Federal Reserve Dot Plots US Corporate Debt Tops 7 Trillion. Treasury.gov yields FOMC Policy Normalization Statement Longer Run Goals August 2020
Foreign Exchange Market
Energy Complex
The Baker Hughes rig count gained 3 this week. There are 673 oil and gas rigs operating in the US – Up 243 over last year.
Metals Complex
Employment Picture
March Jobs Report – BLS Summary Released 4/1/2022 – The US Economy added 431k nonfarm jobs in March and the Unemployment rate declined to 3.6%. Average hourly earnings increased 13 to $31.73. Hiring highlights include +112k Leisure and Hospitality, +102k Professional and Business Services, +53k Education and Health Services, and +49k Retail Trade.
- Average hourly earnings increased 13 cents to $31.73.
- U3 unemployment rate declined 0.2% to 3.6%. U6 unemployment rate declined to 6.9%.
- The labor force participation rate was little changed at 62.4%.
- Average work week fell 0.1 hour to 34.6 hours.
Weekly Unemployment Claims – Released Thursday 3/31/2022 – The week ending March 26th observed an increase of 14k in initial claims increasing to 202k. The four-week moving average of initial jobless claims decreased 3.5k to 208.5k.
Job Openings & Labor Turnover Survey JOLTS – Released 3/29/2022 – The U.S. Bureau of Labor Statistics reported the number and rate of job openings was little changed at 11.3 million on the last business day of February. Over the month, hires increased 6.7 million and separations were little changed at 6.1 million. Within separations, the quits rate was little changed at 2.9%. The layoffs and discharges rates were unchanged at 0.9%.
Employment Cost Index – Released 1/28/2022 – Compensation costs for civilian workers increased 1.0% for the 3-month period ending in December 2021. The 12-month period ending in December 2021 saw compensation costs increase by 4.0%. The 12-month period ending December 2020 increased 2.5%. Wages and salaries increased 4.5 percent over the year and increased 2.6 percent for the 12-month period ending in December 2020. Benefit costs increased 2.8 percent over the year and increased 2.3 percent for the 12-month period ending in December 2020. This report is published quarterly.
This Week’s Economic Data
Links take you to the data source
PMI Manufacturing Index – Released 4/1/2022 – March PMI decreased 1.5% to 57.1% down from February’s reading of 58.6%. The New Orders Index was 53.8% down 7.9% from February’s reading of 61.7%. The Production Index registered 54.5%, down 4.0%.
U.S. Construction Spending – Released 4/1/2022 – Construction spending increased 0.5% in February measuring at a seasonally adjusted annual rate of $1,704.4 billion. The February figure is 11.2% above the February 2021 estimate. Private construction spending was 0.8% above the revised January estimate at $1,343.4 billion. Public construction spending was 0.4% below the revised January estimate at $350.7 billion.
Chicago PMI – Released 3/31/2022 – Chicago PMI increased by 6.6 points in March to 62.9. All five of the main five indicators increased.
US Light Vehicle Sales – Released 3/31/2022 – U.S. light vehicle sales were at a seasonally adjusted annual rate (SAAR) of 14.030 million units in February.
Personal Income – Released 3/31/2022 – Personal income increased $101.5 billion or 0.5 percent in February according to estimates released today by the Bureau of Economic Analysis. Disposable personal income (DPI) increased $76.1 billion or 0.4 percent and personal consumption expenditures (PCE) increased $34.9 billion or 0.2 percent.
Third Estimate of 4th Quarter 2021 GDP – Released 3/30/2022 – Real gross domestic product (GDP) increased at an annual rate of 6.9 percent in the fourth quarter of 2021, according to the third estimate released by the Bureau of Economic Analysis. GDP increased 2.3 percent in the third quarter of 2021. The third estimate is based on source data that are more complete than that of the second and advance estimates. The increase in real GDP primarily reflected increases in private inventory investment, exports, personal consumption expenditures (PCE), and nonresidential fixed investment that were partly offset by decreases in both federal and state and local government spending. Imports, which are a subtraction in the calculation of GDP, increased. The updated estimates primarily reflected upward revisions to nonresidential fixed investment, state and local government spending, and residential fixed investment that were partly offset by downward revisions to personal consumption expenditures (PCE) and exports. The downward revision in the third estimate primarily reflected downward revisions to personal consumption expenditures (PCE) and exports that were partly offset by an upward revision to private inventory investment.
Consumer Confidence – Released 3/29/2022 – The Consumer confidence index increased in March following a decrease in February. The Index now stands at 107.2, up from 105.7 in February.
Recent Economic Data
Links take you to the data source
Durable Goods – Released 3/24/2022 – New orders for manufactured durable goods in February decreased $6.0 billion or 2.2% to $271.5 billion. Transportation equipment led the decrease falling $4.9 billion or 5.6% to $82.6 billion.
New Residential Sales – Released 3/23/2022 – Sales of new single-family homes decreased 2.0% to 772k, seasonally adjusted, in February. The median sales price of new homes sold in February was $400,600 with an average sales price of $511,000. At the end of February, the seasonally adjusted estimate of new homes for sale was 407k. This represents a supply of 6.3 months at the current sales rate.
Existing Home Sales – Released 3/18/2022 – Existing home sales decreased in February following an increase in January. Sales declined 7.2% to a seasonally adjusted rate of 6.02 million in February. Sales decreased 2.4% year-over-year. Housing inventory sits at 870k units. Up 2.4% from January’s inventory. Down 15.5% over last year. Unsold inventory sits at a 1.7-month supply. The median existing home price for all housing types was $357,300 which is up 15.0% from February 2021. This marks 120 consecutive months of year-over-year increases, the longest-running streak on record.
Housing Starts – Released 3/17/2022 – New home starts in February were at a seasonally adjusted annual rate of 1.769 million; up 6.8% above January, and 22.3% above last January’s rate. Building Permits were at a seasonally adjusted annual rate of 1.859 million, down 1.9% compared to January, but up 7.7% over last year.
Industrial Production and Capacity Utilization – Released 3/17/2022 – In February Industrial production increased 0.5%. Manufacturing increased 1.2%. Utilities output declined 2.7%. Mining output increased 0.1%. Total industrial production was 7.5% higher in February than a year ago. Total capacity utilization increased 0.3% to 77.6% in February which is 1.9% below its long run average.
Retail Sales – Released 3/16/2022 – U.S. retail sales for February increased 0.3% to $658.1 billion and retail sales are 17.6% above February 2021. U.S. retail sales for the December 2021 through February 2022 period were up 16.0% from the same period a year ago.
Producer Price Index – Released 3/15/2022 – The Producer Price Index for final demand increased 0.8% in February. PPI less food and energy increased 0.7%. The change in PPI for final demand has increased 10.0% year/y.
Consumer Price Index – Released 3/10/2022 – Consumer prices rose 0.8% m/m in February following a 0.6% gain in January. Consumer prices are up 7.9% for the 12-month period ending in February. Core consumer prices increased 0.5% m/m in February following a 0.6% gain in January.
U.S. Trade Balance – Released 3/8/2022 – According to the U.S. Census Bureau of Economic Analysis the goods and services deficit increased in January by $7.7 billion to $89.7 billion. January exports were $224.4 billion, $3.9 billion less than December exports. January imports were $314.1 billion, $3.8 billion more than December imports. Year-over-year, the goods and services deficit increased $24.6 billion, or 37.7 percent, from January 2021. Exports increased $29.9 billion or 15.4 percent. Imports increased $54.4 billion or 21.0 percent.
Consumer Credit – Released 3/7/2022 – Consumer credit increased at a seasonally adjusted annual rate of 1.9 percent in January. Revolving credit decreased at an annual rate of 0.3 percent, while nonrevolving credit increased at an annual rate of 2.5 percent.
PMI Non-Manufacturing Index – Released 3/3/2022 – Economic activity in the non-manufacturing sector grew in January for the 21st consecutive month. ISM Non-Manufacturing registered 56.5 percent, which is 3.4 percentage points below the adjusted January reading of 59.9 percent.
Next week we get data on PMI Services, Consumer Credit, and the U.S. Trade Balance.
Data Sources:
Bureau of Economic Analysis (BEA)
Congressional Budget Office (CBO)
U.S. Bureau of Labor Statistics (BLS)
Federal Reserve Economic Data (FRED Charts)
CME Fed Watch
U.S. Treasury – Yields
U.S. Census Bureau
Institute for Supply Management (ISM)
Weekly DOL Employment Data
BLS Monthly Jobs Report
JOLTS
US Energy Admin (EIA)
BLS Consumer Price Index CPI
BLS Producer Price Index PPI
Atlanta Fed GDPNOW
NY Fed Nowcast GDP
US Census Bureau Housing Starts
Consumer Credit
USCB Retail Sales
Construction Spending
Federal Reserve Dot Plots
NY Empire Index
Philadelphia Federal Reserve
P/E Ratio Data -Yardeni Research
Technical Analysis Info:
StockCharts.com – Financial Charts
Exponential vs Simple moving average
Other Links:
1973 Arab Oil Embargo
Hunt Brothers Silver
Long-Term Capital bailout


Week 13 Talking Points
Good Life Advisors – Talking Points – Week 13
Yield curve flattening was the biggest story of the week, with the 2Y/10Y inverting for the first time since 2019, while the 5Y/30Y spread inverting this week for the first time since 2006. In addition to the Fed policy outlook, the flattening also came as the bear market rally theme continued to gain traction. Goldman Sachs strategist David Kostin warned this week he expects a large number of negative earnings surprises in Q1 earnings, driven by profit growth weakness in consumer sectors, which are particularly exposed to inflation. However, JPMorgan’s Marko Kolanovic wrote this week that there’s too much negativity in the markets, arguing that equity and credit markets have historically fared well at the start of tightening cycles and that real rates are still extremely negative and thus stimulative.
The week’s headlines around Russia and Ukraine were fairly volatile. Earlier this week, Russia pledged to scale back its campaign in parts of the country. However, the prospects for a breakthrough were immediately met with skepticism. Russia’s attacks near Kyiv continued, though the latest reports indicated that Ukrainian forces stepped up their offensive against Russian units around the capital. Western officials have also continued to assess Russia’s next moves amid reports Moscow is trying to regroup for a major offensive in Donbas region. Peace talks resumed Friday.
Inflation, commodities, and energy prices remain key overhangs. President Biden announced this week that the US would release 1M bpd from the SPR as part of a coordinated release with Western countries and allies. Longer-dated oil futures rallied after the decision as traders see the move leading to higher prices in the future, while some expect the move to disincentivize production. Friday’s ISM Manufacturing headline print was weaker than expected though the prices index surged 11.5 points, the biggest gain since Dec-20. However, some economists have continued to argue that US consumer balance sheets remain healthy, offsetting the pinch from higher oil and gasoline prices.
March nonfarm payrolls came in at 431K, weaker than consensus for 478K and a step-down from February’s upwardly revised 750K monthly pace (had been a big beat at the initial 678K reading). January also revised up to 504K from initial 481K. Release noted continued gains in leisure/hospitality, though this group still 1.5M below February 2020 employment levels. Retail employment, professional services other big gainers with both of those categories well above pre-pandemic levels. Unemployment rate registered 3.6%, lower than consensus for 3.7% and prior month’s 3.8%. Average hourly earnings up 0.4% m/m, in line with consensus but an uptick from February’s 0.1% pace. March labor force participation rate came in at 62.4% vs. 62.3% in February, hitting a new post-pandemic high. Average workweek dropped to 34.6 hours from prior month’s 34.8. Overall, report not that far off forecasts, still showing healthy job gains (though too early to show any pressure from rate hikes).
The major averages were little changed to modestly higher this week. S&P 500 and Nasdaq each edged out a third-straight weekly gain. Bond proxy REITs and utilities led the market, while defensive groups including food and beverages were better. Travel and leisure rallied this weeks with airlines and cruise lines among best performers. Big tech was mixed though software and internet/social media were higher. Other momentum/liquidity-oriented groups outperformed including cloud software, payments, fintech and solar. Semis were weaker amid cautious sell-side commentary. Retail was hit by factors including consumer concerns and ongoing margin and supply chain pressures. Home builders were hit by the highest mortgage rates since 2018. Energy followed crude lower, while materials were also weighed down by the week’s commodity selloff. Financials were the worst performing sector with banks down on the big curve flattening move. Treasuries were mostly weaker with the curve flattening and several key segments inverting. The dollar was weaker against the euro but firmer against yen and sterling. Gold finished down 1.6%. Bitcoin futures were up 4.5%. WTI crude ended down 12.8%, worst since Apr-20.
Table of Contents
Fixed Income
March FOMC Statement Credit, Liquidity and Balance Sheet Federal Reserve Dot Plots US Corporate Debt Tops 7 Trillion. Treasury.gov yields FOMC Policy Normalization Statement Longer Run Goals August 2020
Foreign Exchange Market
Energy Complex
The Baker Hughes rig count gained 3 this week. There are 673 oil and gas rigs operating in the US – Up 243 over last year.
Metals Complex
Employment Picture
March Jobs Report – BLS Summary Released 4/1/2022 – The US Economy added 431k nonfarm jobs in March and the Unemployment rate declined to 3.6%. Average hourly earnings increased 13 to $31.73. Hiring highlights include +112k Leisure and Hospitality, +102k Professional and Business Services, +53k Education and Health Services, and +49k Retail Trade.
Weekly Unemployment Claims – Released Thursday 3/31/2022 – The week ending March 26th observed an increase of 14k in initial claims increasing to 202k. The four-week moving average of initial jobless claims decreased 3.5k to 208.5k.
Job Openings & Labor Turnover Survey JOLTS – Released 3/29/2022 – The U.S. Bureau of Labor Statistics reported the number and rate of job openings was little changed at 11.3 million on the last business day of February. Over the month, hires increased 6.7 million and separations were little changed at 6.1 million. Within separations, the quits rate was little changed at 2.9%. The layoffs and discharges rates were unchanged at 0.9%.
Employment Cost Index – Released 1/28/2022 – Compensation costs for civilian workers increased 1.0% for the 3-month period ending in December 2021. The 12-month period ending in December 2021 saw compensation costs increase by 4.0%. The 12-month period ending December 2020 increased 2.5%. Wages and salaries increased 4.5 percent over the year and increased 2.6 percent for the 12-month period ending in December 2020. Benefit costs increased 2.8 percent over the year and increased 2.3 percent for the 12-month period ending in December 2020. This report is published quarterly.
This Week’s Economic Data
Links take you to the data source
PMI Manufacturing Index – Released 4/1/2022 – March PMI decreased 1.5% to 57.1% down from February’s reading of 58.6%. The New Orders Index was 53.8% down 7.9% from February’s reading of 61.7%. The Production Index registered 54.5%, down 4.0%.
U.S. Construction Spending – Released 4/1/2022 – Construction spending increased 0.5% in February measuring at a seasonally adjusted annual rate of $1,704.4 billion. The February figure is 11.2% above the February 2021 estimate. Private construction spending was 0.8% above the revised January estimate at $1,343.4 billion. Public construction spending was 0.4% below the revised January estimate at $350.7 billion.
Chicago PMI – Released 3/31/2022 – Chicago PMI increased by 6.6 points in March to 62.9. All five of the main five indicators increased.
US Light Vehicle Sales – Released 3/31/2022 – U.S. light vehicle sales were at a seasonally adjusted annual rate (SAAR) of 14.030 million units in February.
Personal Income – Released 3/31/2022 – Personal income increased $101.5 billion or 0.5 percent in February according to estimates released today by the Bureau of Economic Analysis. Disposable personal income (DPI) increased $76.1 billion or 0.4 percent and personal consumption expenditures (PCE) increased $34.9 billion or 0.2 percent.
Third Estimate of 4th Quarter 2021 GDP – Released 3/30/2022 – Real gross domestic product (GDP) increased at an annual rate of 6.9 percent in the fourth quarter of 2021, according to the third estimate released by the Bureau of Economic Analysis. GDP increased 2.3 percent in the third quarter of 2021. The third estimate is based on source data that are more complete than that of the second and advance estimates. The increase in real GDP primarily reflected increases in private inventory investment, exports, personal consumption expenditures (PCE), and nonresidential fixed investment that were partly offset by decreases in both federal and state and local government spending. Imports, which are a subtraction in the calculation of GDP, increased. The updated estimates primarily reflected upward revisions to nonresidential fixed investment, state and local government spending, and residential fixed investment that were partly offset by downward revisions to personal consumption expenditures (PCE) and exports. The downward revision in the third estimate primarily reflected downward revisions to personal consumption expenditures (PCE) and exports that were partly offset by an upward revision to private inventory investment.
Consumer Confidence – Released 3/29/2022 – The Consumer confidence index increased in March following a decrease in February. The Index now stands at 107.2, up from 105.7 in February.
Recent Economic Data
Links take you to the data source
Durable Goods – Released 3/24/2022 – New orders for manufactured durable goods in February decreased $6.0 billion or 2.2% to $271.5 billion. Transportation equipment led the decrease falling $4.9 billion or 5.6% to $82.6 billion.
New Residential Sales – Released 3/23/2022 – Sales of new single-family homes decreased 2.0% to 772k, seasonally adjusted, in February. The median sales price of new homes sold in February was $400,600 with an average sales price of $511,000. At the end of February, the seasonally adjusted estimate of new homes for sale was 407k. This represents a supply of 6.3 months at the current sales rate.
Existing Home Sales – Released 3/18/2022 – Existing home sales decreased in February following an increase in January. Sales declined 7.2% to a seasonally adjusted rate of 6.02 million in February. Sales decreased 2.4% year-over-year. Housing inventory sits at 870k units. Up 2.4% from January’s inventory. Down 15.5% over last year. Unsold inventory sits at a 1.7-month supply. The median existing home price for all housing types was $357,300 which is up 15.0% from February 2021. This marks 120 consecutive months of year-over-year increases, the longest-running streak on record.
Housing Starts – Released 3/17/2022 – New home starts in February were at a seasonally adjusted annual rate of 1.769 million; up 6.8% above January, and 22.3% above last January’s rate. Building Permits were at a seasonally adjusted annual rate of 1.859 million, down 1.9% compared to January, but up 7.7% over last year.
Industrial Production and Capacity Utilization – Released 3/17/2022 – In February Industrial production increased 0.5%. Manufacturing increased 1.2%. Utilities output declined 2.7%. Mining output increased 0.1%. Total industrial production was 7.5% higher in February than a year ago. Total capacity utilization increased 0.3% to 77.6% in February which is 1.9% below its long run average.
Retail Sales – Released 3/16/2022 – U.S. retail sales for February increased 0.3% to $658.1 billion and retail sales are 17.6% above February 2021. U.S. retail sales for the December 2021 through February 2022 period were up 16.0% from the same period a year ago.
Producer Price Index – Released 3/15/2022 – The Producer Price Index for final demand increased 0.8% in February. PPI less food and energy increased 0.7%. The change in PPI for final demand has increased 10.0% year/y.
Consumer Price Index – Released 3/10/2022 – Consumer prices rose 0.8% m/m in February following a 0.6% gain in January. Consumer prices are up 7.9% for the 12-month period ending in February. Core consumer prices increased 0.5% m/m in February following a 0.6% gain in January.
U.S. Trade Balance – Released 3/8/2022 – According to the U.S. Census Bureau of Economic Analysis the goods and services deficit increased in January by $7.7 billion to $89.7 billion. January exports were $224.4 billion, $3.9 billion less than December exports. January imports were $314.1 billion, $3.8 billion more than December imports. Year-over-year, the goods and services deficit increased $24.6 billion, or 37.7 percent, from January 2021. Exports increased $29.9 billion or 15.4 percent. Imports increased $54.4 billion or 21.0 percent.
Consumer Credit – Released 3/7/2022 – Consumer credit increased at a seasonally adjusted annual rate of 1.9 percent in January. Revolving credit decreased at an annual rate of 0.3 percent, while nonrevolving credit increased at an annual rate of 2.5 percent.
PMI Non-Manufacturing Index – Released 3/3/2022 – Economic activity in the non-manufacturing sector grew in January for the 21st consecutive month. ISM Non-Manufacturing registered 56.5 percent, which is 3.4 percentage points below the adjusted January reading of 59.9 percent.
Next week we get data on PMI Services, Consumer Credit, and the U.S. Trade Balance.
Data Sources:
Bureau of Economic Analysis (BEA)
Congressional Budget Office (CBO)
U.S. Bureau of Labor Statistics (BLS)
Federal Reserve Economic Data (FRED Charts)
CME Fed Watch
U.S. Treasury – Yields
U.S. Census Bureau
Institute for Supply Management (ISM)
Weekly DOL Employment Data
BLS Monthly Jobs Report
JOLTS
US Energy Admin (EIA)
BLS Consumer Price Index CPI
BLS Producer Price Index PPI
Atlanta Fed GDPNOW
NY Fed Nowcast GDP
US Census Bureau Housing Starts
Consumer Credit
USCB Retail Sales
Construction Spending
Federal Reserve Dot Plots
NY Empire Index
Philadelphia Federal Reserve
P/E Ratio Data -Yardeni Research
Technical Analysis Info:
StockCharts.com – Financial Charts
Exponential vs Simple moving average
Other Links:
1973 Arab Oil Embargo
Hunt Brothers Silver
Long-Term Capital bailout
Categories:
Tags: