Global Growth Worries Abound
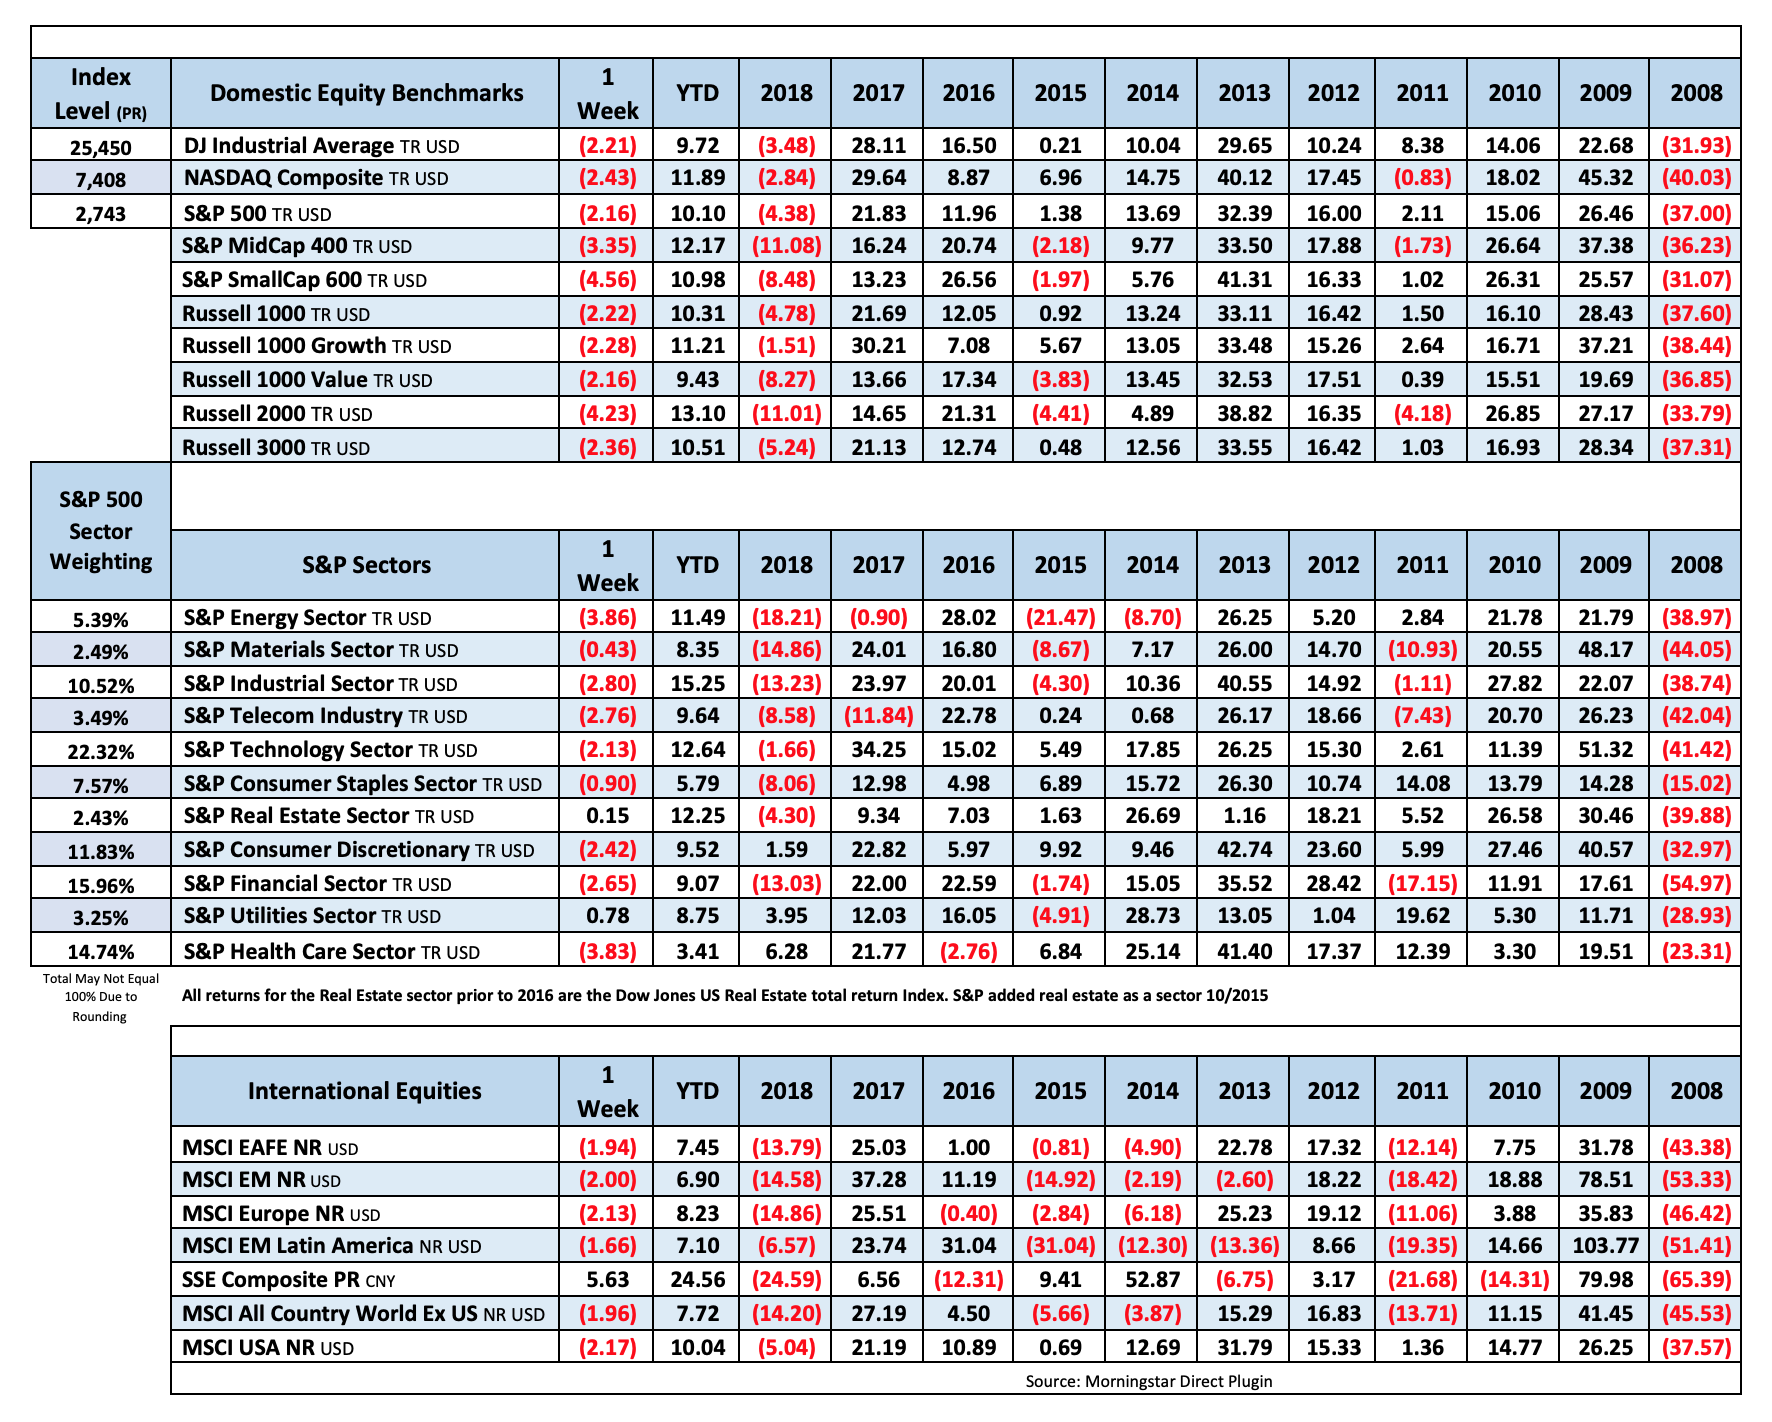
Worries about faltering global growth intensified this week sending the S&P500 lower all five trading days. This marked the worst week of the year as all the major US markets were down over two percent. Among the global worries; China lowered its 2019 GDP growth forecast to 6.0%-6.5% from 6.5% Monday, and announced some tax cuts in a bid to contend with a “tough economic battle ahead.” On Wednesday the OECD cut its global GDP growth forecast for 2019 to 3.3% from 3.5%. The European Central Bank on Thursday cut its forecasts for almost every major global economy. ECB President Mario Draghi said the euro-zone economy will now expand only 1.1% this year, a drop of 0.6 percentage points from forecasts just three months ago. He also announced a new round of monetary stimulus in a bid to shore up the weakening economy. The key statement from Draghi:
“The persistence of uncertainties related to geopolitical factors, the threat of protectionism and vulnerabilities in emerging markets appears to be leaving marks on economic sentiment,” Draghi told journalists in Frankfurt on Thursday. “The risks surrounding the euro area growth outlook are still tilted to the downside.”
Topping off the worries this week, payroll numbers on Friday showed the US economy added just 20,000 nonfarm jobs in February, coming in well below expectations of 140k+. Job growth has averaged 235k over the prior 12 months.
The BLS also reported Friday that the U3 unemployment rate declined to 3.8% and the U6 falling to 7.3%. Average hourly earnings increased by 0.40% in February with y/y hourly earnings up 3.4%. The labor force participation rate held steady at 63.2%.
The December Trade Balance fell to a deficit of 59.8 billion marking the largest deficit since October 2008. The one brighter spot was housing, with US new home sales increasing 3.7% month/m.
Ahead this week the British House of Commons votes on a revised Brexit deal and we see important economic data including, Retail Sales, CPI and PPI.
Fixed Income
New York Fed President Jon Williams (FOMC voter), this week, suggested a “new normal” of slow growth on the order of 2% will keep the Fed patient on raising rates

FOMC January Statement Federal Reserve Dot Plots Dec 18 US Debt Measurement– January Meeting Minutes US Corporate Debt Tops $6 Trillion. Treasury.gov yields
Global Bond Yields
The Federal Reserve decreased their total holdings by 10.5% over the last year. $4.435 Trillion to $3.969 Trillion.
https://fred.stlouisfed.org/graph/?g=n9BM
Foreign Exchange Market
The Dollar index made an 18 month high Thursday at 97.62. The USD has been gaining strength despite concerns over the US economy.
Energy Complex
The Baker Hughes rig count declined by 11 this week. There are 1027 oil and gas rigs operating in the US – Up 43 over last year.
- Brent Crude Oil gained 1.03% this week closing at $65.74/bbl
- WTI Crude Oil gained 0.48% this week to close at $56.07/bbl
- Heating Oil declined 0.06% this week closing at $2.00/gallon
- Natural Gas gained 0.21% this week closing at $2.87 per million BTUs
- Unleaded Gas gained 4.13% this week closing at $1.80/gallon
Metals Complex
Gold fell this week by 2.52% sending Gold back under $1300/oz to $1299.20/oz.
-
-
- Gold rose just 0.1% this week closing at $1299.30/oz
- Silver gained 0.61% on the week closing at $15.35/oz
- Palladium fell 3.10% this week closing at $1489.00/oz
- Platinum declined 5.34% this week closing at 817.60/oz
- Copper lost 1.31% this week closing at $2.89/lb
Employment Picture
The February Jobs Report provided a modest increase of 20,000 nonfarm jobs. This modest increase comes after 12 months of job growth averaging 235,000 per month.
February Jobs Report – BLS Summary Released 3/8 – The US Economy added 20k nonfarm jobs in February and the Unemployment rate declined to 3.8%. February’s 20k increase in nonfarm jobs is a little change, given the job growth has averaged 235k over the prior 12 months. The January report was revised up 7k. Average hourly earnings increased by 11 cents. Hiring highlights include Professional and Business services +42k, Health Care +21k, Wholesale trade +11k, Construction -31k, and Retail Trade -6k.
- Average hourly earnings increased by 11 cents/ 0.40% in February y/y hourly earnings are up 3.4%.
- U3 unemployment edged downward by 0.2 to 3.8%. The U6 unemployment rate decreased by 0.8 at 7.3%.
- The labor force participation rate held steady at 63.2%.
- Average workweek decreased slightly by 0.1 hours to 34.4 hours.
Weekly Unemployment Claims – Released Thursday 3/7 – In the week ending March 2nd, initial claims were 223,000 a decrease of 3,000 from the previous week’s revised level. The 4-week moving average was 226,250, a decrease of 3,000 from the previous week’s revised average.
Job Openings & Labor Turnover Survey – JOLTS – Released Tuesday 2/12 – The number of job openings increased to a series high of 7.3 million on the last business day of December, the U.S. Bureau of Labor Statistics reported. Over the month, hires were little changed at 5.9 million, quits increased slightly to 3.5 million, and total separations were little changed at 5.5 million. Within separations, the quits rate and the layoffs and discharges rates were unchanged at 2.3 percent and 1.1 percent, respectively.
This Week’s Economic Data
Links take you to the data source
PMI Manufacturing ISM Index – Released 3/1 – February PMI decreased 2.4% to 54.2% from January’s reading of 56.6%. The New Orders Index was down 2.7% from the January reading of 58.2% to 55.5% for February. The Production Index registered 54.8% down 5.7%.
Personal Income – Released 3/1 – Personal Income decreased 0.1% in January after seeing a 0.1% increase in December according to the BEA. The majority of the increase in December was due to increases in personal dividend income, compensation of employees, and farm proprietors’ income. The decrease in January was primarily reflected by decreases in personal dividend income, farm proprietors’ income, and personal interest income. Real PCE (the Feds preferred inflation gauge) decreased by 0.6% in December and increased by 2.6% in 2018. Real disposable personal income increased by 1.0% for December and increased by 2.9% for 2019.
Chicago PMI – Released 2/28 – Chicago PMI increased by 8 points in February rising to 64.7, up from 56.7 in January. The Prices Paid indicator saw its first increase in 7 months easing the downward pressure seen on prices through the second half of last year. The Prices Paid indicator is up 6.6% y/y.
1st Estimate of 4th Quarter GDP – Released 2/28 – According to the first estimate released by the Bureau of Economic Analysis, Real Gross Domestic Product (Real GDP) increased at an annual rate of 2.6% in the fourth quarter of 2018 surpassing expectations. The increase in real GDP reflected positive contributions from personal consumption expenditures, nonresidential fixed investment, and state and local gov’t spending. Negative contributions included imports which increased in the fourth quarter.
Consumer Confidence – Released 2/26 – The Consumer confidence index increased in February. The Index now shows a reading of 131.4 up from 121.7 in January. Consumer confidence levels have rebounded after three months of decline. Expectations in recent months had declined due to financial market volatility and the government shutdown. Consumer confidence levels suggest consumers expect the economy to continue to expand as consumers continue to view both business and labor market conditions favorably. The pace of expansion of the economy is expected to moderate in 2019 however.
Housing Starts – Released 2/26 – New home starts in December were at a seasonally adjusted rate of 1.078 million; down 11.2% below November and down 10.9% below last December’s rate. Building Permits were at a seasonally adjusted rate of 1.326 million, up 0.3% compared to November and up 0.5% over last year.
https://fred.stlouisfed.org/graph/?g=lSNf
Employment Cost Index – Released 1/31/19 – Compensation costs for civilian workers increased by 2.9% for the 12-month period ending in December 2018 compared with a compensation costs increase of 2.6% in December 2017. Wages and salaries were up 3.1%, versus 2.5% for the 12-month period ending December 2017. Benefit costs increased by 2.8%, versus 2.5% in December 2017. For private industry workers, compensation costs increased 3.0% year-over-year, versus 2.6% for the 12 months ending December 2017. Wages and salaries increased 3.1% year-over-year, versus 2.8% for the 12 months ending December 2017. Benefit costs increased by 2.6%, versus 2.3% for the 12 months ending December 2017. This report is published quarterly.
Consumer Credit – Released 3/7 – Consumer credit increased at a seasonally adjusted annual rate of 5.0% in January. Revolving and nonrevolving credit increased by 3.0% and 6.0% respectively.
U.S. Trade Balance – Released 3/6 – The U.S. Trade deficit was $59.8 billion in December, up $9.5 billion from $50.3 billion in November. December exports were $205.1 billion, $3.9 billion less than November exports. December imports were $264.9 billion, $5.5 billion more than November imports. The goods and services deficit increased $68.8 billion in 2018 or 12.5% from 2017. Exports and imports increased $148.9 billion or 6.3% and $217.7 billion or 7.5% respectively.
Recent Economic Data
Links take you to the data source
PMI Manufacturing ISM Index – Released 3/1 – February PMI decreased 2.4% to 54.2% from January’s reading of 56.6%. The New Orders Index was down 2.7% from the January reading of 58.2% to 55.5% for February. The Production Index registered 54.8% down 5.7%.
Personal Income – Released 3/1 – Personal Income decreased 0.1% in January after seeing a 0.1% increase in December according to the BEA. The majority of the increase in December was due to increases in personal dividend income, compensation of employees, and farm proprietors’ income. The decrease in January was primarily reflected by decreases in personal dividend income, farm proprietors’ income, and personal interest income. Real PCE (the Feds preferred inflation gauge) decreased by 0.6% in December and increased by 2.6% in 2018. Real disposable personal income increased by 1.0% for December and increased by 2.9% for 2019.
Chicago PMI – Released 2/28 – Chicago PMI increased by 8 points in February rising to 64.7, up from 56.7 in January. The Prices Paid indicator saw its first increase in 7 months easing the downward pressure seen on prices through the second half of last year. The Prices Paid indicator is up 6.6% y/y.
1st Estimate of 4th Quarter GDP – Released 2/28 – According to the first estimate released by the Bureau of Economic Analysis, Real Gross Domestic Product (Real GDP) increased at an annual rate of 2.6% in the fourth quarter of 2018 surpassing expectations. The increase in real GDP reflected positive contributions from personal consumption expenditures, nonresidential fixed investment, and state and local gov’t spending. Negative contributions included imports which increased in the fourth quarter.
Consumer Confidence – Released 2/26 – The Consumer confidence index increased in February. The Index now shows a reading of 131.4 up from 121.7 in January. Consumer confidence levels have rebounded after three months of decline. Expectations in recent months had declined due to financial market volatility and the government shutdown. Consumer confidence levels suggest consumers expect the economy to continue to expand as consumers continue to view both business and labor market conditions favorably. The pace of expansion of the economy is expected to moderate in 2019 however.
Housing Starts – Released 2/26 – New home starts in December were at a seasonally adjusted rate of 1.078 million; down 11.2% below November and down 10.9% below last December’s rate. Building Permits were at a seasonally adjusted rate of 1.326 million, up 0.3% compared to November and up 0.5% over last year.
Existing Home Sales – Released 2/21 – Existing home sales decreased by 1.2% in January. Sales decreased to a seasonally adjusted rate of 4.94 million. Sales are currently down 8.5% from one year ago. Housing inventory increased to 3.9 months of inventory and the existing homes for sale declined to 1.59 million. The median sales price for all types of homes was $247,500, up 2.8% year/y.
Durable Goods – Released 2/21 – New orders for manufactured durable goods increased $3.0 billion or 1.2% to $254.4 billion in December. This increase makes two consecutive months of gains. Transportation equipment, up 3.3%, drove the increase by $2.8 billion to $90.2 billion.
Industrial Production and Capacity Utilization – Released 2/15 – Industrial production declined by 0.6% in January following a 0.1% increase in December. Manufacturing output was also on the decline falling by 0.9%. The decline resulted primarily from a large drop in motor vehicle assemblies. Capacity utilization declined 0.6% to78.2%. Utilization is 1.6% below its long-run (1972-2018) average.
Retail Sales – Released 2/14 – U.S. retail sales for December 2018, were $505.8 billion, a decrease of 1.2% from the previous month, but 2.3% above December 2017. Total sales for the 12 months of 2018 were up 5.0%.
Producer Price Index – Released 2/14 – The Producer Price Index for final demand declined 0.1% in January. Core PPI (less food and energy) increased by 0.3%. Year over year the index for final demand rose 2.0%.
Consumer Price Index – Released 2/13 – The Consumer Price Index was unchanged in January. Core CPI, which excludes food and energy increased 0.2%. The monthly changes left total CPI up 1.6% year-over-year and core CPI up 2.2%.
Next week we get data on the Consumer Price Index, the Producer Price Index, Retail Sales, Industrial Production and Capacity Utilization, and JOLTS. Due to delays from the recent gov’t shutdown, we will also see again New Residential Sales and Construction Spending.
Data Sources:
Bureau of Economic Analysis (BEA)
Congressional Budget Office (CBO)
U.S. Bureau of Labor Statistics (BLS)
Federal Reserve Economic Data (FRED Charts)
CME Fed Watch
U.S. Treasury – Yields
U.S. Census Bureau
Institute for Supply Management (ISM)
Weekly DOL Employment Data
BLS Monthly Jobs Report
JOLTS
US Energy Admn (EIA)
BLS Consumer Price Index CPI
BLS Producer Price Index PPI
Atlanta Fed GDPNOW
NY Fed Nowcast GDP
US Census Bureau Housing Starts
Consumer Credit
USCB Retail Sales
Construction Spending
Federal Reserve Dot Plots
NY Empire Index
Philadelphia Federal Reserve
P/E Ratio Data -Yardeni Research
Technical Analysis Info:
StockCharts.com – Financial Charts
Exponential vs Simple moving average
Other Links:
1973 Arab Oil Embargo
Hunt Brothers Silver
Long-Term Capital bailout


Week 10 Talking Points #10
Global Growth Worries Abound
Worries about faltering global growth intensified this week sending the S&P500 lower all five trading days. This marked the worst week of the year as all the major US markets were down over two percent. Among the global worries; China lowered its 2019 GDP growth forecast to 6.0%-6.5% from 6.5% Monday, and announced some tax cuts in a bid to contend with a “tough economic battle ahead.” On Wednesday the OECD cut its global GDP growth forecast for 2019 to 3.3% from 3.5%. The European Central Bank on Thursday cut its forecasts for almost every major global economy. ECB President Mario Draghi said the euro-zone economy will now expand only 1.1% this year, a drop of 0.6 percentage points from forecasts just three months ago. He also announced a new round of monetary stimulus in a bid to shore up the weakening economy. The key statement from Draghi:
Topping off the worries this week, payroll numbers on Friday showed the US economy added just 20,000 nonfarm jobs in February, coming in well below expectations of 140k+. Job growth has averaged 235k over the prior 12 months.
The BLS also reported Friday that the U3 unemployment rate declined to 3.8% and the U6 falling to 7.3%. Average hourly earnings increased by 0.40% in February with y/y hourly earnings up 3.4%. The labor force participation rate held steady at 63.2%.
The December Trade Balance fell to a deficit of 59.8 billion marking the largest deficit since October 2008. The one brighter spot was housing, with US new home sales increasing 3.7% month/m.
Ahead this week the British House of Commons votes on a revised Brexit deal and we see important economic data including, Retail Sales, CPI and PPI.
Table of Contents
Fixed Income
New York Fed President Jon Williams (FOMC voter), this week, suggested a “new normal” of slow growth on the order of 2% will keep the Fed patient on raising rates
FOMC January Statement Federal Reserve Dot Plots Dec 18 US Debt Measurement– January Meeting Minutes US Corporate Debt Tops $6 Trillion. Treasury.gov yields
Global Bond Yields
The Federal Reserve decreased their total holdings by 10.5% over the last year. $4.435 Trillion to $3.969 Trillion.
https://fred.stlouisfed.org/graph/?g=n9BM
Foreign Exchange Market
The Dollar index made an 18 month high Thursday at 97.62. The USD has been gaining strength despite concerns over the US economy.
Energy Complex
The Baker Hughes rig count declined by 11 this week. There are 1027 oil and gas rigs operating in the US – Up 43 over last year.
Metals Complex
Gold fell this week by 2.52% sending Gold back under $1300/oz to $1299.20/oz.
Employment Picture
The February Jobs Report provided a modest increase of 20,000 nonfarm jobs. This modest increase comes after 12 months of job growth averaging 235,000 per month.
February Jobs Report – BLS Summary Released 3/8 – The US Economy added 20k nonfarm jobs in February and the Unemployment rate declined to 3.8%. February’s 20k increase in nonfarm jobs is a little change, given the job growth has averaged 235k over the prior 12 months. The January report was revised up 7k. Average hourly earnings increased by 11 cents. Hiring highlights include Professional and Business services +42k, Health Care +21k, Wholesale trade +11k, Construction -31k, and Retail Trade -6k.
Weekly Unemployment Claims – Released Thursday 3/7 – In the week ending March 2nd, initial claims were 223,000 a decrease of 3,000 from the previous week’s revised level. The 4-week moving average was 226,250, a decrease of 3,000 from the previous week’s revised average.
Job Openings & Labor Turnover Survey – JOLTS – Released Tuesday 2/12 – The number of job openings increased to a series high of 7.3 million on the last business day of December, the U.S. Bureau of Labor Statistics reported. Over the month, hires were little changed at 5.9 million, quits increased slightly to 3.5 million, and total separations were little changed at 5.5 million. Within separations, the quits rate and the layoffs and discharges rates were unchanged at 2.3 percent and 1.1 percent, respectively.
This Week’s Economic Data
Links take you to the data source
PMI Manufacturing ISM Index – Released 3/1 – February PMI decreased 2.4% to 54.2% from January’s reading of 56.6%. The New Orders Index was down 2.7% from the January reading of 58.2% to 55.5% for February. The Production Index registered 54.8% down 5.7%.
Personal Income – Released 3/1 – Personal Income decreased 0.1% in January after seeing a 0.1% increase in December according to the BEA. The majority of the increase in December was due to increases in personal dividend income, compensation of employees, and farm proprietors’ income. The decrease in January was primarily reflected by decreases in personal dividend income, farm proprietors’ income, and personal interest income. Real PCE (the Feds preferred inflation gauge) decreased by 0.6% in December and increased by 2.6% in 2018. Real disposable personal income increased by 1.0% for December and increased by 2.9% for 2019.
Chicago PMI – Released 2/28 – Chicago PMI increased by 8 points in February rising to 64.7, up from 56.7 in January. The Prices Paid indicator saw its first increase in 7 months easing the downward pressure seen on prices through the second half of last year. The Prices Paid indicator is up 6.6% y/y.
1st Estimate of 4th Quarter GDP – Released 2/28 – According to the first estimate released by the Bureau of Economic Analysis, Real Gross Domestic Product (Real GDP) increased at an annual rate of 2.6% in the fourth quarter of 2018 surpassing expectations. The increase in real GDP reflected positive contributions from personal consumption expenditures, nonresidential fixed investment, and state and local gov’t spending. Negative contributions included imports which increased in the fourth quarter.
Consumer Confidence – Released 2/26 – The Consumer confidence index increased in February. The Index now shows a reading of 131.4 up from 121.7 in January. Consumer confidence levels have rebounded after three months of decline. Expectations in recent months had declined due to financial market volatility and the government shutdown. Consumer confidence levels suggest consumers expect the economy to continue to expand as consumers continue to view both business and labor market conditions favorably. The pace of expansion of the economy is expected to moderate in 2019 however.
Housing Starts – Released 2/26 – New home starts in December were at a seasonally adjusted rate of 1.078 million; down 11.2% below November and down 10.9% below last December’s rate. Building Permits were at a seasonally adjusted rate of 1.326 million, up 0.3% compared to November and up 0.5% over last year.
https://fred.stlouisfed.org/graph/?g=lSNf
Employment Cost Index – Released 1/31/19 – Compensation costs for civilian workers increased by 2.9% for the 12-month period ending in December 2018 compared with a compensation costs increase of 2.6% in December 2017. Wages and salaries were up 3.1%, versus 2.5% for the 12-month period ending December 2017. Benefit costs increased by 2.8%, versus 2.5% in December 2017. For private industry workers, compensation costs increased 3.0% year-over-year, versus 2.6% for the 12 months ending December 2017. Wages and salaries increased 3.1% year-over-year, versus 2.8% for the 12 months ending December 2017. Benefit costs increased by 2.6%, versus 2.3% for the 12 months ending December 2017. This report is published quarterly.
Consumer Credit – Released 3/7 – Consumer credit increased at a seasonally adjusted annual rate of 5.0% in January. Revolving and nonrevolving credit increased by 3.0% and 6.0% respectively.
U.S. Trade Balance – Released 3/6 – The U.S. Trade deficit was $59.8 billion in December, up $9.5 billion from $50.3 billion in November. December exports were $205.1 billion, $3.9 billion less than November exports. December imports were $264.9 billion, $5.5 billion more than November imports. The goods and services deficit increased $68.8 billion in 2018 or 12.5% from 2017. Exports and imports increased $148.9 billion or 6.3% and $217.7 billion or 7.5% respectively.
Recent Economic Data
Links take you to the data source
PMI Manufacturing ISM Index – Released 3/1 – February PMI decreased 2.4% to 54.2% from January’s reading of 56.6%. The New Orders Index was down 2.7% from the January reading of 58.2% to 55.5% for February. The Production Index registered 54.8% down 5.7%.
Personal Income – Released 3/1 – Personal Income decreased 0.1% in January after seeing a 0.1% increase in December according to the BEA. The majority of the increase in December was due to increases in personal dividend income, compensation of employees, and farm proprietors’ income. The decrease in January was primarily reflected by decreases in personal dividend income, farm proprietors’ income, and personal interest income. Real PCE (the Feds preferred inflation gauge) decreased by 0.6% in December and increased by 2.6% in 2018. Real disposable personal income increased by 1.0% for December and increased by 2.9% for 2019.
Chicago PMI – Released 2/28 – Chicago PMI increased by 8 points in February rising to 64.7, up from 56.7 in January. The Prices Paid indicator saw its first increase in 7 months easing the downward pressure seen on prices through the second half of last year. The Prices Paid indicator is up 6.6% y/y.
1st Estimate of 4th Quarter GDP – Released 2/28 – According to the first estimate released by the Bureau of Economic Analysis, Real Gross Domestic Product (Real GDP) increased at an annual rate of 2.6% in the fourth quarter of 2018 surpassing expectations. The increase in real GDP reflected positive contributions from personal consumption expenditures, nonresidential fixed investment, and state and local gov’t spending. Negative contributions included imports which increased in the fourth quarter.
Consumer Confidence – Released 2/26 – The Consumer confidence index increased in February. The Index now shows a reading of 131.4 up from 121.7 in January. Consumer confidence levels have rebounded after three months of decline. Expectations in recent months had declined due to financial market volatility and the government shutdown. Consumer confidence levels suggest consumers expect the economy to continue to expand as consumers continue to view both business and labor market conditions favorably. The pace of expansion of the economy is expected to moderate in 2019 however.
Housing Starts – Released 2/26 – New home starts in December were at a seasonally adjusted rate of 1.078 million; down 11.2% below November and down 10.9% below last December’s rate. Building Permits were at a seasonally adjusted rate of 1.326 million, up 0.3% compared to November and up 0.5% over last year.
Existing Home Sales – Released 2/21 – Existing home sales decreased by 1.2% in January. Sales decreased to a seasonally adjusted rate of 4.94 million. Sales are currently down 8.5% from one year ago. Housing inventory increased to 3.9 months of inventory and the existing homes for sale declined to 1.59 million. The median sales price for all types of homes was $247,500, up 2.8% year/y.
Durable Goods – Released 2/21 – New orders for manufactured durable goods increased $3.0 billion or 1.2% to $254.4 billion in December. This increase makes two consecutive months of gains. Transportation equipment, up 3.3%, drove the increase by $2.8 billion to $90.2 billion.
Industrial Production and Capacity Utilization – Released 2/15 – Industrial production declined by 0.6% in January following a 0.1% increase in December. Manufacturing output was also on the decline falling by 0.9%. The decline resulted primarily from a large drop in motor vehicle assemblies. Capacity utilization declined 0.6% to78.2%. Utilization is 1.6% below its long-run (1972-2018) average.
Retail Sales – Released 2/14 – U.S. retail sales for December 2018, were $505.8 billion, a decrease of 1.2% from the previous month, but 2.3% above December 2017. Total sales for the 12 months of 2018 were up 5.0%.
Producer Price Index – Released 2/14 – The Producer Price Index for final demand declined 0.1% in January. Core PPI (less food and energy) increased by 0.3%. Year over year the index for final demand rose 2.0%.
Consumer Price Index – Released 2/13 – The Consumer Price Index was unchanged in January. Core CPI, which excludes food and energy increased 0.2%. The monthly changes left total CPI up 1.6% year-over-year and core CPI up 2.2%.
Next week we get data on the Consumer Price Index, the Producer Price Index, Retail Sales, Industrial Production and Capacity Utilization, and JOLTS. Due to delays from the recent gov’t shutdown, we will also see again New Residential Sales and Construction Spending.
Data Sources:
Bureau of Economic Analysis (BEA)
Congressional Budget Office (CBO)
U.S. Bureau of Labor Statistics (BLS)
Federal Reserve Economic Data (FRED Charts)
CME Fed Watch
U.S. Treasury – Yields
U.S. Census Bureau
Institute for Supply Management (ISM)
Weekly DOL Employment Data
BLS Monthly Jobs Report
JOLTS
US Energy Admn (EIA)
BLS Consumer Price Index CPI
BLS Producer Price Index PPI
Atlanta Fed GDPNOW
NY Fed Nowcast GDP
US Census Bureau Housing Starts
Consumer Credit
USCB Retail Sales
Construction Spending
Federal Reserve Dot Plots
NY Empire Index
Philadelphia Federal Reserve
P/E Ratio Data -Yardeni Research
Technical Analysis Info:
StockCharts.com – Financial Charts
Exponential vs Simple moving average
Other Links:
1973 Arab Oil Embargo
Hunt Brothers Silver
Long-Term Capital bailout
Categories:
Tags: