In trade war news, President Trump officially postponed the March 1st deadline with China to reach a trade deal as reports of progress toward a trade deal have emerged. NEC Director Larry Kudlow made comments that the U.S. and China are making “Fantastic” progress in meetings and that China has expressed willingness to make structural changes to prevent intellectual property theft. The issue of intellectual property theft has been a highly contested issue throughout trade negotiations. On Friday, Bloomberg released a report discussing the U.S. and China are in the process of constructing a document to present the provisions of a trade deal that could be signed as early as mid-March.
President Trump also met with North Korean leader Kim Jong-un for a two-day summit. President Trump unexpectedly and abruptly ended the summit after failing to reach a substantial agreement regarding the denuclearization of the North Korean peninsula. Some small concessions were expected from the meeting; however, President Trump felt as though making a deal would have to be the right deal and that they did not reach it. North Korea has halted testing of their Nuclear weapons while discussions of denuclearization have been discussed between the two leaders.
Fed Chair Jerome Powell held his semi-annual Congressional Testimony on the economy last week. In his testimony, he reaffirmed the Fed’s “patient” stance on monetary policy. He also expressed that the Fed is close to agreeing on a plan to end the balance sheet runoff.
Economic data released last week showed housing starts increasing at the slowest pace since September 2016, the ISM Manufacturing Index declining for February, after an increase in January, and an increase in consumer confidence levels for February. The first estimate of GDP growth for the fourth quarter of 2018 was also released showing GDP increased by 2.6%. Although higher than expected, GDP growth for the fourth quarter was lower than the growth registered for the second and third quarters.
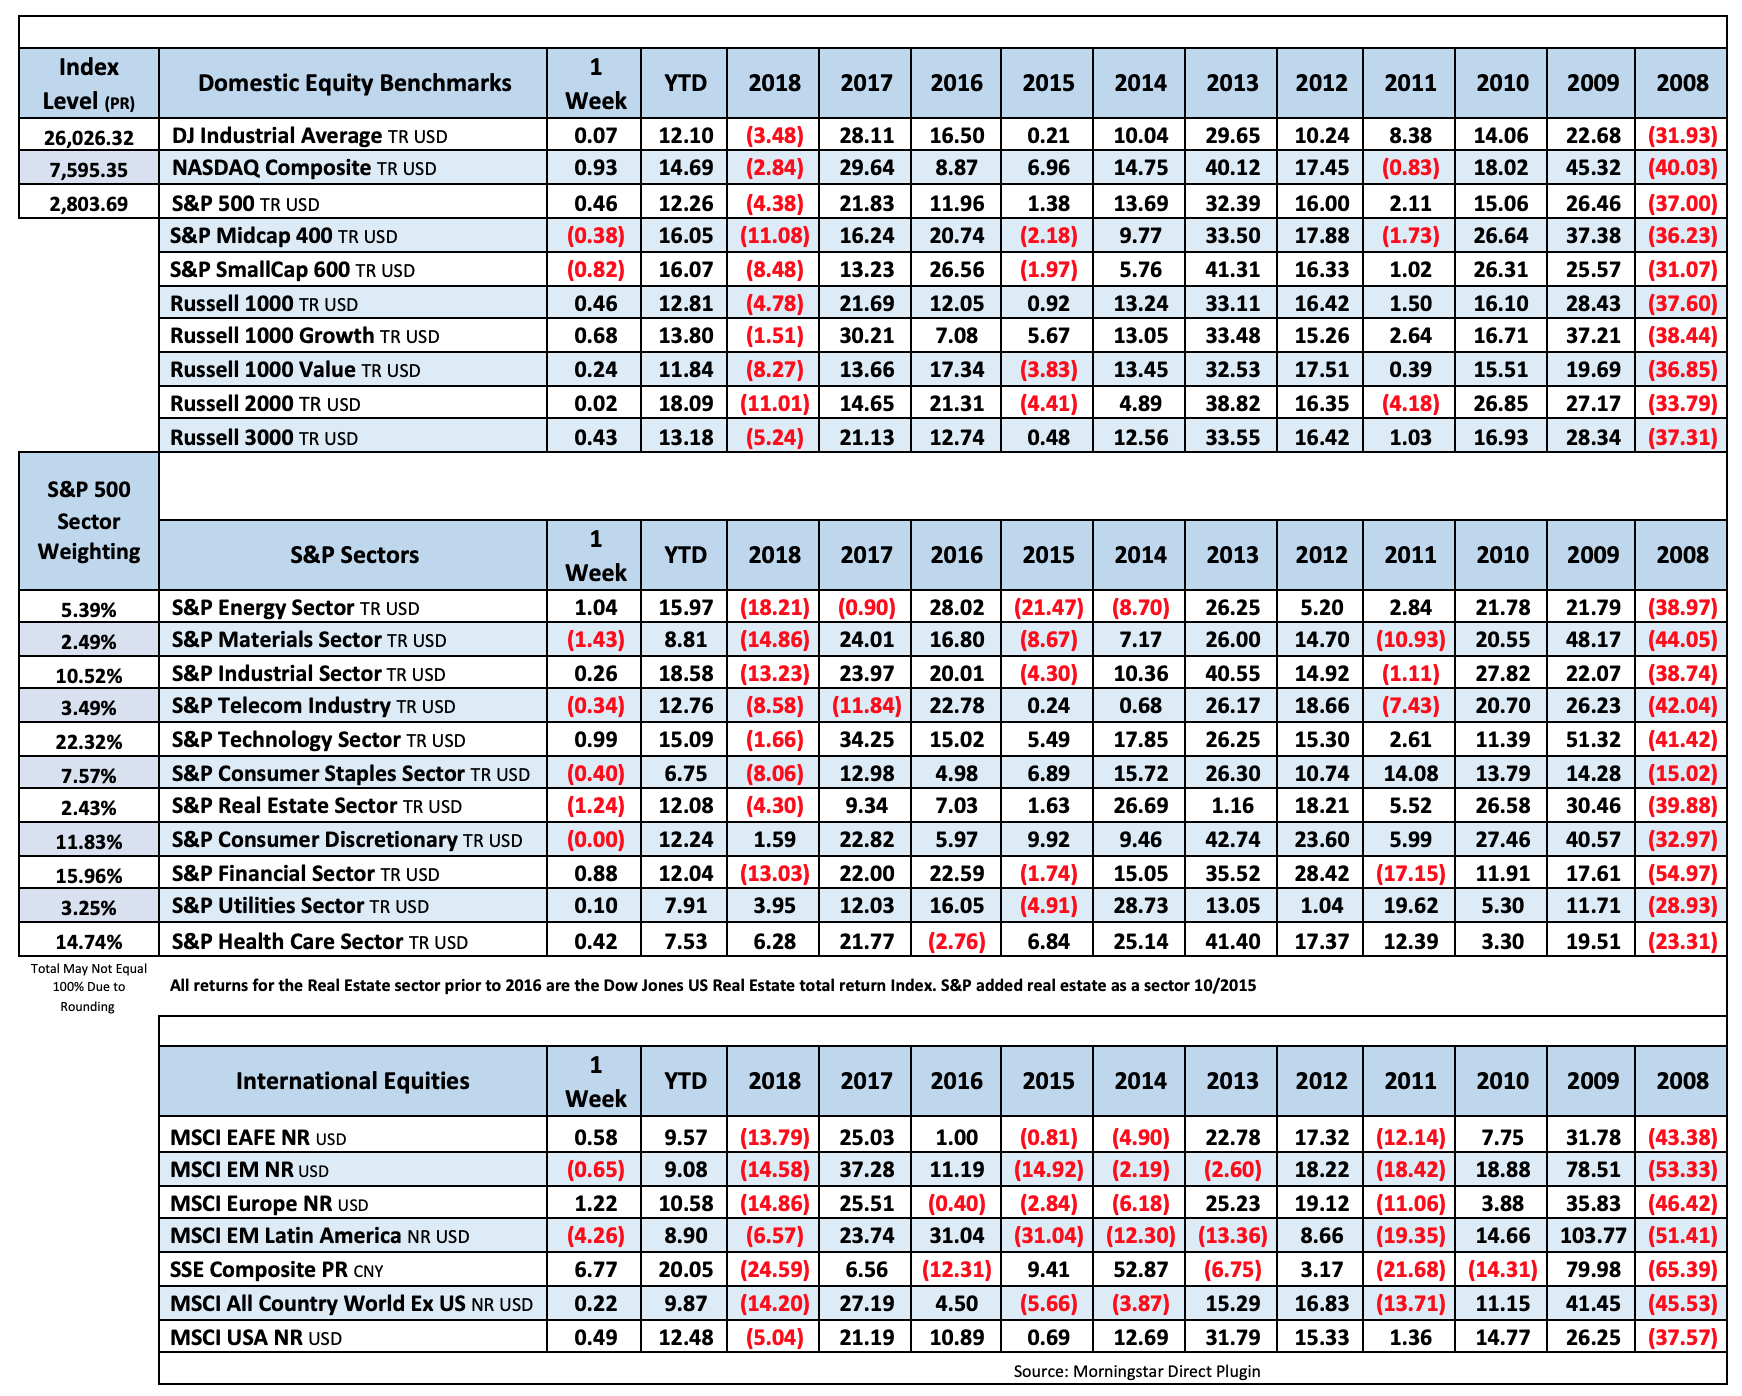
Equity markets saw the S&P 500 increase by 0.4% extending its yearly gain to 11.8%. The Nasdaq gained 0.9% and the Dow Jones Industrial Average and the Russell 2000 finished flat.
U.S. Treasuries declined noticeably on the week sending yields higher. The 2 year yield increased 7 bps to 2.55% while the 10 year yield increased 10 bps to 2.76%. The spread between the two is currently 21 bps.
Fixed Income

FOMC January Statement Federal Reserve Dot Plots Dec 18 US Debt Measurement– January Meeting Minutes US Corporate Debt Tops $6 Trillion. Treasury.gov yields
Global Bond Yields
The Federal Reserve decreased their total holdings by 10.3% over the last year. $4.435 Trillion to $3.975 Trillion.
https://fred.stlouisfed.org/graph/?g=n9BM
Foreign Exchange Market
Energy Complex
The Baker Hughes rig count declined by 9 this week. There are 1038 oil and gas rigs operating in the US – Up 57 over last year.
- Brent Crude Oil declined 3.05% this week closing at $65.07/bbl
- WTI Crude Oil fell 2.55% this week to close at $55.80/bbl
- Heating Oil declined 1.43% this week closing at $2.00/gallon
- Natural Gas gained 4.38% this week closing at $2.86 per million BTUs
- Unleaded Gas lost 2.07% this week closing at $1.73/gallon
Metals Complex
Gold fell this week by 2.52% sending Gold back under $1300/oz to $1299.20/oz.
- Gold declined 2.52% this week closing at $1299.20/oz
- Silver declined 4.13% on the week closing at $15.26/oz
- Palladium gained 5.09% this week closing at $1536.60/oz
- Platinum gained 2.10% this week closing at 863.70/oz
- Copper declined 0.66% this week closing at $2.93/lb
Employment Picture
The economy continues to create jobs and the labor participation rate is starting to creep up after bottoming at 62.4% in September 2015
Weekly Unemployment Claims – Released Thursday 2/28 – In the week ending February 23, initial claims were 225k an increase of 8k from the previous week’s revised level. The 4-week moving average was 229k, a decrease of 7k from the previous week’s revised average.
Job Openings & Labor Turnover Survey JOLTS – Released Tuesday 2/12 – The number of job openings increased to a series high of 7.3 million on the last business day of December, the U.S. Bureau of Labor Statistics reported. Over the month, hires were little changed at 5.9 million, quits increased slightly to 3.5 million, and total separations were little changed at 5.5 million. Within separations, the quits rate and the layoffs and discharges rates were unchanged at 2.3 percent and 1.1 percent, respectively.
https://fred.stlouisfed.org/graph/?g=lSNf
January Jobs Report – BLS Summary – Released 2/1 – The US Economy added 304k nonfarm jobs in January and the Unemployment rate increased to 4%. Hourly earning rose The December report was revised down 90k though. Hiring highlights include Education and Health care +55k, Leisure and Hospitality +74k, Professional and Business Services +30k, Construction +52k, and Transportation and Warehousing +27k.
- Average hourly earnings increased by 3 cents/ 0.11% in January y/y hourly earnings are up 3.2%.
- U3 unemployment edged upward by 0.1% to 4.0%. U6 unemployment rate increased 0.5% at 8.1%.
- The labor force participation rate increased slightly from 63.1% to 63.2%.
- Average work week was unchanged at 34.5 hours.
Employment Cost Index – Released 1/31/19 – Compensation costs for civilian workers increased 2.9% for the 12-month period ending in December 2018 compared with a compensation costs increase of 2.6% in December 2017. Wages and salaries were up 3.1%, versus 2.5% for the 12-month period ending December 2017. Benefit costs increased 2.8%, versus 2.5% in December 2017. For private industry workers, compensation costs increased 3.0% year-over-year, versus 2.6% for the 12 months ending December 2017. Wages and salaries increased 3.1% year-over-year, versus 2.8% for the 12 months ending December 2017. Benefit costs increased 2.6%, versus 2.3% for the 12 months ending December 2017. This report is published quarterly.
This Week’s Economic Data
Links take you to the data source
PMI Manufacturing ISM Index – Released 3/1 – February PMI decreased 2.4% to 54.2% from January’s reading of 56.6%. The New Orders Index was down 2.7% from the January reading of 58.2% to 55.5% for February. The Production Index registered 54.8% down 5.7%.
Personal Income – Released 3/1 – Personal Income decreased 0.1% in January after seeing a 0.1% increase in December according to the BEA. The majority of the increase in December was due to increases in personal dividend income, compensation of employees, and farm proprietors’ income. The decrease in January was primarily reflected by decreases in personal dividend income, farm proprietors’ income, and personal interest income. Real PCE (the Feds preferred inflation gauge) decreased 0.6% in December and increased 2.6% in 2018.Real disposable personal income increased 1.0% for December and increased 2.9% for 2019.
Chicago PMI – Released 2/28 – Chicago PMI increased by 8 points in February rising to 64.7, up from 56.7 in January. The Prices Paid indicator saw its first increase in 7 months easing the downward pressure seen on prices through the second half of last year. The Prices Paid indicator is up 6.6% y/y.
1st Estimate of 4th Quarter GDP – Released 2/28 – According to the first estimate released by the Bureau of Economic Analysis, Real Gross Domestic Product (Real GDP) increased at an annual rate of 2.6% in the fourth quarter of 2018 surpassing expectations. The increase in real GDP reflected positive contributions from personal consumption expenditures, nonresidential fixed investment, and state and local gov’t spending. Negative contributions included imports which increased in the fourth quarter.
Consumer Confidence – Released 2/26 – The Consumer confidence index increased in February. The Index now shows a reading of 131.4 up from 121.7 in January. Consumer confidence levels have rebounded after three months of decline. Expectations in recent months had declined due to financial market volatility and the government shutdown. Consumer confidence levels suggest consumers expect the economy to continue to expand as consumers continue to view both business and labor market conditions favorably. The pace of expansion of the economy is expected to moderate in 2019 however.
Housing Starts – Released 2/26 – New home starts in December were at a seasonally adjusted rate of 1.078 million; down 11.2% below November and down 10.9% below last December’s rate. Building Permits were at a seasonally adjusted rate of 1.326 million, up 0.3% compared to November and up 0.5% over last year.
Recent Economic Data
Links take you to the data source
Existing Home Sales – Released 2/21 – Existing home sales decreased 1.2% in January. Sales decreased to a seasonally adjusted rate of 4.94 million. Sales are currently down 8.5% from one year ago. Housing inventory increased to 3.9 months of inventory and the existing homes for sale declined to 1.59 million. The median sales price for all types of homes was $247,500, up 2.8% year/y.
Durable Goods – Released 2/21 – New orders for manufactured durable goods increased $3.0 billion or 1.2% to $254.4 billion in December. This increase makes two consecutive months of gains. Transportation equipment, up 3.3%, drove the increase by $2.8 billion to $90.2 billion.
Industrial Production and Capacity Utilization Released 2/15 – Industrial production declined by 0.6% in January following a 0.1% increase in December. Manufacturing output was also on the decline falling by 0.9%. The decline resulted primarily from a large drop in motor vehicle assemblies. Capacity utilization declined 0.6% to78.2%. Utilization is 1.6% below its long run (1972-2018) average.
Retail Sales – Released 2/14 – U.S. retail sales for December 2018, were $505.8 billion, a decrease of 1.2% from the previous month, but 2.3% above December 2017. Total sales for the 12 months of 2018 were up 5.0%.
Producer Price Index– Released 2/14 – The Producer Price Index for final demand declined 0.1% in January. Core PPI (less food and energy) increased 0.3%. Year over year the index for final demand rose 2.0%.
Consumer Price Index – Released 2/13 – The Consumer Price Index was unchanged in January. Core CPI, which excludes food and energy increased 0.2%. The monthly changes left total CPI up 1.6% year-over-year and core CPI up 2.2%.
Consumer Credit – Released 2/7 – Consumer credit increased at a seasonally adjusted annual rate of 6.5% in the fourth quarter and at a rate of 5% in December. For the 2018 calendar year, consumer credit increased 5%, with revolving and nonrevolving credit increasing 2.75% and 5.5% respectively.
U.S. Trade Balance – Released 2/6 – The U.S. Trade deficit was $49.3 billion in November, down $6.4 billion from $55.7 billion in October, November exports were $209.9 billion, $1.3 billion less than October exports. November imports were $259.2 billion, $7.7 billion less than October imports.
PMI Non-Manufacturing Index (ISM Services) – Released 2/5 – Economic activity in the non-manufacturing sector grew in January for the 108th consecutive month. ISM Non-Manufacturing registered 56.7 percent, which is 1.3 percentage points lower than the December reading of 58 percent. This represents continued growth in the non-manufacturing sector, at a slower rate.
U.S. Construction Spending – Released 2/1 – Construction spending increased slightly by 0.8% in November measuring at a seasonally adjusted annual rate of $1,299.9 billion. The November figure is 3.4% above the November 2017 estimate. Private construction spending was 1.3% above the revised October estimate.
New Residential Sales – Released 1/31 – Last month sales of new single-family homes increased by 16.9% to 657k, seasonally adjusted. The median sales price of new homes sold in November was $302.40k with an average sales price of $362.40k. At the end of November the seasonally adjusted estimate of new homes for sale was 330k. This represents a supply of 6.0 months at the current sales rate.
US Light Vehicle Sales – Released 12/6 – (Delayed release due to gov’t shutdown) U.S. light vehicle sales were at a seasonally adjusted annual rate (SAAR) of 17.40 million units in November versus a SAAR of 17.49 million units in October. The November run rate was down 0.7% from the SAAR of 17.52 million units for November 2017.
Next week we get data on US Light Vehicle Sales, Consumer Credit, ISM Services, New Residential Sales, U.S. Construction Spending, the U.S. Trade Balance, and the February Jobs Report.
Data Sources:
Bureau of Economic Analysis (BEA)
Congressional Budget Office (CBO)
U.S. Bureau of Labor Statistics (BLS)
Federal Reserve Economic Data (FRED Charts)
CME Fed Watch
U.S. Treasury – Yields
U.S. Census Bureau
Institute for Supply Management (ISM)
Weekly DOL Employment Data
BLS Monthly Jobs Report
JOLTS
US Energy Admn (EIA)
BLS Consumer Price Index CPI
BLS Producer Price Index PPI
Atlanta Fed GDPNOW
NY Fed Nowcast GDP
US Census Bureau Housing Starts
Consumer Credit
USCB Retail Sales
Construction Spending
Federal Reserve Dot Plots
NY Empire Index
Philadelphia Federal Reserve
P/E Ratio Data -Yardeni Research
Technical Analysis Info:
StockCharts.com – Financial Charts
Exponential vs Simple moving average
Other Links:
1973 Arab Oil Embargo
Hunt Brothers Silver
Long-Term Capital bailout


Week 9 Talking Points #9
In trade war news, President Trump officially postponed the March 1st deadline with China to reach a trade deal as reports of progress toward a trade deal have emerged. NEC Director Larry Kudlow made comments that the U.S. and China are making “Fantastic” progress in meetings and that China has expressed willingness to make structural changes to prevent intellectual property theft. The issue of intellectual property theft has been a highly contested issue throughout trade negotiations. On Friday, Bloomberg released a report discussing the U.S. and China are in the process of constructing a document to present the provisions of a trade deal that could be signed as early as mid-March.
President Trump also met with North Korean leader Kim Jong-un for a two-day summit. President Trump unexpectedly and abruptly ended the summit after failing to reach a substantial agreement regarding the denuclearization of the North Korean peninsula. Some small concessions were expected from the meeting; however, President Trump felt as though making a deal would have to be the right deal and that they did not reach it. North Korea has halted testing of their Nuclear weapons while discussions of denuclearization have been discussed between the two leaders.
Fed Chair Jerome Powell held his semi-annual Congressional Testimony on the economy last week. In his testimony, he reaffirmed the Fed’s “patient” stance on monetary policy. He also expressed that the Fed is close to agreeing on a plan to end the balance sheet runoff.
Economic data released last week showed housing starts increasing at the slowest pace since September 2016, the ISM Manufacturing Index declining for February, after an increase in January, and an increase in consumer confidence levels for February. The first estimate of GDP growth for the fourth quarter of 2018 was also released showing GDP increased by 2.6%. Although higher than expected, GDP growth for the fourth quarter was lower than the growth registered for the second and third quarters.
Equity markets saw the S&P 500 increase by 0.4% extending its yearly gain to 11.8%. The Nasdaq gained 0.9% and the Dow Jones Industrial Average and the Russell 2000 finished flat.
U.S. Treasuries declined noticeably on the week sending yields higher. The 2 year yield increased 7 bps to 2.55% while the 10 year yield increased 10 bps to 2.76%. The spread between the two is currently 21 bps.
Table of Contents
Fixed Income
FOMC January Statement Federal Reserve Dot Plots Dec 18 US Debt Measurement– January Meeting Minutes US Corporate Debt Tops $6 Trillion. Treasury.gov yields
Global Bond Yields
The Federal Reserve decreased their total holdings by 10.3% over the last year. $4.435 Trillion to $3.975 Trillion.
https://fred.stlouisfed.org/graph/?g=n9BM
Foreign Exchange Market
Energy Complex
The Baker Hughes rig count declined by 9 this week. There are 1038 oil and gas rigs operating in the US – Up 57 over last year.
Metals Complex
Gold fell this week by 2.52% sending Gold back under $1300/oz to $1299.20/oz.
Employment Picture
The economy continues to create jobs and the labor participation rate is starting to creep up after bottoming at 62.4% in September 2015
Weekly Unemployment Claims – Released Thursday 2/28 – In the week ending February 23, initial claims were 225k an increase of 8k from the previous week’s revised level. The 4-week moving average was 229k, a decrease of 7k from the previous week’s revised average.
Job Openings & Labor Turnover Survey JOLTS – Released Tuesday 2/12 – The number of job openings increased to a series high of 7.3 million on the last business day of December, the U.S. Bureau of Labor Statistics reported. Over the month, hires were little changed at 5.9 million, quits increased slightly to 3.5 million, and total separations were little changed at 5.5 million. Within separations, the quits rate and the layoffs and discharges rates were unchanged at 2.3 percent and 1.1 percent, respectively.
https://fred.stlouisfed.org/graph/?g=lSNf
January Jobs Report – BLS Summary – Released 2/1 – The US Economy added 304k nonfarm jobs in January and the Unemployment rate increased to 4%. Hourly earning rose The December report was revised down 90k though. Hiring highlights include Education and Health care +55k, Leisure and Hospitality +74k, Professional and Business Services +30k, Construction +52k, and Transportation and Warehousing +27k.
Employment Cost Index – Released 1/31/19 – Compensation costs for civilian workers increased 2.9% for the 12-month period ending in December 2018 compared with a compensation costs increase of 2.6% in December 2017. Wages and salaries were up 3.1%, versus 2.5% for the 12-month period ending December 2017. Benefit costs increased 2.8%, versus 2.5% in December 2017. For private industry workers, compensation costs increased 3.0% year-over-year, versus 2.6% for the 12 months ending December 2017. Wages and salaries increased 3.1% year-over-year, versus 2.8% for the 12 months ending December 2017. Benefit costs increased 2.6%, versus 2.3% for the 12 months ending December 2017. This report is published quarterly.
This Week’s Economic Data
Links take you to the data source
PMI Manufacturing ISM Index – Released 3/1 – February PMI decreased 2.4% to 54.2% from January’s reading of 56.6%. The New Orders Index was down 2.7% from the January reading of 58.2% to 55.5% for February. The Production Index registered 54.8% down 5.7%.
Personal Income – Released 3/1 – Personal Income decreased 0.1% in January after seeing a 0.1% increase in December according to the BEA. The majority of the increase in December was due to increases in personal dividend income, compensation of employees, and farm proprietors’ income. The decrease in January was primarily reflected by decreases in personal dividend income, farm proprietors’ income, and personal interest income. Real PCE (the Feds preferred inflation gauge) decreased 0.6% in December and increased 2.6% in 2018.Real disposable personal income increased 1.0% for December and increased 2.9% for 2019.
Chicago PMI – Released 2/28 – Chicago PMI increased by 8 points in February rising to 64.7, up from 56.7 in January. The Prices Paid indicator saw its first increase in 7 months easing the downward pressure seen on prices through the second half of last year. The Prices Paid indicator is up 6.6% y/y.
1st Estimate of 4th Quarter GDP – Released 2/28 – According to the first estimate released by the Bureau of Economic Analysis, Real Gross Domestic Product (Real GDP) increased at an annual rate of 2.6% in the fourth quarter of 2018 surpassing expectations. The increase in real GDP reflected positive contributions from personal consumption expenditures, nonresidential fixed investment, and state and local gov’t spending. Negative contributions included imports which increased in the fourth quarter.
Consumer Confidence – Released 2/26 – The Consumer confidence index increased in February. The Index now shows a reading of 131.4 up from 121.7 in January. Consumer confidence levels have rebounded after three months of decline. Expectations in recent months had declined due to financial market volatility and the government shutdown. Consumer confidence levels suggest consumers expect the economy to continue to expand as consumers continue to view both business and labor market conditions favorably. The pace of expansion of the economy is expected to moderate in 2019 however.
Housing Starts – Released 2/26 – New home starts in December were at a seasonally adjusted rate of 1.078 million; down 11.2% below November and down 10.9% below last December’s rate. Building Permits were at a seasonally adjusted rate of 1.326 million, up 0.3% compared to November and up 0.5% over last year.
Recent Economic Data
Links take you to the data source
Existing Home Sales – Released 2/21 – Existing home sales decreased 1.2% in January. Sales decreased to a seasonally adjusted rate of 4.94 million. Sales are currently down 8.5% from one year ago. Housing inventory increased to 3.9 months of inventory and the existing homes for sale declined to 1.59 million. The median sales price for all types of homes was $247,500, up 2.8% year/y.
Durable Goods – Released 2/21 – New orders for manufactured durable goods increased $3.0 billion or 1.2% to $254.4 billion in December. This increase makes two consecutive months of gains. Transportation equipment, up 3.3%, drove the increase by $2.8 billion to $90.2 billion.
Industrial Production and Capacity Utilization Released 2/15 – Industrial production declined by 0.6% in January following a 0.1% increase in December. Manufacturing output was also on the decline falling by 0.9%. The decline resulted primarily from a large drop in motor vehicle assemblies. Capacity utilization declined 0.6% to78.2%. Utilization is 1.6% below its long run (1972-2018) average.
Retail Sales – Released 2/14 – U.S. retail sales for December 2018, were $505.8 billion, a decrease of 1.2% from the previous month, but 2.3% above December 2017. Total sales for the 12 months of 2018 were up 5.0%.
Producer Price Index– Released 2/14 – The Producer Price Index for final demand declined 0.1% in January. Core PPI (less food and energy) increased 0.3%. Year over year the index for final demand rose 2.0%.
Consumer Price Index – Released 2/13 – The Consumer Price Index was unchanged in January. Core CPI, which excludes food and energy increased 0.2%. The monthly changes left total CPI up 1.6% year-over-year and core CPI up 2.2%.
Consumer Credit – Released 2/7 – Consumer credit increased at a seasonally adjusted annual rate of 6.5% in the fourth quarter and at a rate of 5% in December. For the 2018 calendar year, consumer credit increased 5%, with revolving and nonrevolving credit increasing 2.75% and 5.5% respectively.
U.S. Trade Balance – Released 2/6 – The U.S. Trade deficit was $49.3 billion in November, down $6.4 billion from $55.7 billion in October, November exports were $209.9 billion, $1.3 billion less than October exports. November imports were $259.2 billion, $7.7 billion less than October imports.
PMI Non-Manufacturing Index (ISM Services) – Released 2/5 – Economic activity in the non-manufacturing sector grew in January for the 108th consecutive month. ISM Non-Manufacturing registered 56.7 percent, which is 1.3 percentage points lower than the December reading of 58 percent. This represents continued growth in the non-manufacturing sector, at a slower rate.
U.S. Construction Spending – Released 2/1 – Construction spending increased slightly by 0.8% in November measuring at a seasonally adjusted annual rate of $1,299.9 billion. The November figure is 3.4% above the November 2017 estimate. Private construction spending was 1.3% above the revised October estimate.
New Residential Sales – Released 1/31 – Last month sales of new single-family homes increased by 16.9% to 657k, seasonally adjusted. The median sales price of new homes sold in November was $302.40k with an average sales price of $362.40k. At the end of November the seasonally adjusted estimate of new homes for sale was 330k. This represents a supply of 6.0 months at the current sales rate.
US Light Vehicle Sales – Released 12/6 – (Delayed release due to gov’t shutdown) U.S. light vehicle sales were at a seasonally adjusted annual rate (SAAR) of 17.40 million units in November versus a SAAR of 17.49 million units in October. The November run rate was down 0.7% from the SAAR of 17.52 million units for November 2017.
Next week we get data on US Light Vehicle Sales, Consumer Credit, ISM Services, New Residential Sales, U.S. Construction Spending, the U.S. Trade Balance, and the February Jobs Report.
Data Sources:
Bureau of Economic Analysis (BEA)
Congressional Budget Office (CBO)
U.S. Bureau of Labor Statistics (BLS)
Federal Reserve Economic Data (FRED Charts)
CME Fed Watch
U.S. Treasury – Yields
U.S. Census Bureau
Institute for Supply Management (ISM)
Weekly DOL Employment Data
BLS Monthly Jobs Report
JOLTS
US Energy Admn (EIA)
BLS Consumer Price Index CPI
BLS Producer Price Index PPI
Atlanta Fed GDPNOW
NY Fed Nowcast GDP
US Census Bureau Housing Starts
Consumer Credit
USCB Retail Sales
Construction Spending
Federal Reserve Dot Plots
NY Empire Index
Philadelphia Federal Reserve
P/E Ratio Data -Yardeni Research
Technical Analysis Info:
StockCharts.com – Financial Charts
Exponential vs Simple moving average
Other Links:
1973 Arab Oil Embargo
Hunt Brothers Silver
Long-Term Capital bailout
Categories:
Tags: