Good Life Advisors – Talking Points – Week 52
Happy New Year to Everyone – be on the lookout for our client approved recap and outlook coming your way.
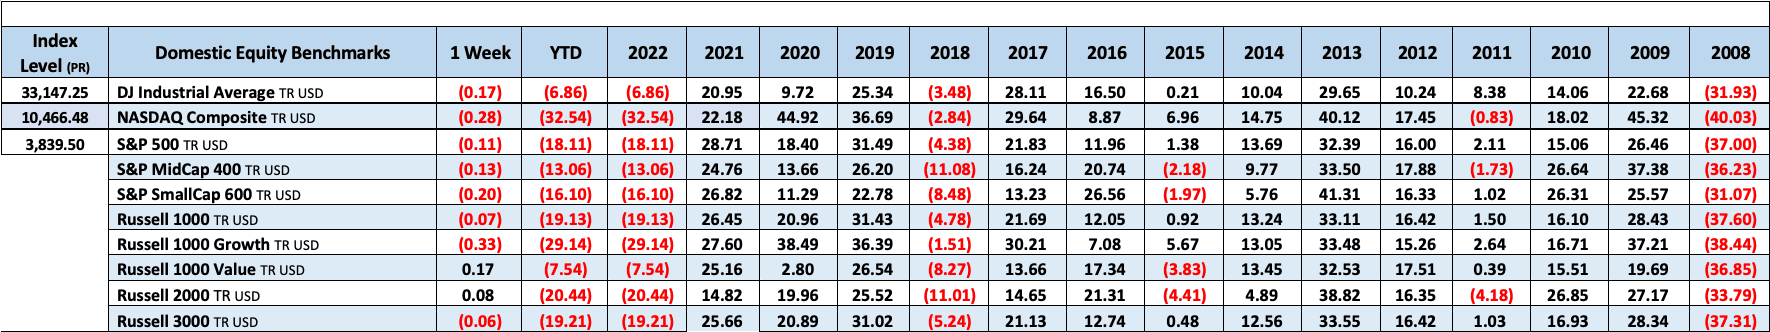
It’s the end of the line for 2022 which turned out to be a big reset of expectations. A reset on interest rates, a reset on valuations, a reset on modern monetary theory, a reset on cryptocurrency. All of this playing out as the three year mark since covid started quickly approaches. Major US market indices were down in 2022, with the S&P and Nasdaq logging their worst calendar years since 2008. The S&P hit a fresh all-time closing high of 4796.56 on 3-Jan before sliding, breaking into bear-market territory in June and hitting a low closing price of 3577.03 on 12-Oct. Treasuries were historically weak amid the Fed’s rapid rate hikes and looming fears of a coming recession, with a lot of attention on an extremely inverted yield curve; the 2/10 spread hit its most negative level in more than 40 years. The 2Y’s yield rose from 0.73% at the start of the year to 4.64% in early November before pulling back somewhat; the 10Y opened the year at 1.51% before topping at 4.23% in late October. Dollar strength was a big factor weighing on equities this year, with the DXY rising 7.9% in 2022 (its best year since 2015). Gold logged a minor 0.1% loss for the year, crossing above $2,000/ oz in March but then sliding for much of the remainder. Oil was a big focus this year amid much concern for the impacts of the Russian invasion of Ukraine, economic normalization in China, and fears about slowing global demand. But despite a wealth of stimuli, WTI logged only a moderate gain for the year, settling up 6.71%.
The inflationary backdrop weighed on Big Tech, with AMZN (49.6%) while AAPL (26.8%) was the best of the FANMAG complex; META (64.2%) amid questions about its strategic direction and pressure on digital ads. Semis, cloud software, and unprofitable tech weighed as well; CVNA (98%) was a particularly striking example of the latter. TSLA (65%) was a big drag on the auto space, reflecting concerns about Musk’s focus following his Twitter acquisition. F (44%) and GM (42.6%) were notably lower and there was significant weakness throughout the EV space. Homebuilders struggled in an environment of rapidly increasing mortgage rates. Department stores and specialty retailers faced concerns about consumer-spending shifts, bloated inventories, and margin pressures. Media, apparel, REITs, exchanges, and airlines were some of the year’s other laggards. Large-cap banks had a challenging year, but regionals fared somewhat better. To the upside, energy was far and away the strongest sector in a year replete with both supply and demand worries. Integrated, oil-services firms, E&Ps, and refiners were broadly higher. There were few other standout groups, but ag machinery, fertilizers, A&D, P&C insurance, biotech, pharma, managed care, and food were among the stronger areas.
Surging inflation was an overarching concern this year, both for the obvious pressures on consumers and businesses but also in terms of the aggressive policy response from global central banks. Headline CPI reached a 9% y/y pace in June (its highest level since 1981) before beginning to taper off to a 7.1% y/y rise in Novembers report. Core-price growth peaked more recently, rising 6.7% y/y in September, then moving down to 6% y/y in November. Energy was a big driver of the headline rise due to big increases in the price of oil and gas, with the Ukraine invasion a big factor. But there were also significant increases in food prices across the year, and policymakers voiced much concern about elevated shelter inflation. Producer-price inflation was similarly high, with headline PPI spending four months above an 11% y/y pace from March through June (though tailing down to just 7.4% y/y in November). All through the year, policymakers fielded questions about whether the recent experience with high inflation might mean consumers’ expectations could become unanchored. Fed officials acknowledged the risk of this but generally said they were not seeing that scenario play out; and indeed various surveys showed short-term inflation expectations coming down through the second half (though consumer uncertainties remained elevated).
Worries about a Fed liftoff and balance-sheet runoff came to front and center early in the year. The 5-Jan release of the December 2021 FOMC minutes showed almost all participants in favor of balance-sheet normalization and showed some members’ willingness to increase the Fed funds rate sooner or at a faster pace than had been expected. This was eventually manifested in a 25bp hike in March and a further 50bp hike in May, with the latter meeting also seeing an announcement that balance-sheet runoff would begin in June. That month’s meeting began a series of four straight 75bp hikes as the Fed continued to look for signs of an inflection in the inflation data (and with Fed voices starting to push back against market hopes for a quick “pivot” that would move rates back down). Indeed, the dominant Fedspeak theme for the remainder of the year was the “higher for longer” mantra, as officials worked to shape market expectations – particularly in the face of uncooperative inflation and labor-market data as well as rising worries about potential economic damage from the higher-rate campaign. By year’s end, Fed members had signaled that a slowdown in the pace of hikes was warranted, often discussing the long and variable lags between policy moves and the data. FedWatch currently notes market expectations for two more 25bp hikes before a multi-month Fed pause, with some sense it could begin to par rates late in 2023.
The year’s multiple pressures fed into persistent concerns about the economy tipping into a recession. The Fed’s commitment to a “higher for longer” policy path remains a key worry, though policymakers have asserted they are hoping for a “softing landing” (though they concede the path to that outcome may be narrow). There have been anxieties about the potential signaling effects of the yield curve. The 2Y/10Y Treasury yield spread was consistently negative from 5-Jul onwards, inverting by 84bp on 6-Dec, its most deeply negative level since 1981. The 3M/10Y curve also inverted in November and remains far into negative territory. And while one of the Fed’s primary goals has been to bring inflation back down to the 2% long-term target, it is unclear how long this effort may take. meanwhile, companies will continue to have to cope with wage pressures, higher input pricing, and possible demand fluctuations should the US consumer become less resilient. The confluence of these factors has fed into analyst concerns that consensus S&P earnings for 2023 may be too high and may have further to come down. Amid all this, investor sentiment remains extremely depressed, while corporate executives have been slowing hiring, announcing layoffs, and working to cut costs.
China was a major factor for the market this year, on several fronts. Beijing’s seemingly rock-solid commitment to its”zero-covid” approach left the country open to the type of shutdowns seen in the early days of the pandemic, and in fact much of Shanghai was closed in the spring in an attempt to quell an outbreak. But by the fall, officials had backed away from this approach, which was seen as a bullish development toward normalization of a major world market (though at year’s end the country is grappling with surging new-case numbers). There was also close attention on the government’s proposals for economic policy support, including a well-received announcement of a $150B fund for its beleaguered property sector. Also, many US-listed China stocks struggled this year against fears they could be delisted, though developments giving US regulators broader access to audited financial records appears to have averted this possibility.
Russia launched an invasion of Ukraine in February. While this enterprise saw some quick gains, Ukrainian resistance was stiff and, with the help of significant financial and material support from the West, was eventually able to mount a counteroffensive. While the war presented much headline risk in the early days (and at times when Russia’s Putin made remarks about possible nuclear responses), it has ceased to be a significant day-to-day concern for the market. At year’s end, the situation has largely ground down to a stalemate; and while peace talks are occasionally mooted, the likelihood of a near-term diplomatic solutions seems quite remote.
Oil came off a strong year in 2021, when WTI rose ~55% amid broad trends toward economic normalization. OPEC+ even began the year by boosting its output targets. Russia’s invasion of Ukraine in February and the resulting international sanctions scrambled the global oil trade and saw WTI trade as high as $130/ barrel in early March. But concerns about Chinese demand and the global economic trajectory amid broad rate hikes served to depress crude, with lingering uncertainties being cited by OPEC+ as a key factor behind its October decision to cut its targets by 2M bpd. In the US, there was vigorous debate about the cause of and remedy for spiking gas prices, with AAA logging a high of $5.02/gal for regular gas on 14-Jun. But by the end of 2022, the retreat in oil prices had contributed to domestic gas prices dropping to their lowest levels since summer 2021.
The US housing market was extraordinarily challenged after some notable strength during the pandemic. Rapidly rising mortgage rates were a major factor, though tight inventories and high homes prices were no help. The MBA 30Y mortgage rate topped out at 7.16% in late October, the highest level in more than two decades, before retreating to 6.34% near the close of the year (after ending 2021 at 3.31%). Homebuilder confidence hit its lowest mark since June 2012 (excluding pandemic low), November housing starts were down 16.4% y/y, and existing home sales asw their longest streak of monthly declines since 1999.
Cryptocurrencies descended into a so-called “crypto winter” this year, with Bitcoin slumping for much of the year and bottoming out near $15k before finding some stability (in contrast to its all-time high above $68k in November 2021). The risk-off atmosphere amid the Fed’s rate hikes has been cited as a factor, but hopes for broader adoption of the asset class have also been hamstrung by several high-profile crises, particularly the collapse of the Terra “stablecoin” in May, the downfall of crypto lender Celsius in June, and the dramatic breakdown of Sam Bankman-Fried’s FTX empire this fall. It remains to be seen how and in what form some of the crypto market’s aspirations for decentralized finance may survive.
The 2022 US congressional midterm elections produced more of a whimper than a bang. Given economic unease, high gas and food prices, low polling numbers for the Biden administration, and historical trends, there was a sense that control of both houses of Congress could pass to Republicans this year. In actuality, the forecast “red wave” did not appear, with the GOP only able to gain a small majority in the House (while the Democrats widened their slim control over the Senate). In general, this was considered a bullish development in the sense that a still-divided government was unlikely to generate broad new spending plans or wide-ranging reforms.

Fixed Income
Yield Curve
November FOMC Statement November Fed Minutes Balance Sheet Reduction Plan Credit, Liquidity and Balance Sheet Federal Reserve Dot Plots Treasury.gov yields FOMC Policy Normalization Statement Longer- Run Goals Jan 2022
Foreign Exchange Market
Energy Complex
The Baker Hughes rig count was flat this week. There are 779 oil and gas rigs operating in the US – Up 193 over last year.
Employment Picture
Weekly Unemployment Claims – Released Thursday 12/23/2022 – The week ending December 17th observed an increase of 2k in initial claims increased to 216k. The four-week moving average of initial jobless claims was down 6.25k to 221,750.
November Jobs Report – BLS Summary – Released 12/2/2022 – The US Economy added 263k nonfarm jobs in November and the Unemployment rate was unchanged at 3.7%. Average hourly earnings increased 12 cents to $32.70. Hiring highlights include +82k Education and Health Services, +88k Leisure and Hospitality, and +42k Government.
- Average hourly earnings increased 18 cents/0.6% to $32.82
- U3 unemployment rate remained at 3.7%. U6 unemployment rate increased 0.1% to 6.8%.
- The labor force participation rate was little changed at 62.1%.
- Average work week was declined 0.1 to 34.4 hours.
Job Openings & Labor Turnover Survey – JOLTS – Released 11/30/2022 – The number of job openings edged down to 10.3 million on the last business day of October, the US Bureau of Labor Statistics reported. Over the month, the number of hires and total separations changed little at 6 million and 5.7 million, respectively. Within separation, quits (4 million) and layoffs and discharges (1.4 million) changed little.
Employment Cost Index – Released 10/28/2022 – Compensation costs for civilian workers increased 1.2% for the 3-month period ending in September 2022. The 12-month period ending in September 2022 saw compensation costs increased by 5%. The 12-month period ending September 2021 increased 3.7%. Wages and salaries increased 5.1% over the year and increased 4.2% for the 12-month period ending in September 2021. Benefit costs increased 4.9% over the year and increased 2.5% for the 12-month period ending in September 2021. This report is published quarterly.
This Week’s Economic Data
Chicago PMI – Released 12/30/2022 – Chicago PMI remained in contraction territory but increased in December by 7.7 points to 44.9.
Recent Economic Date
Links take you to the data source
Personal Income – Released 12/23/2022 – Personal income increased $80.1 billion, or 0.4% in November. Disposable Personal Income increased $68.6 billion or 0.4%. Personal Consumption Expenditure increased $19.8 billion or 0.1%.
Durable Goods – Released 12/23/2022 – New orders for manufactured durable goods in November decreased $5.8 billion or 2.1% to $270.6 billion. Transportation equipment increased up $0.7 billion or 0.8% to $91.8 billion.
New Residential Sales – Released 12/23/2022 – Sales of new single-family homes increased 5.8% to 640k, seasonally adjusted, in November. The median sales price of new homes sold in November was $471,200 with an average sales price of $543,600. At the end of November, the seasonally adjusted estimate of new homes for sale was 461k. This represents a supply of 8.6 months at the current sales rate.
Third Estimate of 3rd Quarter 2022 GDP – Released 12/22/2022 – Real Gross Domestic Product (GDP) increased at an annual rate of 3.2% in the third quarter of 2022 according to the third estimate released by the Bureau of Economic Analysis, in contrast to a decrease of 0.6% in the second quarter. The “third”estimate of GDP released today is based on more complete source data than were available for the “second” estimate issued last month. In the second estimate, the increase in real GDP was 2.9%. The updated estimates primarily reflected upward revisions to consumer spending and nonresidential fixed investment that were partly offset by a downward revision to private inventory investment. The increase in the third quarter primarily reflected increases in exports and consumer spending that were partly offset by a decrease in housing investment.
Consumer Confidence – Released 12/21/2022 – The Conference Board Consumer Confidence Index increased in December. The Index now stands at 108.3 (1985+100), up from 101.4 in November.
Existing Home Sales – Released 12/21/2022 – Existing home sales decreased in November marking ten consecutive months of declines. Sales declined 7.7% to a seasonally adjusted rate of 4.09 million in November. Sales decreased 35.4% year-over-year. Housing inventory sits at 1.14 million units, down 6.6% from October’s inventory and up 2.7% over last year. Unsold inventory sits at a 3.3-month supply. The median existing home price for all housing types was $370,700 which is up 3.5% from November 2021. This marks 129 consecutive months of year-over-year increases, the longest-running streak on record.
Housing Starts – Released 12/20/2022 – New home starts in November were at a seasonally adjusted annual rate of 1.425 million; down 0.5% below October, and 16.4% below last November’s rate. Building Permits were at a seasonally adjusted annual rate of 1.342 million, down 11.2% compared to October, and down 22.4% over last year.
Industrial Production and Capacity Utilization – Released 12/15/2022 – In November Industrial production decreased 0.2%. Manufacturing decreased 0.6%. Utilities output increased 3.6%. Mining output decreased 0.7%. Total industrial production was 2.5% higher in November than a year ago. Total capacity utilization decreased 0.2% in November to 79.7% which is 0.1% above its long run average.
Retail Sales – Released 12/15/2022 – US retail sales for November decreased 0.6% to $689.4 billion and retail sales are 6.5% above November 2021. US retail sales for the September 2022 through November 2022 period were up 7.7% from the same period a year ago.
Consumer Price Index – Released 12/13/2022 – Consumer prices increased 0.1% m/m in November following a 0.4% increase in October. Consumer prices are up 7.1% for the 12-month period ending in November. Core consumer prices increased 0.2% m/m in November.
Producer Price Index – Released 12/09/2022 – The PPI for final demand advanced 0.3% in November, seasonally adjusted, the US Bureau of Labor Statistics reported. Final demand prices also rose 0.3% in both October and September. On an unadjusted basis, the index for final demand moved up 7.4% for the 12 months ended in November. In November, most of the increase in the index for final demand is attributable to a 0.4% advance in prices for final demand services. The index for final demand goods inched up 0.1%. Prices for final demand less foods, energy and trade services moved up 0.3% in November after rising 0.2% in October. For the 12 months ended in November, the index for final demand less goods, energy, and trade services increased 4.9%.
Consumer Credit – Released 12/7/2022 – In October, consumer credit increased at a seasonally adjusted annual rate of 6.9%. Revolving credit increased at an annual rate of 10.4%, while nonrevolving credit increased at an annual rate of 5.8%.
U.S. Trade Balance – Released 12/6/2022 – The US monthly international trade deficit increased in October 2022 according to the US Bureau of Economic Analysis and the IS Census Bureau. the deficit increased from $74.1 billion in September (revised) to $78.2 billion in October, as imports increased and exports decreased. The goods deficit increased $6.1 billion in October to $99.6 billion. The services surplus increased $2.1 billion in October to $21.4 billion.
US Light Vehicle Sales – Released 12/5/2022 – US light vehicle sales were at a seasonally adjusted annual rate of 14.144 million units in November. A decreased of 0.75 million.
PMI Non-Manufacturing Index – Released 12/5/2022 – Economic activity in the services sector grew in November for the 30th month in a row – with the Service PMI registering 56.5% – In November, the Services PMI registered 56.5%, 2.1 percentage points higher than October’s reading of 54.4%. The Business Activity Index registered 64.7%, a substantial increase of 9 percentage points compared to the reading of 55.7% in October. The New Orders Index figure of 56% is 0.5 percentage points lower than the October reading of 56.5%.
PMI Manufacturing Index – Released 12/1/2022 – The November Manufacturing PMI registered 49%, 1.2 percentage points lower than the 50.2% recorded in October. Regarding the overall economy, this figure indicates expansion for the 30th month in a row after contraction in April and May 2020. The Manufacturing PMI figure is the lowest since May 2020, when it registered 43.5%. The New Orders Index remained in contraction territory at 47.2%, 2 percentage points lower than the 49.2% recorded in October.
U.S. Construction Spending – Released 12/1/2022 – Construction spending during October 2022 was estimated at a seasonally adjusted annual rate of $1,794.9 billion, 0.3% (±1.2%)* below the revised September estimate of $1,800.1 billion. The October figure is 9.2% (±1.5%) above the October 2021 estimate of $1,644.3 billion. During the first ten months of this year, construction spending amounted to $1,507.8 billion, 10.8% (±1%) above the $1,360.8 billion for the same period in 2021.
Next week we get data on US Construction Spending, US Trade Balance, Manufacturing PMI, Services PMI, JOLTS, and the December Jobs Report.
Data Sources:
Bureau of Economic Analysis (BEA)
Congressional Budget Office (CBO)
U.S. Bureau of Labor Statistics (BLS)
Federal Reserve Economic Data (FRED Charts)
CME Fed Watch
U.S. Treasury – Yields
U.S. Census Bureau
Institute for Supply Management (ISM)
Weekly DOL Employment Data
BLS Monthly Jobs Report
JOLTS
US Energy Admin (EIA)
BLS Consumer Price Index CPI
BLS Producer Price Index PPI
Atlanta Fed GDPNOW
NY Fed Nowcast GDP
US Census Bureau Housing Starts
Consumer Credit
USCB Retail Sales
Construction Spending
Federal Reserve Dot Plots
NY Empire Index
Philadelphia Federal Reserve
P/E Ratio Data -Yardeni Research
Technical Analysis Info:
StockCharts.com – Financial Charts
Exponential vs Simple moving average
Other Links:
1973 Arab Oil Embargo
Hunt Brothers Silver
Long-Term Capital bailout


Week 52 Talking Points
Table of Contents
Good Life Advisors – Talking Points – Week 52
Happy New Year to Everyone – be on the lookout for our client approved recap and outlook coming your way.
It’s the end of the line for 2022 which turned out to be a big reset of expectations. A reset on interest rates, a reset on valuations, a reset on modern monetary theory, a reset on cryptocurrency. All of this playing out as the three year mark since covid started quickly approaches. Major US market indices were down in 2022, with the S&P and Nasdaq logging their worst calendar years since 2008. The S&P hit a fresh all-time closing high of 4796.56 on 3-Jan before sliding, breaking into bear-market territory in June and hitting a low closing price of 3577.03 on 12-Oct. Treasuries were historically weak amid the Fed’s rapid rate hikes and looming fears of a coming recession, with a lot of attention on an extremely inverted yield curve; the 2/10 spread hit its most negative level in more than 40 years. The 2Y’s yield rose from 0.73% at the start of the year to 4.64% in early November before pulling back somewhat; the 10Y opened the year at 1.51% before topping at 4.23% in late October. Dollar strength was a big factor weighing on equities this year, with the DXY rising 7.9% in 2022 (its best year since 2015). Gold logged a minor 0.1% loss for the year, crossing above $2,000/ oz in March but then sliding for much of the remainder. Oil was a big focus this year amid much concern for the impacts of the Russian invasion of Ukraine, economic normalization in China, and fears about slowing global demand. But despite a wealth of stimuli, WTI logged only a moderate gain for the year, settling up 6.71%.
The inflationary backdrop weighed on Big Tech, with AMZN (49.6%) while AAPL (26.8%) was the best of the FANMAG complex; META (64.2%) amid questions about its strategic direction and pressure on digital ads. Semis, cloud software, and unprofitable tech weighed as well; CVNA (98%) was a particularly striking example of the latter. TSLA (65%) was a big drag on the auto space, reflecting concerns about Musk’s focus following his Twitter acquisition. F (44%) and GM (42.6%) were notably lower and there was significant weakness throughout the EV space. Homebuilders struggled in an environment of rapidly increasing mortgage rates. Department stores and specialty retailers faced concerns about consumer-spending shifts, bloated inventories, and margin pressures. Media, apparel, REITs, exchanges, and airlines were some of the year’s other laggards. Large-cap banks had a challenging year, but regionals fared somewhat better. To the upside, energy was far and away the strongest sector in a year replete with both supply and demand worries. Integrated, oil-services firms, E&Ps, and refiners were broadly higher. There were few other standout groups, but ag machinery, fertilizers, A&D, P&C insurance, biotech, pharma, managed care, and food were among the stronger areas.
Surging inflation was an overarching concern this year, both for the obvious pressures on consumers and businesses but also in terms of the aggressive policy response from global central banks. Headline CPI reached a 9% y/y pace in June (its highest level since 1981) before beginning to taper off to a 7.1% y/y rise in Novembers report. Core-price growth peaked more recently, rising 6.7% y/y in September, then moving down to 6% y/y in November. Energy was a big driver of the headline rise due to big increases in the price of oil and gas, with the Ukraine invasion a big factor. But there were also significant increases in food prices across the year, and policymakers voiced much concern about elevated shelter inflation. Producer-price inflation was similarly high, with headline PPI spending four months above an 11% y/y pace from March through June (though tailing down to just 7.4% y/y in November). All through the year, policymakers fielded questions about whether the recent experience with high inflation might mean consumers’ expectations could become unanchored. Fed officials acknowledged the risk of this but generally said they were not seeing that scenario play out; and indeed various surveys showed short-term inflation expectations coming down through the second half (though consumer uncertainties remained elevated).
Worries about a Fed liftoff and balance-sheet runoff came to front and center early in the year. The 5-Jan release of the December 2021 FOMC minutes showed almost all participants in favor of balance-sheet normalization and showed some members’ willingness to increase the Fed funds rate sooner or at a faster pace than had been expected. This was eventually manifested in a 25bp hike in March and a further 50bp hike in May, with the latter meeting also seeing an announcement that balance-sheet runoff would begin in June. That month’s meeting began a series of four straight 75bp hikes as the Fed continued to look for signs of an inflection in the inflation data (and with Fed voices starting to push back against market hopes for a quick “pivot” that would move rates back down). Indeed, the dominant Fedspeak theme for the remainder of the year was the “higher for longer” mantra, as officials worked to shape market expectations – particularly in the face of uncooperative inflation and labor-market data as well as rising worries about potential economic damage from the higher-rate campaign. By year’s end, Fed members had signaled that a slowdown in the pace of hikes was warranted, often discussing the long and variable lags between policy moves and the data. FedWatch currently notes market expectations for two more 25bp hikes before a multi-month Fed pause, with some sense it could begin to par rates late in 2023.
The year’s multiple pressures fed into persistent concerns about the economy tipping into a recession. The Fed’s commitment to a “higher for longer” policy path remains a key worry, though policymakers have asserted they are hoping for a “softing landing” (though they concede the path to that outcome may be narrow). There have been anxieties about the potential signaling effects of the yield curve. The 2Y/10Y Treasury yield spread was consistently negative from 5-Jul onwards, inverting by 84bp on 6-Dec, its most deeply negative level since 1981. The 3M/10Y curve also inverted in November and remains far into negative territory. And while one of the Fed’s primary goals has been to bring inflation back down to the 2% long-term target, it is unclear how long this effort may take. meanwhile, companies will continue to have to cope with wage pressures, higher input pricing, and possible demand fluctuations should the US consumer become less resilient. The confluence of these factors has fed into analyst concerns that consensus S&P earnings for 2023 may be too high and may have further to come down. Amid all this, investor sentiment remains extremely depressed, while corporate executives have been slowing hiring, announcing layoffs, and working to cut costs.
China was a major factor for the market this year, on several fronts. Beijing’s seemingly rock-solid commitment to its”zero-covid” approach left the country open to the type of shutdowns seen in the early days of the pandemic, and in fact much of Shanghai was closed in the spring in an attempt to quell an outbreak. But by the fall, officials had backed away from this approach, which was seen as a bullish development toward normalization of a major world market (though at year’s end the country is grappling with surging new-case numbers). There was also close attention on the government’s proposals for economic policy support, including a well-received announcement of a $150B fund for its beleaguered property sector. Also, many US-listed China stocks struggled this year against fears they could be delisted, though developments giving US regulators broader access to audited financial records appears to have averted this possibility.
Russia launched an invasion of Ukraine in February. While this enterprise saw some quick gains, Ukrainian resistance was stiff and, with the help of significant financial and material support from the West, was eventually able to mount a counteroffensive. While the war presented much headline risk in the early days (and at times when Russia’s Putin made remarks about possible nuclear responses), it has ceased to be a significant day-to-day concern for the market. At year’s end, the situation has largely ground down to a stalemate; and while peace talks are occasionally mooted, the likelihood of a near-term diplomatic solutions seems quite remote.
Oil came off a strong year in 2021, when WTI rose ~55% amid broad trends toward economic normalization. OPEC+ even began the year by boosting its output targets. Russia’s invasion of Ukraine in February and the resulting international sanctions scrambled the global oil trade and saw WTI trade as high as $130/ barrel in early March. But concerns about Chinese demand and the global economic trajectory amid broad rate hikes served to depress crude, with lingering uncertainties being cited by OPEC+ as a key factor behind its October decision to cut its targets by 2M bpd. In the US, there was vigorous debate about the cause of and remedy for spiking gas prices, with AAA logging a high of $5.02/gal for regular gas on 14-Jun. But by the end of 2022, the retreat in oil prices had contributed to domestic gas prices dropping to their lowest levels since summer 2021.
The US housing market was extraordinarily challenged after some notable strength during the pandemic. Rapidly rising mortgage rates were a major factor, though tight inventories and high homes prices were no help. The MBA 30Y mortgage rate topped out at 7.16% in late October, the highest level in more than two decades, before retreating to 6.34% near the close of the year (after ending 2021 at 3.31%). Homebuilder confidence hit its lowest mark since June 2012 (excluding pandemic low), November housing starts were down 16.4% y/y, and existing home sales asw their longest streak of monthly declines since 1999.
Cryptocurrencies descended into a so-called “crypto winter” this year, with Bitcoin slumping for much of the year and bottoming out near $15k before finding some stability (in contrast to its all-time high above $68k in November 2021). The risk-off atmosphere amid the Fed’s rate hikes has been cited as a factor, but hopes for broader adoption of the asset class have also been hamstrung by several high-profile crises, particularly the collapse of the Terra “stablecoin” in May, the downfall of crypto lender Celsius in June, and the dramatic breakdown of Sam Bankman-Fried’s FTX empire this fall. It remains to be seen how and in what form some of the crypto market’s aspirations for decentralized finance may survive.
The 2022 US congressional midterm elections produced more of a whimper than a bang. Given economic unease, high gas and food prices, low polling numbers for the Biden administration, and historical trends, there was a sense that control of both houses of Congress could pass to Republicans this year. In actuality, the forecast “red wave” did not appear, with the GOP only able to gain a small majority in the House (while the Democrats widened their slim control over the Senate). In general, this was considered a bullish development in the sense that a still-divided government was unlikely to generate broad new spending plans or wide-ranging reforms.
Fixed Income
Yield Curve
November FOMC Statement November Fed Minutes Balance Sheet Reduction Plan Credit, Liquidity and Balance Sheet Federal Reserve Dot Plots Treasury.gov yields FOMC Policy Normalization Statement Longer- Run Goals Jan 2022
Foreign Exchange Market
Energy Complex
The Baker Hughes rig count was flat this week. There are 779 oil and gas rigs operating in the US – Up 193 over last year.
Employment Picture
Weekly Unemployment Claims – Released Thursday 12/23/2022 – The week ending December 17th observed an increase of 2k in initial claims increased to 216k. The four-week moving average of initial jobless claims was down 6.25k to 221,750.
November Jobs Report – BLS Summary – Released 12/2/2022 – The US Economy added 263k nonfarm jobs in November and the Unemployment rate was unchanged at 3.7%. Average hourly earnings increased 12 cents to $32.70. Hiring highlights include +82k Education and Health Services, +88k Leisure and Hospitality, and +42k Government.
Job Openings & Labor Turnover Survey – JOLTS – Released 11/30/2022 – The number of job openings edged down to 10.3 million on the last business day of October, the US Bureau of Labor Statistics reported. Over the month, the number of hires and total separations changed little at 6 million and 5.7 million, respectively. Within separation, quits (4 million) and layoffs and discharges (1.4 million) changed little.
Employment Cost Index – Released 10/28/2022 – Compensation costs for civilian workers increased 1.2% for the 3-month period ending in September 2022. The 12-month period ending in September 2022 saw compensation costs increased by 5%. The 12-month period ending September 2021 increased 3.7%. Wages and salaries increased 5.1% over the year and increased 4.2% for the 12-month period ending in September 2021. Benefit costs increased 4.9% over the year and increased 2.5% for the 12-month period ending in September 2021. This report is published quarterly.
This Week’s Economic Data
Chicago PMI – Released 12/30/2022 – Chicago PMI remained in contraction territory but increased in December by 7.7 points to 44.9.
Recent Economic Date
Links take you to the data source
Personal Income – Released 12/23/2022 – Personal income increased $80.1 billion, or 0.4% in November. Disposable Personal Income increased $68.6 billion or 0.4%. Personal Consumption Expenditure increased $19.8 billion or 0.1%.
Durable Goods – Released 12/23/2022 – New orders for manufactured durable goods in November decreased $5.8 billion or 2.1% to $270.6 billion. Transportation equipment increased up $0.7 billion or 0.8% to $91.8 billion.
New Residential Sales – Released 12/23/2022 – Sales of new single-family homes increased 5.8% to 640k, seasonally adjusted, in November. The median sales price of new homes sold in November was $471,200 with an average sales price of $543,600. At the end of November, the seasonally adjusted estimate of new homes for sale was 461k. This represents a supply of 8.6 months at the current sales rate.
Third Estimate of 3rd Quarter 2022 GDP – Released 12/22/2022 – Real Gross Domestic Product (GDP) increased at an annual rate of 3.2% in the third quarter of 2022 according to the third estimate released by the Bureau of Economic Analysis, in contrast to a decrease of 0.6% in the second quarter. The “third”estimate of GDP released today is based on more complete source data than were available for the “second” estimate issued last month. In the second estimate, the increase in real GDP was 2.9%. The updated estimates primarily reflected upward revisions to consumer spending and nonresidential fixed investment that were partly offset by a downward revision to private inventory investment. The increase in the third quarter primarily reflected increases in exports and consumer spending that were partly offset by a decrease in housing investment.
Consumer Confidence – Released 12/21/2022 – The Conference Board Consumer Confidence Index increased in December. The Index now stands at 108.3 (1985+100), up from 101.4 in November.
Existing Home Sales – Released 12/21/2022 – Existing home sales decreased in November marking ten consecutive months of declines. Sales declined 7.7% to a seasonally adjusted rate of 4.09 million in November. Sales decreased 35.4% year-over-year. Housing inventory sits at 1.14 million units, down 6.6% from October’s inventory and up 2.7% over last year. Unsold inventory sits at a 3.3-month supply. The median existing home price for all housing types was $370,700 which is up 3.5% from November 2021. This marks 129 consecutive months of year-over-year increases, the longest-running streak on record.
Housing Starts – Released 12/20/2022 – New home starts in November were at a seasonally adjusted annual rate of 1.425 million; down 0.5% below October, and 16.4% below last November’s rate. Building Permits were at a seasonally adjusted annual rate of 1.342 million, down 11.2% compared to October, and down 22.4% over last year.
Industrial Production and Capacity Utilization – Released 12/15/2022 – In November Industrial production decreased 0.2%. Manufacturing decreased 0.6%. Utilities output increased 3.6%. Mining output decreased 0.7%. Total industrial production was 2.5% higher in November than a year ago. Total capacity utilization decreased 0.2% in November to 79.7% which is 0.1% above its long run average.
Retail Sales – Released 12/15/2022 – US retail sales for November decreased 0.6% to $689.4 billion and retail sales are 6.5% above November 2021. US retail sales for the September 2022 through November 2022 period were up 7.7% from the same period a year ago.
Consumer Price Index – Released 12/13/2022 – Consumer prices increased 0.1% m/m in November following a 0.4% increase in October. Consumer prices are up 7.1% for the 12-month period ending in November. Core consumer prices increased 0.2% m/m in November.
Producer Price Index – Released 12/09/2022 – The PPI for final demand advanced 0.3% in November, seasonally adjusted, the US Bureau of Labor Statistics reported. Final demand prices also rose 0.3% in both October and September. On an unadjusted basis, the index for final demand moved up 7.4% for the 12 months ended in November. In November, most of the increase in the index for final demand is attributable to a 0.4% advance in prices for final demand services. The index for final demand goods inched up 0.1%. Prices for final demand less foods, energy and trade services moved up 0.3% in November after rising 0.2% in October. For the 12 months ended in November, the index for final demand less goods, energy, and trade services increased 4.9%.
Consumer Credit – Released 12/7/2022 – In October, consumer credit increased at a seasonally adjusted annual rate of 6.9%. Revolving credit increased at an annual rate of 10.4%, while nonrevolving credit increased at an annual rate of 5.8%.
U.S. Trade Balance – Released 12/6/2022 – The US monthly international trade deficit increased in October 2022 according to the US Bureau of Economic Analysis and the IS Census Bureau. the deficit increased from $74.1 billion in September (revised) to $78.2 billion in October, as imports increased and exports decreased. The goods deficit increased $6.1 billion in October to $99.6 billion. The services surplus increased $2.1 billion in October to $21.4 billion.
US Light Vehicle Sales – Released 12/5/2022 – US light vehicle sales were at a seasonally adjusted annual rate of 14.144 million units in November. A decreased of 0.75 million.
PMI Non-Manufacturing Index – Released 12/5/2022 – Economic activity in the services sector grew in November for the 30th month in a row – with the Service PMI registering 56.5% – In November, the Services PMI registered 56.5%, 2.1 percentage points higher than October’s reading of 54.4%. The Business Activity Index registered 64.7%, a substantial increase of 9 percentage points compared to the reading of 55.7% in October. The New Orders Index figure of 56% is 0.5 percentage points lower than the October reading of 56.5%.
PMI Manufacturing Index – Released 12/1/2022 – The November Manufacturing PMI registered 49%, 1.2 percentage points lower than the 50.2% recorded in October. Regarding the overall economy, this figure indicates expansion for the 30th month in a row after contraction in April and May 2020. The Manufacturing PMI figure is the lowest since May 2020, when it registered 43.5%. The New Orders Index remained in contraction territory at 47.2%, 2 percentage points lower than the 49.2% recorded in October.
U.S. Construction Spending – Released 12/1/2022 – Construction spending during October 2022 was estimated at a seasonally adjusted annual rate of $1,794.9 billion, 0.3% (±1.2%)* below the revised September estimate of $1,800.1 billion. The October figure is 9.2% (±1.5%) above the October 2021 estimate of $1,644.3 billion. During the first ten months of this year, construction spending amounted to $1,507.8 billion, 10.8% (±1%) above the $1,360.8 billion for the same period in 2021.
Next week we get data on US Construction Spending, US Trade Balance, Manufacturing PMI, Services PMI, JOLTS, and the December Jobs Report.
Data Sources:
Bureau of Economic Analysis (BEA)
Congressional Budget Office (CBO)
U.S. Bureau of Labor Statistics (BLS)
Federal Reserve Economic Data (FRED Charts)
CME Fed Watch
U.S. Treasury – Yields
U.S. Census Bureau
Institute for Supply Management (ISM)
Weekly DOL Employment Data
BLS Monthly Jobs Report
JOLTS
US Energy Admin (EIA)
BLS Consumer Price Index CPI
BLS Producer Price Index PPI
Atlanta Fed GDPNOW
NY Fed Nowcast GDP
US Census Bureau Housing Starts
Consumer Credit
USCB Retail Sales
Construction Spending
Federal Reserve Dot Plots
NY Empire Index
Philadelphia Federal Reserve
P/E Ratio Data -Yardeni Research
Technical Analysis Info:
StockCharts.com – Financial Charts
Exponential vs Simple moving average
Other Links:
1973 Arab Oil Embargo
Hunt Brothers Silver
Long-Term Capital bailout
Categories:
Tags: