Good Life Advisors – Talking Points – Week 51
Merry Christmas and Happy New Year – With the first trading day of the new year approaching, please be reminded that WAM rebalancing is taking place next Tuesday, January 3rd. If you have accounts that need to be taken or need to discuss a specific account, don’t hesitate to reach out at WAM@GoodLifeFA.com or 855-WAM-TEAM.
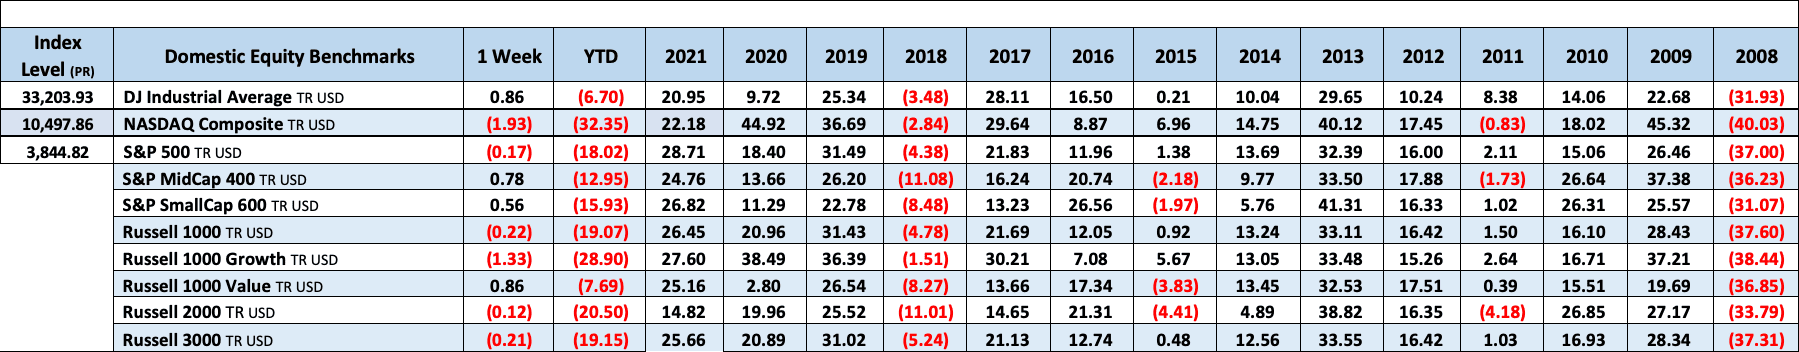
Here we are, down to the last four trading days of the year. Unless something remarkable happens, 2022 will go down as the worst year for stocks since 2008 and the worst year for bonds since 1926. This week didn’t help bonds either with the US agg down 1.5% bringing the year-to-date loss to almost 13%. Stocks were more mixed (this week) with value positive on the week while growth fell. The S&P and Nasdaq notching their third straight weekly drops while the Dow finished somewhat higher. Trading volumes were light and catalysts were limited in the run-up to the Christmas holiday weekend. Treasuries were weaker with the curve steepening, though the yield curve remained extremely inverted. The dollar was weaker overall, particularly vs the yen after an unexpected announcement from the BoJ on yield-curve control. Gold was marginally higher, gaining 0.2%. Oil was higher, with WTI up 7.1% (crude’s best weekly gain since early October). Again, there was little in the way of catalysts but declining inventories, harsh US winter weather, and a Russian threat to cut production were all part of the narrative.
Sector performance was mixed, with energy leading the way on oil’s strength. Apparel names outperformed with help from well-received NKE =9.7% earnings. Banks outperformed, particularly regionals. Insurance, media, multis, machinery, and HPCs were some of the stronger areas. Semis were broadly lower, taking cues from MU’s (3.6%) disappointing earnings report. Homebuilders pulled back amid higher rates and another bout of disappointing housing data. Hardware/ software, department stores, airlines, trucking, solar, and profitless tech lagged. Autos were lower but TSLA (18%) was the big decliner, dragging down EVs and lithium/ battery names.
The market newsflow was fairly quiet this week given the approach to the Christmas holiday and the glide into year-end. The big development was a surprise move by the Bank of Japan to widen its yield curve control band for 10Y yields, with the stated purpose of improving market functioning. Despite characterizations as a hawkish development, analysts seemed to conclude the move may have limited impacts outside of FX. There was a limited assortment of corporate earnings. Takeaways were generally positive from some of the larger names (particularly NKE and FDX), though disappointing MU results weighed on semis. Investors also noted some favorable inflation signaling from a Cleveland Fed report showing easing shelter inflation. There also remained lingering hopes for seasonal support as the market heads toward year’s end. But ultimately, the main market narrative continued to revolved around concerns about higher-for longer monetary policy messaging, concerns about what shape 2023’s economy may take, and the impact this could have on earnings going forward.
November headline PCE price index rose 0.1% m/m, in line with consensus and a step down from October’s 0.3% pace. Up 5.5% y/y. Core PCE up 0.2% m/m, also in line with forecasts and level with October’s pace (and up 4.7% y/y). Release noted an increase in services spending (particularly offset by a decrease in spending on goods. November new home sales up 5.8% m/m to a 640k SAAR, up from downwardly revised October print of 605k 9was 632k). Final December Michigan Consumer Sentiment marked up, while 1Y inflation expectations marked down 0.2pp to 4.4%, lowest since Jun-21. Elsewhere, headline November durable goods orders dropped 2.1% m/m, a steeper slide than the (0/7%) consensus and well below October’s 0.7% m/m increase. Core capital goods orders (non-defense, ex-aircraft) rose 0.2% m/m, a slowdown from October’s 0.6% pace. Core capital goods shipments (which feed into GDP) were down 0.1% m/m, notably slowing from October’s 1.4% rise.
Two items to note on the corporate front; Tesla continued its slide lower, now approaching double digits (from triple). It fell another 18% as questions swirled about Musk’s focus (despite a Twitter poll encouraging him to give up the reins at the social network). The stock is down 70% from its all time high in November ’21.
Wells Fargo once again settled with the Consumer Financial Protection Bureau, this time the bank was ordered by the CFPB to pay $3.7B for “widespread mismanagement” in several product lines. The consumer watchdog agency said the bank assessed fees and interest charges on loans for cars and homes. Some consumers had their vehicles illegally repossessed while others had overdraft fees unlawfully applied, the agency said.

Fixed Income
Yield Curve
November FOMC Statement November Fed Minutes Balance Sheet Reduction Plan Credit, Liquidity and Balance Sheet Federal Reserve Dot Plots Treasury.gov yields FOMC Policy Normalization Statement Longer- Run Goals Jan 2022
Foreign Exchange Market
Energy Complex
The Baker Hughes rig count increased by 3 rigs this week. There are 779 oil and gas rigs operating in the US – Up 193 over last year.
Employment Picture
Weekly Unemployment Claims – Released Thursday 12/23/2022 – The week ending December 17th observed an increase of 2k in initial claims increased to 216k. The four-week moving average of initial jobless claims was down 6.25k to 221,750.
November Jobs Report – BLS Summary – Released 12/2/2022 – The US Economy added 263k nonfarm jobs in November and the Unemployment rate was unchanged at 3.7%. Average hourly earnings increased 12 cents to $32.70. Hiring highlights include +82k Education and Health Services, +88k Leisure and Hospitality, and +42k Government.
- Average hourly earnings increased 18 cents/0.6% to $32.82
- U3 unemployment rate remained at 3.7%. U6 unemployment rate increased 0.1% to 6.8%.
- The labor force participation rate was little changed at 62.1%.
- Average work week was declined 0.1 to 34.4 hours.
Job Openings & Labor Turnover Survey – JOLTS – Released 11/30/2022 – The number of job openings edged down to 10.3 million on the last business day of October, the US Bureau of Labor Statistics reported. Over the month, the number of hires and total separations changed little at 6 million and 5.7 million, respectively. Within separation, quits (4 million) and layoffs and discharges (1.4 million) changed little.
Employment Cost Index – Released 10/28/2022 – Compensation costs for civilian workers increased 1.2% for the 3-month period ending in September 2022. The 12-month period ending in September 2022 saw compensation costs increased by 5%. The 12-month period ending September 2021 increased 3.7%. Wages and salaries increased 5.1% over the year and increased 4.2% for the 12-month period ending in September 2021. Benefit costs increased 4.9% over the year and increased 2.5% for the 12-month period ending in September 2021. This report is published quarterly.
This Week’s Economic Data
Personal Income – Released 12/23/2022 – Personal income increased $80.1 billion, or 0.4% in November. Disposable Personal Income increased $68.6 billion or 0.4%. Personal Consumption Expenditure increased $19.8 billion or 0.1%.
Durable Goods – Released 12/23/2022 – New orders for manufactured durable goods in November decreased $5.8 billion or 2.1% to $270.6 billion. Transportation equipment increased up $0.7 billion or 0.8% to $91.8 billion.
New Residential Sales – Released 12/23/2022 – Sales of new single-family homes increased 5.8% to 640k, seasonally adjusted, in November. The median sales price of new homes sold in November was $471,200 with an average sales price of $543,600. At the end of November, the seasonally adjusted estimate of new homes for sale was 461k. This represents a supply of 8.6 months at the current sales rate.
Third Estimate of 3rd Quarter 2022 GDP – Released 12/22/2022 – Real Gross Domestic Product (GDP) increased at an annual rate of 3.2% in the third quarter of 2022 according to the third estimate released by the Bureau of Economic Analysis, in contrast to a decrease of 0.6% in the second quarter. The “third”estimate of GDP released today is based on more complete source data than were available for the “second” estimate issued last month. In the second estimate, the increase in real GDP was 2.9%. The updated estimates primarily reflected upward revisions to consumer spending and nonresidential fixed investment that were partly offset by a downward revision to private inventory investment. The increase in the third quarter primarily reflected increases in exports and consumer spending that were partly offset by a decrease in housing investment.
Consumer Confidence – Released 12/21/2022 – The Conference Board Consumer Confidence Index increased in December. The Index now stands at 108.3 (1985+100), up from 101.4 in November.
Existing Home Sales – Released 12/21/2022 – Existing home sales decreased in November marking ten consecutive months of declines. Sales declined 7.7% to a seasonally adjusted rate of 4.09 million in November. Sales decreased 35.4% year-over-year. Housing inventory sits at 1.14 million units, down 6.6% from October’s inventory and up 2.7% over last year. Unsold inventory sits at a 3.3-month supply. The median existing home price for all housing types was $370,700 which is up 3.5% from November 2021. This marks 129 consecutive months of year-over-year increases, the longest-running streak on record.
Housing Starts – Released 12/20/2022 – New home starts in November were at a seasonally adjusted annual rate of 1.425 million; down 0.5% below October, and 16.4% below last November’s rate. Building Permits were at a seasonally adjusted annual rate of 1.342 million, down 11.2% compared to October, and down 22.4% over last year.
Recent Economic Date
Links take you to the data source
Industrial Production and Capacity Utilization – Released 12/15/2022 – In November Industrial production decreased 0.2%. Manufacturing decreased 0.6%. Utilities output increased 3.6%. Mining output decreased 0.7%. Total industrial production was 2.5% higher in November than a year ago. Total capacity utilization decreased 0.2% in November to 79.7% which is 0.1% above its long run average.
Retail Sales – Released 12/15/2022 – US retail sales for November decreased 0.6% to $689.4 billion and retail sales are 6.5% above November 2021. US retail sales for the September 2022 through November 2022 period were up 7.7% from the same period a year ago.
Consumer Price Index – Released 12/13/2022 – Consumer prices increased 0.1% m/m in November following a 0.4% increase in October. Consumer prices are up 7.1% for the 12-month period ending in November. Core consumer prices increased 0.2% m/m in November.
Producer Price Index – Released 12/09/2022 – The PPI for final demand advanced 0.3% in November, seasonally adjusted, the US Bureau of Labor Statistics reported. Final demand prices also rose 0.3% in both October and September. On an unadjusted basis, the index for final demand moved up 7.4% for the 12 months ended in November. In November, most of the increase in the index for final demand is attributable to a 0.4% advance in prices for final demand services. The index for final demand goods inched up 0.1%. Prices for final demand less foods, energy and trade services moved up 0.3% in November after rising 0.2% in October. For the 12 months ended in November, the index for final demand less goods, energy, and trade services increased 4.9%.
Consumer Credit – Released 12/7/2022 – In October, consumer credit increased at a seasonally adjusted annual rate of 6.9%. Revolving credit increased at an annual rate of 10.4%, while nonrevolving credit increased at an annual rate of 5.8%.
U.S. Trade Balance – Released 12/6/2022 – The US monthly international trade deficit increased in October 2022 according to the US Bureau of Economic Analysis and the IS Census Bureau. the deficit increased from $74.1 billion in September (revised) to $78.2 billion in October, as imports increased and exports decreased. The goods deficit increased $6.1 billion in October to $99.6 billion. The services surplus increased $2.1 billion in October to $21.4 billion.
US Light Vehicle Sales – Released 12/5/2022 – US light vehicle sales were at a seasonally adjusted annual rate of 14.144 million units in November. A decreased of 0.75 million.
PMI Non-Manufacturing Index – Released 12/5/2022 – Economic activity in the services sector grew in November for the 30th month in a row – with the Service PMI registering 56.5% – In November, the Services PMI registered 56.5%, 2.1 percentage points higher than October’s reading of 54.4%. The Business Activity Index registered 64.7%, a substantial increase of 9 percentage points compared to the reading of 55.7% in October. The New Orders Index figure of 56% is 0.5 percentage points lower than the October reading of 56.5%.
PMI Manufacturing Index – Released 12/1/2022 – The November Manufacturing PMI registered 49%, 1.2 percentage points lower than the 50.2% recorded in October. Regarding the overall economy, this figure indicates expansion for the 30th month in a row after contraction in April and May 2020. The Manufacturing PMI figure is the lowest since May 2020, when it registered 43.5%. The New Orders Index remained in contraction territory at 47.2%, 2 percentage points lower than the 49.2% recorded in October.
U.S. Construction Spending – Released 12/1/2022 – Construction spending during October 2022 was estimated at a seasonally adjusted annual rate of $1,794.9 billion, 0.3% (±1.2%)* below the revised September estimate of $1,800.1 billion. The October figure is 9.2% (±1.5%) above the October 2021 estimate of $1,644.3 billion. During the first ten months of this year, construction spending amounted to $1,507.8 billion, 10.8% (±1%) above the $1,360.8 billion for the same period in 2021.
Chicago PMI – Released 11/30/2022 – Chicago PMI remained in contraction territory and dropped significantly in November from 45.2 to 37.2. This marks the lowest reading since June 2020.
Next week we get data on Chicago PMI.
Data Sources:
Bureau of Economic Analysis (BEA)
Congressional Budget Office (CBO)
U.S. Bureau of Labor Statistics (BLS)
Federal Reserve Economic Data (FRED Charts)
CME Fed Watch
U.S. Treasury – Yields
U.S. Census Bureau
Institute for Supply Management (ISM)
Weekly DOL Employment Data
BLS Monthly Jobs Report
JOLTS
US Energy Admin (EIA)
BLS Consumer Price Index CPI
BLS Producer Price Index PPI
Atlanta Fed GDPNOW
NY Fed Nowcast GDP
US Census Bureau Housing Starts
Consumer Credit
USCB Retail Sales
Construction Spending
Federal Reserve Dot Plots
NY Empire Index
Philadelphia Federal Reserve
P/E Ratio Data -Yardeni Research
Technical Analysis Info:
StockCharts.com – Financial Charts
Exponential vs Simple moving average
Other Links:
1973 Arab Oil Embargo
Hunt Brothers Silver
Long-Term Capital bailout


Week 51 Talking Points
Table of Contents
Good Life Advisors – Talking Points – Week 51
Merry Christmas and Happy New Year – With the first trading day of the new year approaching, please be reminded that WAM rebalancing is taking place next Tuesday, January 3rd. If you have accounts that need to be taken or need to discuss a specific account, don’t hesitate to reach out at WAM@GoodLifeFA.com or 855-WAM-TEAM.
Here we are, down to the last four trading days of the year. Unless something remarkable happens, 2022 will go down as the worst year for stocks since 2008 and the worst year for bonds since 1926. This week didn’t help bonds either with the US agg down 1.5% bringing the year-to-date loss to almost 13%. Stocks were more mixed (this week) with value positive on the week while growth fell. The S&P and Nasdaq notching their third straight weekly drops while the Dow finished somewhat higher. Trading volumes were light and catalysts were limited in the run-up to the Christmas holiday weekend. Treasuries were weaker with the curve steepening, though the yield curve remained extremely inverted. The dollar was weaker overall, particularly vs the yen after an unexpected announcement from the BoJ on yield-curve control. Gold was marginally higher, gaining 0.2%. Oil was higher, with WTI up 7.1% (crude’s best weekly gain since early October). Again, there was little in the way of catalysts but declining inventories, harsh US winter weather, and a Russian threat to cut production were all part of the narrative.
Sector performance was mixed, with energy leading the way on oil’s strength. Apparel names outperformed with help from well-received NKE =9.7% earnings. Banks outperformed, particularly regionals. Insurance, media, multis, machinery, and HPCs were some of the stronger areas. Semis were broadly lower, taking cues from MU’s (3.6%) disappointing earnings report. Homebuilders pulled back amid higher rates and another bout of disappointing housing data. Hardware/ software, department stores, airlines, trucking, solar, and profitless tech lagged. Autos were lower but TSLA (18%) was the big decliner, dragging down EVs and lithium/ battery names.
The market newsflow was fairly quiet this week given the approach to the Christmas holiday and the glide into year-end. The big development was a surprise move by the Bank of Japan to widen its yield curve control band for 10Y yields, with the stated purpose of improving market functioning. Despite characterizations as a hawkish development, analysts seemed to conclude the move may have limited impacts outside of FX. There was a limited assortment of corporate earnings. Takeaways were generally positive from some of the larger names (particularly NKE and FDX), though disappointing MU results weighed on semis. Investors also noted some favorable inflation signaling from a Cleveland Fed report showing easing shelter inflation. There also remained lingering hopes for seasonal support as the market heads toward year’s end. But ultimately, the main market narrative continued to revolved around concerns about higher-for longer monetary policy messaging, concerns about what shape 2023’s economy may take, and the impact this could have on earnings going forward.
November headline PCE price index rose 0.1% m/m, in line with consensus and a step down from October’s 0.3% pace. Up 5.5% y/y. Core PCE up 0.2% m/m, also in line with forecasts and level with October’s pace (and up 4.7% y/y). Release noted an increase in services spending (particularly offset by a decrease in spending on goods. November new home sales up 5.8% m/m to a 640k SAAR, up from downwardly revised October print of 605k 9was 632k). Final December Michigan Consumer Sentiment marked up, while 1Y inflation expectations marked down 0.2pp to 4.4%, lowest since Jun-21. Elsewhere, headline November durable goods orders dropped 2.1% m/m, a steeper slide than the (0/7%) consensus and well below October’s 0.7% m/m increase. Core capital goods orders (non-defense, ex-aircraft) rose 0.2% m/m, a slowdown from October’s 0.6% pace. Core capital goods shipments (which feed into GDP) were down 0.1% m/m, notably slowing from October’s 1.4% rise.
Two items to note on the corporate front; Tesla continued its slide lower, now approaching double digits (from triple). It fell another 18% as questions swirled about Musk’s focus (despite a Twitter poll encouraging him to give up the reins at the social network). The stock is down 70% from its all time high in November ’21.
Wells Fargo once again settled with the Consumer Financial Protection Bureau, this time the bank was ordered by the CFPB to pay $3.7B for “widespread mismanagement” in several product lines. The consumer watchdog agency said the bank assessed fees and interest charges on loans for cars and homes. Some consumers had their vehicles illegally repossessed while others had overdraft fees unlawfully applied, the agency said.
Fixed Income
Yield Curve
November FOMC Statement November Fed Minutes Balance Sheet Reduction Plan Credit, Liquidity and Balance Sheet Federal Reserve Dot Plots Treasury.gov yields FOMC Policy Normalization Statement Longer- Run Goals Jan 2022
Foreign Exchange Market
Energy Complex
The Baker Hughes rig count increased by 3 rigs this week. There are 779 oil and gas rigs operating in the US – Up 193 over last year.
Employment Picture
Weekly Unemployment Claims – Released Thursday 12/23/2022 – The week ending December 17th observed an increase of 2k in initial claims increased to 216k. The four-week moving average of initial jobless claims was down 6.25k to 221,750.
November Jobs Report – BLS Summary – Released 12/2/2022 – The US Economy added 263k nonfarm jobs in November and the Unemployment rate was unchanged at 3.7%. Average hourly earnings increased 12 cents to $32.70. Hiring highlights include +82k Education and Health Services, +88k Leisure and Hospitality, and +42k Government.
Job Openings & Labor Turnover Survey – JOLTS – Released 11/30/2022 – The number of job openings edged down to 10.3 million on the last business day of October, the US Bureau of Labor Statistics reported. Over the month, the number of hires and total separations changed little at 6 million and 5.7 million, respectively. Within separation, quits (4 million) and layoffs and discharges (1.4 million) changed little.
Employment Cost Index – Released 10/28/2022 – Compensation costs for civilian workers increased 1.2% for the 3-month period ending in September 2022. The 12-month period ending in September 2022 saw compensation costs increased by 5%. The 12-month period ending September 2021 increased 3.7%. Wages and salaries increased 5.1% over the year and increased 4.2% for the 12-month period ending in September 2021. Benefit costs increased 4.9% over the year and increased 2.5% for the 12-month period ending in September 2021. This report is published quarterly.
This Week’s Economic Data
Personal Income – Released 12/23/2022 – Personal income increased $80.1 billion, or 0.4% in November. Disposable Personal Income increased $68.6 billion or 0.4%. Personal Consumption Expenditure increased $19.8 billion or 0.1%.
Durable Goods – Released 12/23/2022 – New orders for manufactured durable goods in November decreased $5.8 billion or 2.1% to $270.6 billion. Transportation equipment increased up $0.7 billion or 0.8% to $91.8 billion.
New Residential Sales – Released 12/23/2022 – Sales of new single-family homes increased 5.8% to 640k, seasonally adjusted, in November. The median sales price of new homes sold in November was $471,200 with an average sales price of $543,600. At the end of November, the seasonally adjusted estimate of new homes for sale was 461k. This represents a supply of 8.6 months at the current sales rate.
Third Estimate of 3rd Quarter 2022 GDP – Released 12/22/2022 – Real Gross Domestic Product (GDP) increased at an annual rate of 3.2% in the third quarter of 2022 according to the third estimate released by the Bureau of Economic Analysis, in contrast to a decrease of 0.6% in the second quarter. The “third”estimate of GDP released today is based on more complete source data than were available for the “second” estimate issued last month. In the second estimate, the increase in real GDP was 2.9%. The updated estimates primarily reflected upward revisions to consumer spending and nonresidential fixed investment that were partly offset by a downward revision to private inventory investment. The increase in the third quarter primarily reflected increases in exports and consumer spending that were partly offset by a decrease in housing investment.
Consumer Confidence – Released 12/21/2022 – The Conference Board Consumer Confidence Index increased in December. The Index now stands at 108.3 (1985+100), up from 101.4 in November.
Existing Home Sales – Released 12/21/2022 – Existing home sales decreased in November marking ten consecutive months of declines. Sales declined 7.7% to a seasonally adjusted rate of 4.09 million in November. Sales decreased 35.4% year-over-year. Housing inventory sits at 1.14 million units, down 6.6% from October’s inventory and up 2.7% over last year. Unsold inventory sits at a 3.3-month supply. The median existing home price for all housing types was $370,700 which is up 3.5% from November 2021. This marks 129 consecutive months of year-over-year increases, the longest-running streak on record.
Housing Starts – Released 12/20/2022 – New home starts in November were at a seasonally adjusted annual rate of 1.425 million; down 0.5% below October, and 16.4% below last November’s rate. Building Permits were at a seasonally adjusted annual rate of 1.342 million, down 11.2% compared to October, and down 22.4% over last year.
Recent Economic Date
Links take you to the data source
Industrial Production and Capacity Utilization – Released 12/15/2022 – In November Industrial production decreased 0.2%. Manufacturing decreased 0.6%. Utilities output increased 3.6%. Mining output decreased 0.7%. Total industrial production was 2.5% higher in November than a year ago. Total capacity utilization decreased 0.2% in November to 79.7% which is 0.1% above its long run average.
Retail Sales – Released 12/15/2022 – US retail sales for November decreased 0.6% to $689.4 billion and retail sales are 6.5% above November 2021. US retail sales for the September 2022 through November 2022 period were up 7.7% from the same period a year ago.
Consumer Price Index – Released 12/13/2022 – Consumer prices increased 0.1% m/m in November following a 0.4% increase in October. Consumer prices are up 7.1% for the 12-month period ending in November. Core consumer prices increased 0.2% m/m in November.
Producer Price Index – Released 12/09/2022 – The PPI for final demand advanced 0.3% in November, seasonally adjusted, the US Bureau of Labor Statistics reported. Final demand prices also rose 0.3% in both October and September. On an unadjusted basis, the index for final demand moved up 7.4% for the 12 months ended in November. In November, most of the increase in the index for final demand is attributable to a 0.4% advance in prices for final demand services. The index for final demand goods inched up 0.1%. Prices for final demand less foods, energy and trade services moved up 0.3% in November after rising 0.2% in October. For the 12 months ended in November, the index for final demand less goods, energy, and trade services increased 4.9%.
Consumer Credit – Released 12/7/2022 – In October, consumer credit increased at a seasonally adjusted annual rate of 6.9%. Revolving credit increased at an annual rate of 10.4%, while nonrevolving credit increased at an annual rate of 5.8%.
U.S. Trade Balance – Released 12/6/2022 – The US monthly international trade deficit increased in October 2022 according to the US Bureau of Economic Analysis and the IS Census Bureau. the deficit increased from $74.1 billion in September (revised) to $78.2 billion in October, as imports increased and exports decreased. The goods deficit increased $6.1 billion in October to $99.6 billion. The services surplus increased $2.1 billion in October to $21.4 billion.
US Light Vehicle Sales – Released 12/5/2022 – US light vehicle sales were at a seasonally adjusted annual rate of 14.144 million units in November. A decreased of 0.75 million.
PMI Non-Manufacturing Index – Released 12/5/2022 – Economic activity in the services sector grew in November for the 30th month in a row – with the Service PMI registering 56.5% – In November, the Services PMI registered 56.5%, 2.1 percentage points higher than October’s reading of 54.4%. The Business Activity Index registered 64.7%, a substantial increase of 9 percentage points compared to the reading of 55.7% in October. The New Orders Index figure of 56% is 0.5 percentage points lower than the October reading of 56.5%.
PMI Manufacturing Index – Released 12/1/2022 – The November Manufacturing PMI registered 49%, 1.2 percentage points lower than the 50.2% recorded in October. Regarding the overall economy, this figure indicates expansion for the 30th month in a row after contraction in April and May 2020. The Manufacturing PMI figure is the lowest since May 2020, when it registered 43.5%. The New Orders Index remained in contraction territory at 47.2%, 2 percentage points lower than the 49.2% recorded in October.
U.S. Construction Spending – Released 12/1/2022 – Construction spending during October 2022 was estimated at a seasonally adjusted annual rate of $1,794.9 billion, 0.3% (±1.2%)* below the revised September estimate of $1,800.1 billion. The October figure is 9.2% (±1.5%) above the October 2021 estimate of $1,644.3 billion. During the first ten months of this year, construction spending amounted to $1,507.8 billion, 10.8% (±1%) above the $1,360.8 billion for the same period in 2021.
Chicago PMI – Released 11/30/2022 – Chicago PMI remained in contraction territory and dropped significantly in November from 45.2 to 37.2. This marks the lowest reading since June 2020.
Next week we get data on Chicago PMI.
Data Sources:
Bureau of Economic Analysis (BEA)
Congressional Budget Office (CBO)
U.S. Bureau of Labor Statistics (BLS)
Federal Reserve Economic Data (FRED Charts)
CME Fed Watch
U.S. Treasury – Yields
U.S. Census Bureau
Institute for Supply Management (ISM)
Weekly DOL Employment Data
BLS Monthly Jobs Report
JOLTS
US Energy Admin (EIA)
BLS Consumer Price Index CPI
BLS Producer Price Index PPI
Atlanta Fed GDPNOW
NY Fed Nowcast GDP
US Census Bureau Housing Starts
Consumer Credit
USCB Retail Sales
Construction Spending
Federal Reserve Dot Plots
NY Empire Index
Philadelphia Federal Reserve
P/E Ratio Data -Yardeni Research
Technical Analysis Info:
StockCharts.com – Financial Charts
Exponential vs Simple moving average
Other Links:
1973 Arab Oil Embargo
Hunt Brothers Silver
Long-Term Capital bailout
Categories:
Tags: