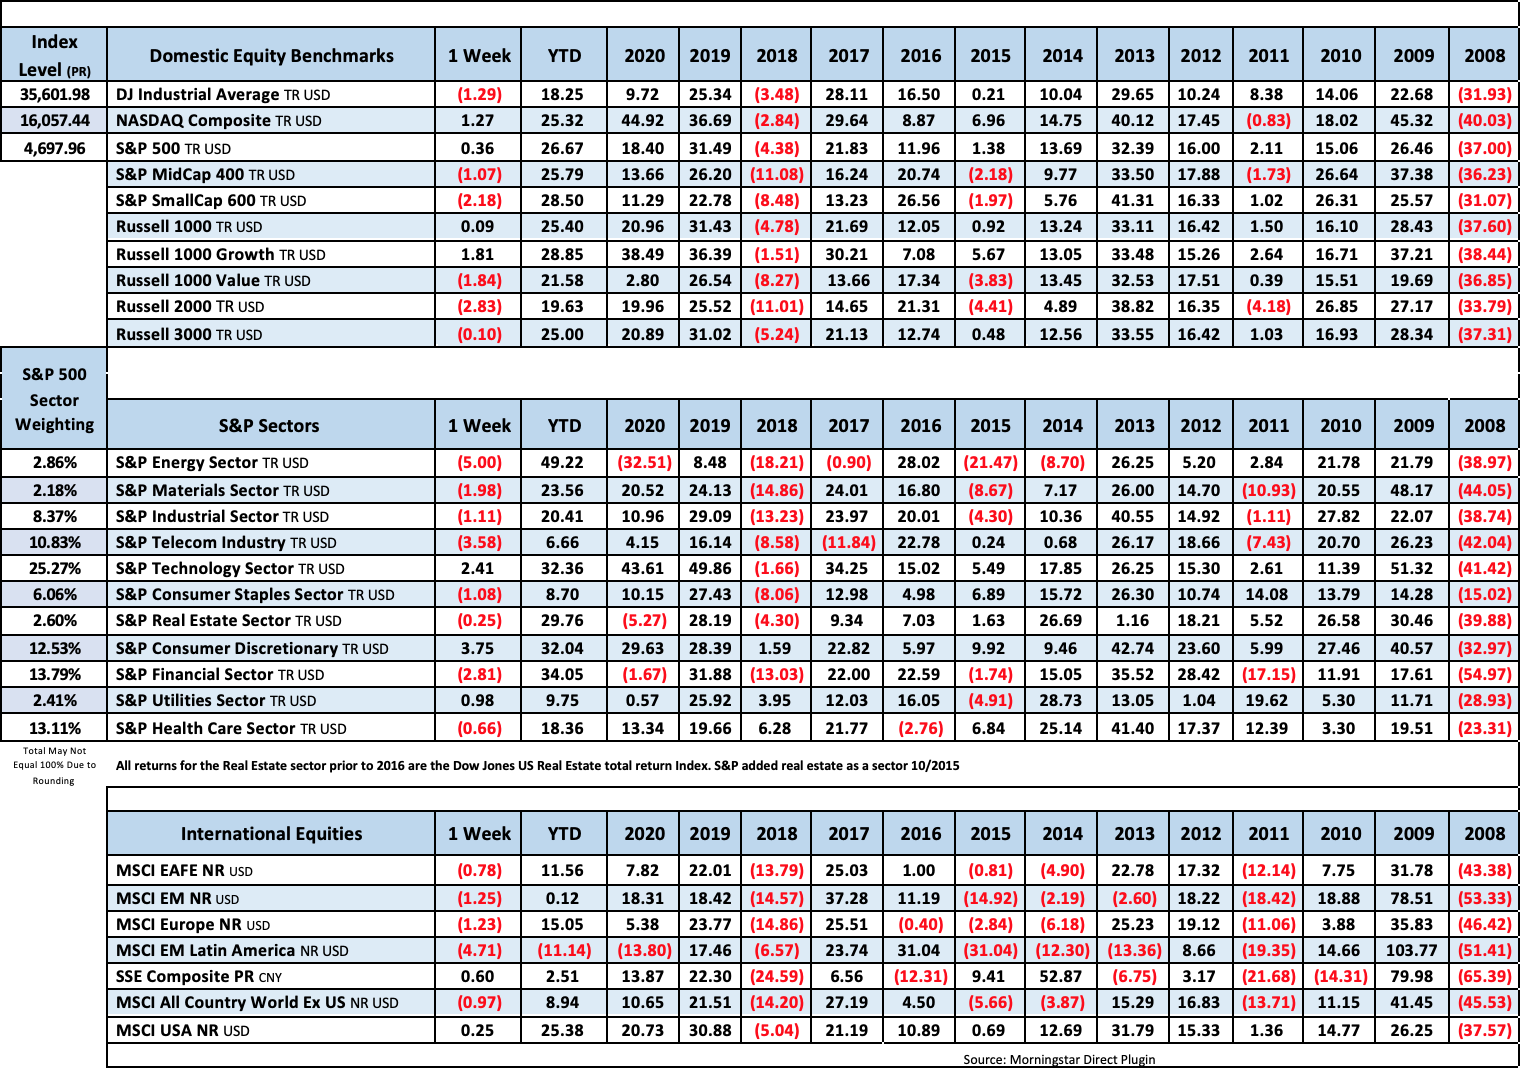
US equities were mixed this week with mega cap growth and tech leading the way. Overall growth was the clear winner gaining 1.8% while the R1k value actually feel by 1.8%. Energy put in the worst performance as oil sold off on concerns about government responses to elevated prices and worries about another Covid-hit to demand. Treasuries were mostly stronger with 10-year yields down 4 bp to 1.54%. The dollar index was up nearly 1%. Gold lost 0.9% WTI crude fell 5.8%, its fourth consecutive weekly pullback.
Worsening Covid trends were flagged as a bigger overhang on risk sentiment this week after sharp declines in September and October (in covid cases) formed a key piece of the bullish narrative for stocks. Europe was a big area of concern with Austria about to enter its fourth national lockdown and Germany saying it may consider a similar move. From a market perspective, vaccines have been a fairly reliable counter to case flare-ups. On Friday, the FDA authorized both the vaccine booster shots from Pfizer, BioNTech and Moderna.
We are waiting on Fed chair decision from the White House but seems likely that a decision would come before Thanksgiving. There is still a good chance that Jerome Powell may retain his role at the fed.
The House passed the $1.75T Build Back Better social spending package on Friday after a CBO score that was acceptable to moderates. However, the Senate is not expected to take up the matter until December and while it is ultimately expected to pass, the path will remain complicated given the changes favored by centrists like Manchin and Sinema, along with all of the noise surrounding inflation.
The Debt ceiling is still in play. Treasury Secretary Yellen this week pushed back the potential default date a bit to 15-Dec, while multiple reports discussed how Schumer and McConnell had begun talks about the debt ceiling. However, it still seems as if the only concession Republicans will offer is a fast reconciliation process during which Democrats will have to raise the debt ceiling on their own.
The Biden-Xi meeting early in the week was a non-event for the market as trade was largely relegated to the back burner. However, there continue to be thoughts that the White House could ultimately dial back tariffs to help with inflation. JPMorgan noted that a reversal of existing tariffs could represent a direct EPS benefit of $5 for the S&P 500.

Fixed Income
September FOMC Statement Credit, Liquidity and Balance Sheet Federal Reserve Dot Plots Sep 21′
US Corporate Debt Tops 7 Trillion. Treasury.gov yields FOMC Policy Normalization Statement Longer Run Goals August 2020
Global Bond Yields
Daily US Treasury Yields
Foreign Exchange Market
Energy Complex
The Baker Hughes rig count increased by 7 this week. There are 563 oil and gas rigs operating in the US – Up 253 over last year.
Metals Complex
Employment Picture
Weekly Unemployment Claims – Released Thursday 11/18/2021 – The week ending November 13th experienced a decrease of 1k in initial claims declining to 268k. This marks the lowest level of initial claims since March 14, 2020. The four-week moving average of initial jobless claims decreased 5.75k to 272.75k.
Job Openings & Labor Turnover Survey JOLTS – Released 11/12/2021 – The U.S. Bureau of Labor Statistics reported the number and rate of job openings was little changed at 10.4 million on the last business day of September. Over the month, hires were little changed at 6.5 million and separations were little changed at 6.2 million. Within separations, the quits rate increased to 3.0%. The layoffs and discharges rates were unchanged at 0.9%.
October Jobs Report – BLS Summary Released 11/5/2021 – The US Economy added 531k nonfarm jobs in September and the Unemployment rate edged down to 4.6%. Average hourly earnings increased by 11 cents to $30.96. Hiring highlights include+164k Leisure and Hospitality, +100k Professional and Business Services, and +60 in Manufacturing.
- Average hourly earnings increased by 11 cents or 0.4%.
- U3 unemployment rate declined 0.4% to 4.8%. U6 unemployment rate declined to 8.5%.
- The labor force participation rate was unchanged changed at 61.6%.
- Average work week decreased 0.1 hours to 34.7 hours.
Employment Cost Index – Released 10/29/2021 – Compensation costs for civilian workers increased 1.3% for the 3-month period ending in September 2021. The 12-month period ending in September 2021 saw compensation costs increase by 3.7%. The 12-month period ending September 2020 increased 2.4%. Wages and salaries increased 4.2 percent over the year and increased 2.5 percent for the 12-month period ending in September 2020. Benefit costs increased 2.5 percent over the year and increased 2.3 percent for the 12-month period ending in September 2020. This report is published quarterly.
This Week’s Economic Data
Links take you to the data source
Housing Starts – Released 11/17/2021 – New home starts in October were at a seasonally adjusted annual rate of 1.520 million; down 0.7% below September, but 0.4% above last October’s rate. Building Permits were at a seasonally adjusted annual rate of 1.650 million, up 4.0% compared to September, and up 3.4% over last year.
Industrial Production and Capacity Utilization – Released 11/16/2021 – In October Industrial production increased 1.6%. Manufacturing increased 1.2%. Utilities output increased 1.2%. Mining output increased 4.1%. Total industrial production was 5.1% higher in October than a year ago. Total capacity utilization increased 1.2% to 76.4% in October which is 3.2% below its long run average.
Retail Sales – Released 11/16/2021 – U.S. retail sales for October increased 1.7% to $638.2 billion and retail sales are 16.3% above October 2020. U.S. retail sales for the August 2021 through October 2021 period were up 15.4% from the same period a year ago.
Recent Economic Data
Links take you to the data source
Consumer Price Index – Released 11/10/2021 – Consumer prices rose 0.9% m/m in October following a 0.4% gain in September. Core consumer prices increased 0.6% m/m in October following a 0.2% gain in September.
Producer Price Index – Released 11/9/2021 – The Producer Price Index for final demand increased 0.6% in October. PPI less food and energy increased 0.5% in October. The change in PPI for final demand has increased 8.6% year/y.
Consumer Credit – Released 11/5/2021 – Consumer credit increased at a seasonally adjusted annual rate of 5.6 percent in August. Revolving credit increased at an annual rate of 7.4 percent, while nonrevolving credit increased at an annual rate of 5.1 percent.
U.S. Trade Balance – Released 11/4/2021 – According to the U.S. Census Bureau of Economic Analysis the goods and services deficit increased in September by $8.1 billion to $80.9 billion. September exports were $207.6 billion, $6.4 billion less than August exports. September imports were $288.5 billion, $1.7 billion more than August imports. Year to date the goods and services deficit increased $158.7 billion or 33.1%, from the same period in 2020. Year to date exports and imports increased $274.1 billion or 17.4% and increased $432.8 billion or 21.1% respectively.
PMI Non-Manufacturing Index – Released 11/3/2021 – Economic activity in the non-manufacturing sector grew in October for the 17th consecutive month. ISM Non-Manufacturing registered 66.7 percent, which is 4.8 percentage points above the adjusted September reading of 61.9 percent.
PMI Manufacturing Index – Released 11/1/2021 – October PMI decreased 0.3% to 60.8% down from September’s reading of 61.1%. The New Orders Index was 59.8% down 6.9% from September’s reading of 66.7%. The Production Index registered 59.3%, down 0.1%.
U.S. Construction Spending – Released 11/1/2021 – Construction spending declined 0.5% in September measuring at a seasonally adjusted annual rate of $1,573.6 billion. The September figure is 7.8% above the September 2020 estimate. Private construction spending was 0.5% below the revised August estimate at $1,229.9 billion. Public construction spending was 0.7% below the revised August estimate at $343.7 billion.
US Light Vehicle Sales – Released 10/29/2021 – U.S. light vehicle sales were at a seasonally adjusted annual rate (SAAR) of 12.158 million units in September.
Chicago PMI – Released 10/29/2021 – Chicago PMI increased to 68.4 points in October, following two months of decline. Among the main five indicators, four were higher, led by Order backlogs and Employment. Only Production fell across the month.
Personal Income – Released 10/29/2021 – Personal income decreased $216.2 billion or 1.0 percent in September according to estimates released today by the Bureau of Economic Analysis. Disposable personal income (DPI) decreased $236.9 billion or 1.3 percent and personal consumption expenditures (PCE) increased $93.4 billion or 0.6 percent.
Advance Estimate of 3rd Quarter 2021 GDP – Released 10/28/2021 – Real gross domestic product (GDP) increased at an annual rate of 2.0 percent in the third quarter of 2021, according to the advance estimate released by the Bureau of Economic Analysis. GDP increased 6.7% in the second quarter of 2021. The advance estimate is based on source data that are incomplete or subject to further revision. The increase in real GDP in the third quarter reflected increases in private inventory investment, personal consumption expenditures (PCE), state and local government spending, and nonresidential fixed investment that were partly offset by decreases in residential fixed investment, federal government spending, and exports. Imports, which are a subtraction in the calculation of GDP, increased.
Durable Goods – Released 10/27/2021 – New orders for manufactured durable goods in September decreased $1.0 billion or 0.4% to $261.3 billion. Transportation equipment led the decrease falling $1.8 billion or 2.3% to $77.7 billion.
New Residential Sales – Released 10/26/2021 – Sales of new single-family homes increased 14.0% to 800k, seasonally adjusted, in September. The median sales price of new homes sold in September was $408,800 with an average sales price of $451,700. At the end of September, the seasonally adjusted estimate of new homes for sale was 379k. This represents a supply of 5.7 months at the current sales rate.
Consumer Confidence – Released 10/26/2021 – The Consumer confidence index increased in October. The Index now stands at 113.8, up from 109.8 in September.
Existing Home Sales – Released 10/21/2021 – Existing home sales increased in September. Sales rose 7.0% to a seasonally adjusted rate of 6.29 million in September. Sales are currently down 2.3% from one year ago. Housing inventory sits at 1.27 million units. Down 0.8% from August’s inventory. Down 13.0% over last year. Unsold inventory sits at a 2.4-month supply. The median existing home price for all housing types was $352,800.
Next week we get data on Existing Home Sales, New Residential Sales, Durable Goods, Personal Income, and the Second Estimate of 3rd Quarter 2021 GDP.
Data Sources:
Bureau of Economic Analysis (BEA)
Congressional Budget Office (CBO)
U.S. Bureau of Labor Statistics (BLS)
Federal Reserve Economic Data (FRED Charts)
CME Fed Watch
U.S. Treasury – Yields
U.S. Census Bureau
Institute for Supply Management (ISM)
Weekly DOL Employment Data
BLS Monthly Jobs Report
JOLTS
US Energy Admin (EIA)
BLS Consumer Price Index CPI
BLS Producer Price Index PPI
Atlanta Fed GDPNOW
NY Fed Nowcast GDP
US Census Bureau Housing Starts
Consumer Credit
USCB Retail Sales
Construction Spending
Federal Reserve Dot Plots
NY Empire Index
Philadelphia Federal Reserve
P/E Ratio Data -Yardeni Research
Technical Analysis Info:
StockCharts.com – Financial Charts
Exponential vs Simple moving average
Other Links:
1973 Arab Oil Embargo
Hunt Brothers Silver
Long-Term Capital bailout


Week 45 Talking Points
US equities were mixed this week with mega cap growth and tech leading the way. Overall growth was the clear winner gaining 1.8% while the R1k value actually feel by 1.8%. Energy put in the worst performance as oil sold off on concerns about government responses to elevated prices and worries about another Covid-hit to demand. Treasuries were mostly stronger with 10-year yields down 4 bp to 1.54%. The dollar index was up nearly 1%. Gold lost 0.9% WTI crude fell 5.8%, its fourth consecutive weekly pullback.
Worsening Covid trends were flagged as a bigger overhang on risk sentiment this week after sharp declines in September and October (in covid cases) formed a key piece of the bullish narrative for stocks. Europe was a big area of concern with Austria about to enter its fourth national lockdown and Germany saying it may consider a similar move. From a market perspective, vaccines have been a fairly reliable counter to case flare-ups. On Friday, the FDA authorized both the vaccine booster shots from Pfizer, BioNTech and Moderna.
We are waiting on Fed chair decision from the White House but seems likely that a decision would come before Thanksgiving. There is still a good chance that Jerome Powell may retain his role at the fed.
The House passed the $1.75T Build Back Better social spending package on Friday after a CBO score that was acceptable to moderates. However, the Senate is not expected to take up the matter until December and while it is ultimately expected to pass, the path will remain complicated given the changes favored by centrists like Manchin and Sinema, along with all of the noise surrounding inflation.
The Debt ceiling is still in play. Treasury Secretary Yellen this week pushed back the potential default date a bit to 15-Dec, while multiple reports discussed how Schumer and McConnell had begun talks about the debt ceiling. However, it still seems as if the only concession Republicans will offer is a fast reconciliation process during which Democrats will have to raise the debt ceiling on their own.
The Biden-Xi meeting early in the week was a non-event for the market as trade was largely relegated to the back burner. However, there continue to be thoughts that the White House could ultimately dial back tariffs to help with inflation. JPMorgan noted that a reversal of existing tariffs could represent a direct EPS benefit of $5 for the S&P 500.
Table of Contents
Fixed Income
September FOMC Statement Credit, Liquidity and Balance Sheet Federal Reserve Dot Plots Sep 21′
US Corporate Debt Tops 7 Trillion. Treasury.gov yields FOMC Policy Normalization Statement Longer Run Goals August 2020
Global Bond Yields
Daily US Treasury Yields
Foreign Exchange Market
Energy Complex
The Baker Hughes rig count increased by 7 this week. There are 563 oil and gas rigs operating in the US – Up 253 over last year.
Metals Complex
Employment Picture
Weekly Unemployment Claims – Released Thursday 11/18/2021 – The week ending November 13th experienced a decrease of 1k in initial claims declining to 268k. This marks the lowest level of initial claims since March 14, 2020. The four-week moving average of initial jobless claims decreased 5.75k to 272.75k.
Job Openings & Labor Turnover Survey JOLTS – Released 11/12/2021 – The U.S. Bureau of Labor Statistics reported the number and rate of job openings was little changed at 10.4 million on the last business day of September. Over the month, hires were little changed at 6.5 million and separations were little changed at 6.2 million. Within separations, the quits rate increased to 3.0%. The layoffs and discharges rates were unchanged at 0.9%.
October Jobs Report – BLS Summary Released 11/5/2021 – The US Economy added 531k nonfarm jobs in September and the Unemployment rate edged down to 4.6%. Average hourly earnings increased by 11 cents to $30.96. Hiring highlights include+164k Leisure and Hospitality, +100k Professional and Business Services, and +60 in Manufacturing.
Employment Cost Index – Released 10/29/2021 – Compensation costs for civilian workers increased 1.3% for the 3-month period ending in September 2021. The 12-month period ending in September 2021 saw compensation costs increase by 3.7%. The 12-month period ending September 2020 increased 2.4%. Wages and salaries increased 4.2 percent over the year and increased 2.5 percent for the 12-month period ending in September 2020. Benefit costs increased 2.5 percent over the year and increased 2.3 percent for the 12-month period ending in September 2020. This report is published quarterly.
This Week’s Economic Data
Links take you to the data source
Housing Starts – Released 11/17/2021 – New home starts in October were at a seasonally adjusted annual rate of 1.520 million; down 0.7% below September, but 0.4% above last October’s rate. Building Permits were at a seasonally adjusted annual rate of 1.650 million, up 4.0% compared to September, and up 3.4% over last year.
Industrial Production and Capacity Utilization – Released 11/16/2021 – In October Industrial production increased 1.6%. Manufacturing increased 1.2%. Utilities output increased 1.2%. Mining output increased 4.1%. Total industrial production was 5.1% higher in October than a year ago. Total capacity utilization increased 1.2% to 76.4% in October which is 3.2% below its long run average.
Retail Sales – Released 11/16/2021 – U.S. retail sales for October increased 1.7% to $638.2 billion and retail sales are 16.3% above October 2020. U.S. retail sales for the August 2021 through October 2021 period were up 15.4% from the same period a year ago.
Recent Economic Data
Links take you to the data source
Consumer Price Index – Released 11/10/2021 – Consumer prices rose 0.9% m/m in October following a 0.4% gain in September. Core consumer prices increased 0.6% m/m in October following a 0.2% gain in September.
Producer Price Index – Released 11/9/2021 – The Producer Price Index for final demand increased 0.6% in October. PPI less food and energy increased 0.5% in October. The change in PPI for final demand has increased 8.6% year/y.
Consumer Credit – Released 11/5/2021 – Consumer credit increased at a seasonally adjusted annual rate of 5.6 percent in August. Revolving credit increased at an annual rate of 7.4 percent, while nonrevolving credit increased at an annual rate of 5.1 percent.
U.S. Trade Balance – Released 11/4/2021 – According to the U.S. Census Bureau of Economic Analysis the goods and services deficit increased in September by $8.1 billion to $80.9 billion. September exports were $207.6 billion, $6.4 billion less than August exports. September imports were $288.5 billion, $1.7 billion more than August imports. Year to date the goods and services deficit increased $158.7 billion or 33.1%, from the same period in 2020. Year to date exports and imports increased $274.1 billion or 17.4% and increased $432.8 billion or 21.1% respectively.
PMI Non-Manufacturing Index – Released 11/3/2021 – Economic activity in the non-manufacturing sector grew in October for the 17th consecutive month. ISM Non-Manufacturing registered 66.7 percent, which is 4.8 percentage points above the adjusted September reading of 61.9 percent.
PMI Manufacturing Index – Released 11/1/2021 – October PMI decreased 0.3% to 60.8% down from September’s reading of 61.1%. The New Orders Index was 59.8% down 6.9% from September’s reading of 66.7%. The Production Index registered 59.3%, down 0.1%.
U.S. Construction Spending – Released 11/1/2021 – Construction spending declined 0.5% in September measuring at a seasonally adjusted annual rate of $1,573.6 billion. The September figure is 7.8% above the September 2020 estimate. Private construction spending was 0.5% below the revised August estimate at $1,229.9 billion. Public construction spending was 0.7% below the revised August estimate at $343.7 billion.
US Light Vehicle Sales – Released 10/29/2021 – U.S. light vehicle sales were at a seasonally adjusted annual rate (SAAR) of 12.158 million units in September.
Chicago PMI – Released 10/29/2021 – Chicago PMI increased to 68.4 points in October, following two months of decline. Among the main five indicators, four were higher, led by Order backlogs and Employment. Only Production fell across the month.
Personal Income – Released 10/29/2021 – Personal income decreased $216.2 billion or 1.0 percent in September according to estimates released today by the Bureau of Economic Analysis. Disposable personal income (DPI) decreased $236.9 billion or 1.3 percent and personal consumption expenditures (PCE) increased $93.4 billion or 0.6 percent.
Advance Estimate of 3rd Quarter 2021 GDP – Released 10/28/2021 – Real gross domestic product (GDP) increased at an annual rate of 2.0 percent in the third quarter of 2021, according to the advance estimate released by the Bureau of Economic Analysis. GDP increased 6.7% in the second quarter of 2021. The advance estimate is based on source data that are incomplete or subject to further revision. The increase in real GDP in the third quarter reflected increases in private inventory investment, personal consumption expenditures (PCE), state and local government spending, and nonresidential fixed investment that were partly offset by decreases in residential fixed investment, federal government spending, and exports. Imports, which are a subtraction in the calculation of GDP, increased.
Durable Goods – Released 10/27/2021 – New orders for manufactured durable goods in September decreased $1.0 billion or 0.4% to $261.3 billion. Transportation equipment led the decrease falling $1.8 billion or 2.3% to $77.7 billion.
New Residential Sales – Released 10/26/2021 – Sales of new single-family homes increased 14.0% to 800k, seasonally adjusted, in September. The median sales price of new homes sold in September was $408,800 with an average sales price of $451,700. At the end of September, the seasonally adjusted estimate of new homes for sale was 379k. This represents a supply of 5.7 months at the current sales rate.
Consumer Confidence – Released 10/26/2021 – The Consumer confidence index increased in October. The Index now stands at 113.8, up from 109.8 in September.
Existing Home Sales – Released 10/21/2021 – Existing home sales increased in September. Sales rose 7.0% to a seasonally adjusted rate of 6.29 million in September. Sales are currently down 2.3% from one year ago. Housing inventory sits at 1.27 million units. Down 0.8% from August’s inventory. Down 13.0% over last year. Unsold inventory sits at a 2.4-month supply. The median existing home price for all housing types was $352,800.
Next week we get data on Existing Home Sales, New Residential Sales, Durable Goods, Personal Income, and the Second Estimate of 3rd Quarter 2021 GDP.
Data Sources:
Bureau of Economic Analysis (BEA)
Congressional Budget Office (CBO)
U.S. Bureau of Labor Statistics (BLS)
Federal Reserve Economic Data (FRED Charts)
CME Fed Watch
U.S. Treasury – Yields
U.S. Census Bureau
Institute for Supply Management (ISM)
Weekly DOL Employment Data
BLS Monthly Jobs Report
JOLTS
US Energy Admin (EIA)
BLS Consumer Price Index CPI
BLS Producer Price Index PPI
Atlanta Fed GDPNOW
NY Fed Nowcast GDP
US Census Bureau Housing Starts
Consumer Credit
USCB Retail Sales
Construction Spending
Federal Reserve Dot Plots
NY Empire Index
Philadelphia Federal Reserve
P/E Ratio Data -Yardeni Research
Technical Analysis Info:
StockCharts.com – Financial Charts
Exponential vs Simple moving average
Other Links:
1973 Arab Oil Embargo
Hunt Brothers Silver
Long-Term Capital bailout
Categories:
Tags: