Good Life Advisors – Talking Points – Week 42
Big week for equity markets and an even bigger move off the lows from last Thursday. Is it just a bear market rally or was Thursday a potential market bottom?
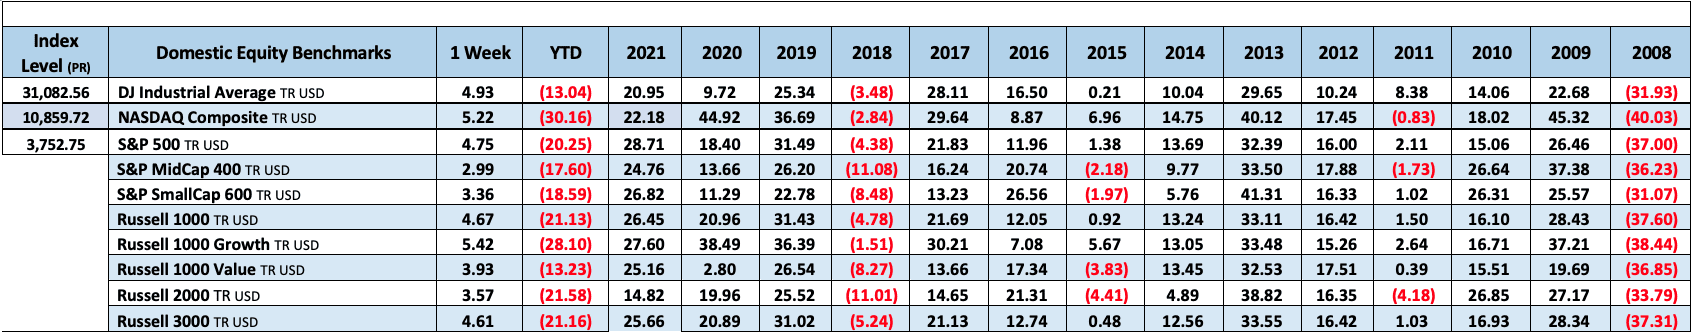
The S&P 500 jumped 4.75% this week and more than 7% off the year low from last Thursday (3,491). Stocks rallied with a couple of pieces in play. Technical and mechanical factors, as well as deeply depressed sentiment and positioning remained keys to the upside narrative this week. Yields remained a bit of a headwind this week on factors including a hawkish Fed, QT and some rising liquidity concerns. However, there were some press focus on some investors calling peak yields and markets bets reflecting the most bullish positioning on longer-dated Treasuries on record. The market shifts have come amid the longest streak of Treasury losses since 1984, which pushed the 2Y and 10Y yields to the highest levels since 2007 this week.
There was also some tailwinds from the latest UK updates including the U-turn on the fiscal policy plan and PM Truss’ resignation, falling European natural gas prices, and some more discussion about the low earnings bar (despite some cautious takeaways from this week’s batch of earnings). Some easing of Chinese Covid travel restrictions and a weaker dollar also added a bit of support this week. Fx remained a big ongoing theme, including an intervention by Japan’s government and central bank of Friday after the yen at one point hit a fresh 30-year high.
However, there is still much skepticism over the durability of the recent rally given still-elevated inflation, more data showing labor market resilience, and ongoing risks to earnings estimates. Morgan Stanley said we are only about three months in from the early July peak in estimates, though earnings recessions typically take 15 months to play out. Citi also noted the latest market downdraft has been driven by higher rates and not higher equity risk premium, which are up only 14 bp from the Apr-21 trough. Goldman Sachs also pointed out most absolute valuation metrics show US stocks remain expensive vs history.
Market expectations for a peak fed funds rate hit 5-5.25% range earlier this week, up by two rate hikes w/w. However, there was a bit of a pullback around expectations on Friday after some seemingly dovish signals from WSJ’s Nick Timiraos, who noted the Fed is set to hike by 75bp at the Nov 1-2 meeting, but officials could also be entertaining a 50bp hike in December (though coupled with a higher dot plot). SF President Daly (non-voter) and Chicago’s Evan (non-voter) were also among those who warned of risks of being too reactive and overtightening. However, Cleveland’s Mester (voter) said she supports 75bp hikes in the next two meetings and that wishful thinking can’t drive policy decisions. There was still some uncertainty around whether a shift down to 50bp in December or a pause in early 2023 would actually constitute a pivot as the policy rate will approach the Fed’s and market’s own projections in the months ahead, while officials have continued to push data-dependence and the lagged impact of this year’s policy decisions.
Earnings season continued to ramp up this week. Some of the key themes included ongoing pressure from elevated labor and freight costs and supply chain constraints, macro headwinds and weaker consumer demand, and a weakening online ad backdrop. On the positive side, BAC +10.3% and GS +8.4% both offered stronger results, though a number of regional banks offered a mixed picture. This week also saw pricing strength and consumer resilience, better tech hardware and semi performance than expected, and some positive streaming updates. While there has been some fear that downward earnings revisions could be one of the next catalysts to move the market lower, that has been in part offset by estimates that may prove stickier givin lingering pricing power and strong consumer and corporate balance sheets. In addition, an eventual earnings reset may be cushioned by the outsized multiple contraction that has already been responsible for all of the 2022 drawdown.

Fixed Income
The 10-year treasury yield closed at 4.21% that’s the highest since June 2008. This pushed the US Agg down again bringing the YTD return to a negative 16.74%.
Yield Curve
September FOMC Statement July Fed Minutes Balance Sheet Reduction Plan Credit, Liquidity and Balance Sheet Federal Reserve Dot Plots Treasury.gov yields FOMC Policy Normalization Statement Longer- Run Goals Jan 2022
Foreign Exchange Market
Energy Complex
The Baker Hughes rig count increased by 2 this week. There are 771 oil and gas rigs operating in the US- Up 229 over last year.
Metals Complex
Employment Picture
Weekly Unemployment Claims – Released Thursday 10/6/2022 – The week ending October 15th observed a decrease of 12k in initial claims decreasing to 214k. The four week moving average of initial jobless claims increased 1.25k to 212.25k.
September Jobs Report – BLS Summary – Released 10/7/2022 – The US Economy added 263k nonfarm jobs in September and the Unemployment rate stayed decreased to 3.5%. Average hourly earnings increased 10 to $32.46. Hiring highlights include +90k Education and Health Services, +83k Leisure and Hospitality, and +46k Professional and Business Services.
- Average hourly earnings increased 10 cents to $32.46.
- U3 unemployment rate remained decreased 0.2% to 3.5%. U5 unemployment rate decreased 0.3% to 6.7%.
- The labor force participation rate was little changed at 62.4%.
- Average work week was unchanged at 34.5 hours.
Job Openings & Labor Turnover Survey – JOLTS – Released 10/4/2022 – The US Bureau of Labor Statistics reported the number and rate of job openings decreased to 10.2 million on the last business day of August. Over the month, hires were little changed at 6.3 million and separations were little changed at 6 million. Within separations, quits were little changed at 4.2 million. The layoffs and discharges rates were little changed at 1.5 million.
Employment Cost Index – Released 7/29/2022 – Compensation costs for civilian workers increased 1.3% for the 3-month period ending in June 2022. The 12-month period ending in June 2022 saw compensation costs increase by 5.1%. The 12-month period ending in June 2021 increased 2.9%. Wages and salaries increased 5.3% over the year and increased 3.2% for the 12-month period ending in June 2021. Benefit costs increased 4.8% over the year and increased 2.2% for the 12-month period ending in June 2021. This report is published quarterly.
This Week’s Economic Data
Links take you to the data source
Existing Home Sales – Released 10/20/2022 – Existing home sales decreased in September marking eight consecutive months of declines. Sales declined 1.5% to a seasonally adjusted rate of 4.71 million in September. Sales decreased 23.8% year/year. Housing inventory sits at 1.25 million units. Down 2.3% from August’s inventory and down 0.8% over last year. Unsold inventory sits at a 3.2 month supply. The median existing home price for all housing types was $384,800 which is up 8.4% from August 2021. This marks 127 consecutive months of year/year increases, the longest running streak on record.
Housing Starts –Released 10/19/2022 – New home starts in September were at a seasonally adjusted annual rate of 1.439 million; down 8.1% below August, and 7.7% below last September’s rate. Building Permits were at a seasonally adjusted annual rate of 1.564 million, up 1.4% compared to August, but down 3.2% over last year.
Industrial Production and Capacity Utilization – Released 10/18/2022 – In September, Industrial production increased 0.4%, manufacturing increased increased 0.4%, utilities output decreased 0.3%, mining output increased 0.6%, total industrial production was 5.3% higher in September than a year ago, total capacity utilization increased 0.2% in September to 80.3% which is 0.7% above its long run average.
Recent Economic Data
Links take you to the data source
Retail Sales – Released 10/14/2022 – US retail sales for September were roughly the same at $684 billion and retail sales are 8.2% above September 2021. US retail sales for the July 2022 through September 2022 period were up 9.2% from the same period a year ago.
Consumer Price Index – Released 10/13/2022 – Consumer prices increased 0.4% m/m in September following a 0.1% increase in August. Consumer prices are up 8.2% for the 12-month period ending in September. Core consumer prices increased 0.6% m/m in September.
Producer Price Index – Released 10/12/2022 – The producer price index for final demand increased 0.4% in September. PPI less food and energy was flat. The change in PPI for final demand has increased 8.5% year/y.
Consumer Credit – Released 10/7/2022 – Consumer credit increased at a seasonally adjusted annual rate of 8.3% in August 2022. Revolving credit increased at an annual rate of 18.1%, while nonrevolving credit increased at an annual rate of 5.1%.
US Light Vehicle Sales – Released 10/7/2022 – US light vehicle sales were at a seasonally adjusted annual rate of 13.492 million units in September.
U.S. Trade Balance – Released 10/5/2022 – According to the US Census Bureau of Economic Analysis, the goods and services deficit decreased in August by $3.2 billion to $67.4 billion. August exports were $258.9 billion, $0.7 billion less than July exports. August imports were 4326.3 billion, $3.7 billion less than July imports. Year to date, the goods and services deficit increased $132.3 billion, or 24.4%, from the same period in 2021. Exports increased $329.8 billion or 19.9%. Imports increased $462.1 billion or 21%.
PMI Non-Manufacturing Index – Released 10/5/2022 – Economic activity in the non-manufacturing sector grew in September for the 28th consecutive month. ISM Non-Manufacturing registered 56.7%, which is 0.2 percentage points below the August reading of 56.9%.
PMI Manufacturing Index – Released 10/3/2022 – September PMI declined 1.9% registering 50.9%. The New Orders Index fell into contractionary territory at 47.1% down 4.2%. The Production Index registered 50.6%, up 0.2%.
U.S. Construction Spending – Released 10/3/2022 – Construction spending decreased 0.7% in August measuring at a seasonally adjusted annual rate of $1,781.3 billion. The August figure is 8.5% above the August 2021 estimate. Private construction spending declined 0.6% from the revised July estimate at $1,426 billion. Public construction spending was 0.8% below the revised July estimate at $355.3 billion.
Chicago PMI – Released 9/30/2022 – Chicago PMI declined sharply in September from 52.2 to 45.7.
Personal Income – Released 9/30/2022 – Personal income increased $71.6 billion or 0.3% in August according to estimate released today by the Bureau of Economic Analysis. Disposable Personal Income (DPI) increased $67.6 billion or 0.4% and Personal Consumption Expenditures (PCE) increased $67.5 billion or 0.4%.
Third Estimate of 2nd Quarter 2022 GDP – Released 9/29/2022 – Real gross domestic product decreased at an annual rate of 0.6% in the second quarter of 2022, according to the third estimate released by the Bureau of Economic Analysis. GDP decreased 1.6% in the first quarter of 2022. Two quarters of negative GDP growth marks a technical recession. The GDP estimate released today is based on source data that are more complete than that of the second estimate which saw real GDP decline 0.6% and the advance estimate and which saw real GDP decline 0.9% in the second quarter of 2022. The decrease in real GDP reflected decreased in private inventory investment, residential fixed investment, federal government spending, state and local government spending, and nonresidential fixed investment that were partly offset by increased in exports and personal consumption expenditures. Imports, which are a subtraction in the calculation of GDP, increased. The update primarily reflected an upward revision to consumer spending that was offset by a downward revision to exports. Imports, which are a subtraction in the calculation of GDP, were revised down.
Consumer Confidence – Released 9/27/2022 – The consumer confidence index increased in September following an increase in August. The index now stands at 108, up from 103.6 in August.
Consumer Confidence – Released 9/27/2022 – New orders for manufactured durable goods in August decreased $0.6 billion or 0.2% to $272.7 billion. Transportation equipment led the decreased down $1 billion or 1.1% to $92 billion.
New Residential Sales – Released 9/27/2022 – Sales of new single-family homes increased 28.8% to 685k, seasonally adjusted, in August. The median sales price of new homes sold in August was $436,800 with an average sales price of $521,800. At the end of August, the seasonally adjusted estimate of new homes for sale was 461k. This represents a supply of 8.1 months at the current sales rate.
Next week we get data on New Residential Sales, Durable Goods, Consumer Confidence, the Advance Estimate of 3rd Quarter 2022 GDP, and Personal Income.
Data Sources:
Bureau of Economic Analysis (BEA)
Congressional Budget Office (CBO)
U.S. Bureau of Labor Statistics (BLS)
Federal Reserve Economic Data (FRED Charts)
CME Fed Watch
U.S. Treasury – Yields
U.S. Census Bureau
Institute for Supply Management (ISM)
Weekly DOL Employment Data
BLS Monthly Jobs Report
JOLTS
US Energy Admin (EIA)
BLS Consumer Price Index CPI
BLS Producer Price Index PPI
Atlanta Fed GDPNOW
NY Fed Nowcast GDP
US Census Bureau Housing Starts
Consumer Credit
USCB Retail Sales
Construction Spending
Federal Reserve Dot Plots
NY Empire Index
Philadelphia Federal Reserve
P/E Ratio Data -Yardeni Research
Technical Analysis Info:
StockCharts.com – Financial Charts
Exponential vs Simple moving average
Other Links:
1973 Arab Oil Embargo
Hunt Brothers Silver
Long-Term Capital bailout


Week 42 Talking Points
Table of Contents
Good Life Advisors – Talking Points – Week 42
Big week for equity markets and an even bigger move off the lows from last Thursday. Is it just a bear market rally or was Thursday a potential market bottom?
The S&P 500 jumped 4.75% this week and more than 7% off the year low from last Thursday (3,491). Stocks rallied with a couple of pieces in play. Technical and mechanical factors, as well as deeply depressed sentiment and positioning remained keys to the upside narrative this week. Yields remained a bit of a headwind this week on factors including a hawkish Fed, QT and some rising liquidity concerns. However, there were some press focus on some investors calling peak yields and markets bets reflecting the most bullish positioning on longer-dated Treasuries on record. The market shifts have come amid the longest streak of Treasury losses since 1984, which pushed the 2Y and 10Y yields to the highest levels since 2007 this week.
There was also some tailwinds from the latest UK updates including the U-turn on the fiscal policy plan and PM Truss’ resignation, falling European natural gas prices, and some more discussion about the low earnings bar (despite some cautious takeaways from this week’s batch of earnings). Some easing of Chinese Covid travel restrictions and a weaker dollar also added a bit of support this week. Fx remained a big ongoing theme, including an intervention by Japan’s government and central bank of Friday after the yen at one point hit a fresh 30-year high.
However, there is still much skepticism over the durability of the recent rally given still-elevated inflation, more data showing labor market resilience, and ongoing risks to earnings estimates. Morgan Stanley said we are only about three months in from the early July peak in estimates, though earnings recessions typically take 15 months to play out. Citi also noted the latest market downdraft has been driven by higher rates and not higher equity risk premium, which are up only 14 bp from the Apr-21 trough. Goldman Sachs also pointed out most absolute valuation metrics show US stocks remain expensive vs history.
Market expectations for a peak fed funds rate hit 5-5.25% range earlier this week, up by two rate hikes w/w. However, there was a bit of a pullback around expectations on Friday after some seemingly dovish signals from WSJ’s Nick Timiraos, who noted the Fed is set to hike by 75bp at the Nov 1-2 meeting, but officials could also be entertaining a 50bp hike in December (though coupled with a higher dot plot). SF President Daly (non-voter) and Chicago’s Evan (non-voter) were also among those who warned of risks of being too reactive and overtightening. However, Cleveland’s Mester (voter) said she supports 75bp hikes in the next two meetings and that wishful thinking can’t drive policy decisions. There was still some uncertainty around whether a shift down to 50bp in December or a pause in early 2023 would actually constitute a pivot as the policy rate will approach the Fed’s and market’s own projections in the months ahead, while officials have continued to push data-dependence and the lagged impact of this year’s policy decisions.
Earnings season continued to ramp up this week. Some of the key themes included ongoing pressure from elevated labor and freight costs and supply chain constraints, macro headwinds and weaker consumer demand, and a weakening online ad backdrop. On the positive side, BAC +10.3% and GS +8.4% both offered stronger results, though a number of regional banks offered a mixed picture. This week also saw pricing strength and consumer resilience, better tech hardware and semi performance than expected, and some positive streaming updates. While there has been some fear that downward earnings revisions could be one of the next catalysts to move the market lower, that has been in part offset by estimates that may prove stickier givin lingering pricing power and strong consumer and corporate balance sheets. In addition, an eventual earnings reset may be cushioned by the outsized multiple contraction that has already been responsible for all of the 2022 drawdown.
Fixed Income
The 10-year treasury yield closed at 4.21% that’s the highest since June 2008. This pushed the US Agg down again bringing the YTD return to a negative 16.74%.
Yield Curve
September FOMC Statement July Fed Minutes Balance Sheet Reduction Plan Credit, Liquidity and Balance Sheet Federal Reserve Dot Plots Treasury.gov yields FOMC Policy Normalization Statement Longer- Run Goals Jan 2022
Foreign Exchange Market
Energy Complex
The Baker Hughes rig count increased by 2 this week. There are 771 oil and gas rigs operating in the US- Up 229 over last year.
Metals Complex
Employment Picture
Weekly Unemployment Claims – Released Thursday 10/6/2022 – The week ending October 15th observed a decrease of 12k in initial claims decreasing to 214k. The four week moving average of initial jobless claims increased 1.25k to 212.25k.
September Jobs Report – BLS Summary – Released 10/7/2022 – The US Economy added 263k nonfarm jobs in September and the Unemployment rate stayed decreased to 3.5%. Average hourly earnings increased 10 to $32.46. Hiring highlights include +90k Education and Health Services, +83k Leisure and Hospitality, and +46k Professional and Business Services.
Job Openings & Labor Turnover Survey – JOLTS – Released 10/4/2022 – The US Bureau of Labor Statistics reported the number and rate of job openings decreased to 10.2 million on the last business day of August. Over the month, hires were little changed at 6.3 million and separations were little changed at 6 million. Within separations, quits were little changed at 4.2 million. The layoffs and discharges rates were little changed at 1.5 million.
Employment Cost Index – Released 7/29/2022 – Compensation costs for civilian workers increased 1.3% for the 3-month period ending in June 2022. The 12-month period ending in June 2022 saw compensation costs increase by 5.1%. The 12-month period ending in June 2021 increased 2.9%. Wages and salaries increased 5.3% over the year and increased 3.2% for the 12-month period ending in June 2021. Benefit costs increased 4.8% over the year and increased 2.2% for the 12-month period ending in June 2021. This report is published quarterly.
This Week’s Economic Data
Links take you to the data source
Existing Home Sales – Released 10/20/2022 – Existing home sales decreased in September marking eight consecutive months of declines. Sales declined 1.5% to a seasonally adjusted rate of 4.71 million in September. Sales decreased 23.8% year/year. Housing inventory sits at 1.25 million units. Down 2.3% from August’s inventory and down 0.8% over last year. Unsold inventory sits at a 3.2 month supply. The median existing home price for all housing types was $384,800 which is up 8.4% from August 2021. This marks 127 consecutive months of year/year increases, the longest running streak on record.
Housing Starts –Released 10/19/2022 – New home starts in September were at a seasonally adjusted annual rate of 1.439 million; down 8.1% below August, and 7.7% below last September’s rate. Building Permits were at a seasonally adjusted annual rate of 1.564 million, up 1.4% compared to August, but down 3.2% over last year.
Industrial Production and Capacity Utilization – Released 10/18/2022 – In September, Industrial production increased 0.4%, manufacturing increased increased 0.4%, utilities output decreased 0.3%, mining output increased 0.6%, total industrial production was 5.3% higher in September than a year ago, total capacity utilization increased 0.2% in September to 80.3% which is 0.7% above its long run average.
Recent Economic Data
Links take you to the data source
Retail Sales – Released 10/14/2022 – US retail sales for September were roughly the same at $684 billion and retail sales are 8.2% above September 2021. US retail sales for the July 2022 through September 2022 period were up 9.2% from the same period a year ago.
Consumer Price Index – Released 10/13/2022 – Consumer prices increased 0.4% m/m in September following a 0.1% increase in August. Consumer prices are up 8.2% for the 12-month period ending in September. Core consumer prices increased 0.6% m/m in September.
Producer Price Index – Released 10/12/2022 – The producer price index for final demand increased 0.4% in September. PPI less food and energy was flat. The change in PPI for final demand has increased 8.5% year/y.
Consumer Credit – Released 10/7/2022 – Consumer credit increased at a seasonally adjusted annual rate of 8.3% in August 2022. Revolving credit increased at an annual rate of 18.1%, while nonrevolving credit increased at an annual rate of 5.1%.
US Light Vehicle Sales – Released 10/7/2022 – US light vehicle sales were at a seasonally adjusted annual rate of 13.492 million units in September.
U.S. Trade Balance – Released 10/5/2022 – According to the US Census Bureau of Economic Analysis, the goods and services deficit decreased in August by $3.2 billion to $67.4 billion. August exports were $258.9 billion, $0.7 billion less than July exports. August imports were 4326.3 billion, $3.7 billion less than July imports. Year to date, the goods and services deficit increased $132.3 billion, or 24.4%, from the same period in 2021. Exports increased $329.8 billion or 19.9%. Imports increased $462.1 billion or 21%.
PMI Non-Manufacturing Index – Released 10/5/2022 – Economic activity in the non-manufacturing sector grew in September for the 28th consecutive month. ISM Non-Manufacturing registered 56.7%, which is 0.2 percentage points below the August reading of 56.9%.
PMI Manufacturing Index – Released 10/3/2022 – September PMI declined 1.9% registering 50.9%. The New Orders Index fell into contractionary territory at 47.1% down 4.2%. The Production Index registered 50.6%, up 0.2%.
U.S. Construction Spending – Released 10/3/2022 – Construction spending decreased 0.7% in August measuring at a seasonally adjusted annual rate of $1,781.3 billion. The August figure is 8.5% above the August 2021 estimate. Private construction spending declined 0.6% from the revised July estimate at $1,426 billion. Public construction spending was 0.8% below the revised July estimate at $355.3 billion.
Chicago PMI – Released 9/30/2022 – Chicago PMI declined sharply in September from 52.2 to 45.7.
Personal Income – Released 9/30/2022 – Personal income increased $71.6 billion or 0.3% in August according to estimate released today by the Bureau of Economic Analysis. Disposable Personal Income (DPI) increased $67.6 billion or 0.4% and Personal Consumption Expenditures (PCE) increased $67.5 billion or 0.4%.
Third Estimate of 2nd Quarter 2022 GDP – Released 9/29/2022 – Real gross domestic product decreased at an annual rate of 0.6% in the second quarter of 2022, according to the third estimate released by the Bureau of Economic Analysis. GDP decreased 1.6% in the first quarter of 2022. Two quarters of negative GDP growth marks a technical recession. The GDP estimate released today is based on source data that are more complete than that of the second estimate which saw real GDP decline 0.6% and the advance estimate and which saw real GDP decline 0.9% in the second quarter of 2022. The decrease in real GDP reflected decreased in private inventory investment, residential fixed investment, federal government spending, state and local government spending, and nonresidential fixed investment that were partly offset by increased in exports and personal consumption expenditures. Imports, which are a subtraction in the calculation of GDP, increased. The update primarily reflected an upward revision to consumer spending that was offset by a downward revision to exports. Imports, which are a subtraction in the calculation of GDP, were revised down.
Consumer Confidence – Released 9/27/2022 – The consumer confidence index increased in September following an increase in August. The index now stands at 108, up from 103.6 in August.
Consumer Confidence – Released 9/27/2022 – New orders for manufactured durable goods in August decreased $0.6 billion or 0.2% to $272.7 billion. Transportation equipment led the decreased down $1 billion or 1.1% to $92 billion.
New Residential Sales – Released 9/27/2022 – Sales of new single-family homes increased 28.8% to 685k, seasonally adjusted, in August. The median sales price of new homes sold in August was $436,800 with an average sales price of $521,800. At the end of August, the seasonally adjusted estimate of new homes for sale was 461k. This represents a supply of 8.1 months at the current sales rate.
Next week we get data on New Residential Sales, Durable Goods, Consumer Confidence, the Advance Estimate of 3rd Quarter 2022 GDP, and Personal Income.
Data Sources:
Bureau of Economic Analysis (BEA)
Congressional Budget Office (CBO)
U.S. Bureau of Labor Statistics (BLS)
Federal Reserve Economic Data (FRED Charts)
CME Fed Watch
U.S. Treasury – Yields
U.S. Census Bureau
Institute for Supply Management (ISM)
Weekly DOL Employment Data
BLS Monthly Jobs Report
JOLTS
US Energy Admin (EIA)
BLS Consumer Price Index CPI
BLS Producer Price Index PPI
Atlanta Fed GDPNOW
NY Fed Nowcast GDP
US Census Bureau Housing Starts
Consumer Credit
USCB Retail Sales
Construction Spending
Federal Reserve Dot Plots
NY Empire Index
Philadelphia Federal Reserve
P/E Ratio Data -Yardeni Research
Technical Analysis Info:
StockCharts.com – Financial Charts
Exponential vs Simple moving average
Other Links:
1973 Arab Oil Embargo
Hunt Brothers Silver
Long-Term Capital bailout
Categories:
Tags: