Weekly Market Update | Week 38
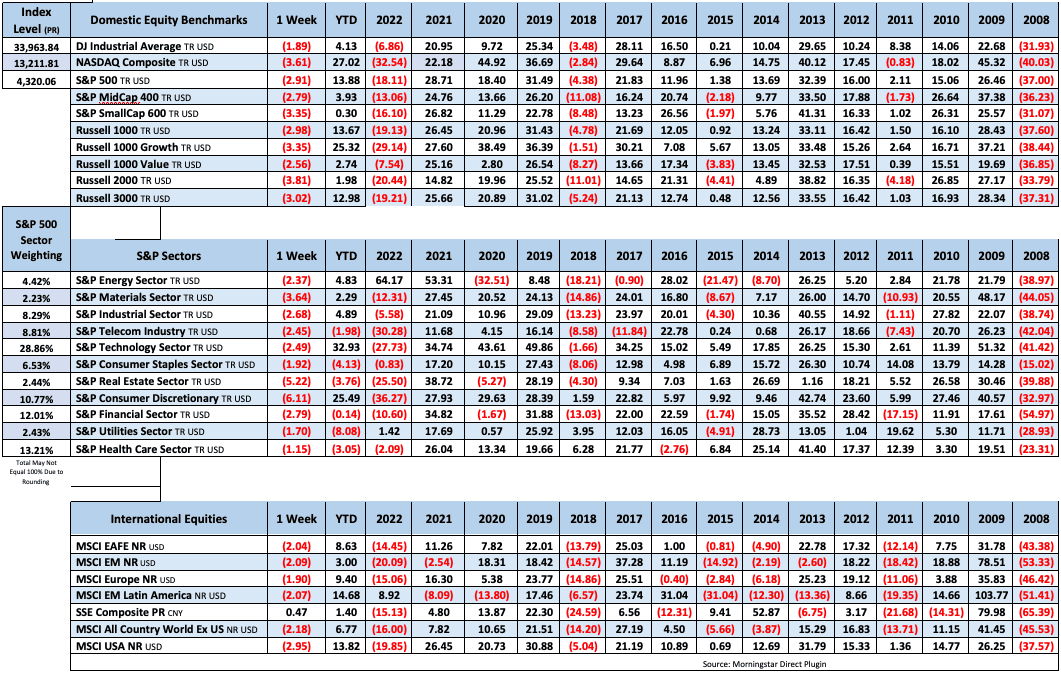
All 11 sectors were lower this week with consumer discretionary and utilities faring the worst. The S&P moved back below its 100-day moving average for the first time since March and retested June lows just above 4300. Megacaps were largely a drag, with notable declines from TSLA (10.8%), AMZN (8.0%), and GOOGL (5.2%). Autos/suppliers, airlines, credit cards, banks, semis, and REITs were among the other laggards. Managed care, P&C insurers, steel, and healthcare distributors were some areas of relative strength.
Treasuries were weaker across the curve. On Thursday the 2Y yield hit its highest mark since 2006; the 10Y briefly crossed above 4.50% (its highest level since 2007). The dollar was better on the major crosses, particularly vs sterling. Gold finished the week fractionally lower. WTI crude dropped 0.8% after a streak of three consecutive weekly gains, but still settled above $90/barrel.
It was a broad risk-off week, with Friday’s attempt at an oversold bounce not gaining much traction. The major event was the September FOMC meeting, for which takeaways generally leaned hawkish. The Fed kept rates steady as expected but also issued a new edition of the dot plot which maintained forecasts for another 2023 hike and reduced the median forecast for 2024 easing to 50bp (from 100bp in June). For his part, Chair Powell’s comments were consistent with the higher-for-longer mantra, though he stressed (multiple times) that the Fed would proceed carefully.
There was also some economic data of interest. Housing data was somewhat downbeat, with August housing starts logging their slowest growth in three years, August existing-home sales coming in light, and September’s NAHB homebuilder sentiment tying for the lowest mark since April. September’s Philadelphia Fed manufacturing index saw its 14th negative reading of the past 16 months. The release for September’s preliminary US Markit PMIs noted broad stagnation in activity across the private sector (as well as a sharp increase in input prices). And while weekly initial and continuing jobless claims came in at their lowest levels since January, the readings were also consistent with a still-tight labor market.
There was a lot of attention on the ongoing UAW strike, particularly around Friday’s expansion of the strike to new GM and Stellantis facilities (the strike did not extend at Ford plants, with the union pointing to more constructive negotiations). At the same time, there were reports that the Hollywood writers’ strike could be nearing a resolution. There was also a lot of headline volatility around a possible government shutdown after 30-Sep, though at this point a shutdown is largely expected with infighting within the House GOP serving as a major obstacle to progress (while analysts also expect minimal meaningful damage from a shutdown).
All in all, the bearish narrative was gaining momentum this week with focus on higher rates, a somewhat hawkish Fed, and dampened megacap+ momentum. Analysts also discussed margin risks amid rising energy prices, rising equity outflows, uncertain strike/shutdown impacts, downside risks from systematic strategies, and negative seasonality (the back half of September has been one of the toughest periods of the year for the S&P). But at the same time, many of the pillars of the bullish argument remain intact, with the market this week considering oversold conditions, Peak Fed, solid M&A/IPO headlines, some constructive developments around ongoing strikes, ongoing consumer resilience, and additional China policy support.
Next week the economic calendar includes September consumer confidence and August new-home sales; August durable-goods orders; August pending-home sales; and August PCE.
Fixed Income

Yield Curve
July FOMC Statement July Fed Minutes Balance Sheet Reduction Plan Credit, Liquidity and Balance Sheet Federal Reserve Dot Plots
Treasury.gov yields FOMC Policy Normalization Statement Longer- Run Goals Jan 2022
Foreign Exchange Market
Energy Complex
The Baker Hughes rig count was down 11 this week. There are 630 oil and gas rigs operating in the US – Down 134 from last year.
Metals Complex
Employment Picture
Weekly Unemployment Claims – Released Thursday 9/21/2023 –In the week ending September 16, the advance figure for seasonally adjusted initial claims was 201,000 decreasing 20,000 from the previous week’s revised level. The 4-week moving average was 217,000 a decrease of 7,750 from the previous week’s revised average.
August Jobs Report – BLS Summary – Released 9/1/2023 – The US Economy added 187k nonfarm jobs in August and the Unemployment rate edged up to 3.8%. Average hourly earnings increased 8 cents to $33.82. Hiring highlights include +102k Education and Health Services, +40k Leisure and Hospitality, and +22k Construction.
- Average hourly earnings increased 8 cents/0.2% to $33.82.
- U3 unemployment rate increased 0.3% to 3.8%. U6 unemployment rate increased 0.4% to 7.1%.
- The labor force participation rate increased by 0.2% to 62.8%.
- Average work week increased 0.1 hours to 34.4 hours.
Job Openings & Labor Turnover Survey JOLTS – Released 8/29/2023 – The number of job openings decreased to 8.8 million on the last business day of July, the U.S. Bureau of Labor Statistics reported. Over the month the number of hires and total separations were little changed at 5.8 million and 5.5 million, respectively. Within separations, quits (3.5 million) decreased and discharges (1.6 million) changed little.
Employment Cost Index – Released 7/28/2023 – Compensation costs for civilian workers increased 1.0% for the 3-month period ending in June 2023. The 12-month period ending in June 2023 saw compensation costs increase by 4.5. The 12-month period ending June 2022 increased 5.1%. Wages and salaries increased 4.6 percent over the 12-month June 2023 and increased 5.3 percent for the 12-month period ending in June 2022. Benefit costs increased 4.2 percent over the 12-month period ending June 2023 and increased 4.8 percent for the 12-month period ending in June 2022. This report is published quarterly.
This Week’s Economic Data
Links take you to the data source
Existing Home Sales Released 9/21/2023 – August 2023 brought 4.04 million in sales, a decrease of 0.7% from July. The median sales price was $407,100. The current unsold housing inventory was 3.3 months of inventory.
Housing Starts– Released 9/19/2023 – August housing starts came in at 1,283,000, 11.3% below the July estimate and 14.8% below the August 2022 rate. Building permits were 6.9% above the July rate at $1,543,000 and 2.7% below the August 2022 rate.
Recent Economic Data
Links take you to the data source
Industrial Production and Capacity Utilization Released 9/15/2023 – Industrial production increased 0.4% in August. Utilities output increased 0.9%. Manufacturing increased 0.1%. Mining increased 1.4%. Capacity utilization increased to 79.7% in August, in line with its long-run average.
Retail Sales– Released 9/14/2023 – Headline retail sales increased 0.6% in August and are up 2.5% above August 2022.
Producer Price Index – Released 9/14/2023 – The Producer Price Index for final demand increased 0.7 percent in August, seasonally adjusted. Final demand increased 0.4 percent in July. On an unadjusted basis, the index for final demand moved up 1.6 percent for the 12 months ended in August.
Consumer Price Index – Released 9/13/2023 – The Consumer Price Index for All Urban Consumers rose 0.6 percent in August on a seasonally adjusted basis, after increasing 0.2 percent in July. Over the last 12 months, the all items index increased 3.7 percent before seasonal adjustment.
Consumer Credit – Released 9/8/2023 – Consumer credit increased at a seasonally adjusted annual rate of 2.5 percent in July. Revolving credit increased at an annual rate of 9.2 percent, while nonrevolving credit increased at an annual rate of 0.2 percent.
U.S. Trade Balance – Released 9/6/2023 – The U.S. Census Bureau and the U.S. Bureau of Economic Analysis announced that the goods and services deficit was $65.0 billion in July, up $1.3 billion from $63.7 billion in June. June exports were $251.7 billion, $3.9 billion more than June exports. July imports were $316.7 billion, $5.2 billion more than June imports. The July increase in the goods and services deficit reflected an increase in the goods deficit of $2.0 billion to $90.0 billion and an increase in the services surplus of $0.7 billion to $25.0 billion.
PMI Non-Manufacturing Index – Released 9/5/2023 – Economic activity in the services sector expanded in August for the eighth consecutive month as the Services PMI® registered 54.5 percent, 1.8 percentage point higher than July’s reading of 52.7 percent.
U.S. Construction Spending– Released 9/1/2023 – Construction spending during July 2023 was estimated at a seasonally adjusted annual rate of $1,972.6 billion, 0.7 percent above the revised June estimate of $1,958.9 billion. The July figure is 5.5 percent above the July 2022 estimate of $1,869.3 billion.
PMI Manufacturing Index – Released 9/1/2023 – The August Manufacturing PMI registered 47.6 percent, 1.2 percentage points higher than the 46.4 percent recorded in July. Regarding the overall economy, this figure indicates a ninth month of contraction after a 30-month period of expansion. The New Orders Index remained in contraction territory at 46.8 percent, 0.5 percentage points lower than the figure of 47.3 percent recorded in July. The Production Index reading of 50.0 percent is a 1.7-percentage point increase compared to July’s figure of 48.3 percent.
US Light Vehicle Sales– Released 8/31/2023 – U.S. light vehicle sales were at a seasonally adjusted annual rate (SAAR) of 15.732 million units in August.
Chicago PMI – Released 8/31/2023 – Chicago PMI remained in contraction territory in August increasing to 48.7 points up from 42.8 points in August. This increase surpassed expectations but still marks twelve months in contractionary territory.
Personal Income – Released 8/31/2023 – Personal income increased $45.0 billion (0.2 percent at a monthly rate) in July. Disposable personal income (DPI) increased $7.3 billion (0.1 percent). Personal consumption expenditures (PCE) increased $144.6 billion (0.8 percent).
Second Estimate of 2nd Quarter 2023 GDP – Released 8/30/2023 – Real gross domestic product (GDP) increased at an annual rate of 2.1 percent in the second quarter of 2023, according to the “second” estimate released by the Bureau of Economic Analysis. The GDP estimate released today is based on more complete source data than were available for the “advance” estimate issued last month which had GDP increasing at 2.4 percent. In the first quarter, real GDP increased 2.0 percent. The increase in real GDP reflected increases in consumer spending, nonresidential fixed investment, state and local government spending, private inventory investment, and federal government spending that were partly offset by decreases in exports and residential fixed investment. Imports, which are a subtraction in the calculation of GDP, decreased.The updated estimates primarily reflected downward revisions to private inventory investment and nonresidential fixed investment that were partly offset by an upward revision to state and local government spending.
Consumer Confidence– Released 8/29/2023 – Consumer Confidence decreased in August to 106.1, down from 114.0 in July. August’s decline reflected dips in both the current conditions and expectations indexes. Consumers were once again preoccupied with rising prices in general, and for groceries and gasoline in particular.
Durable Goods Released 8/24/2023 – New orders for manufactured durable goods in July, down following four consecutive months of increases, decreased $15.5 billion or 5.2 percent to $285.9 billion, the U.S. Census Bureau announced today. This followed a 4.4 percent June increase. Excluding transportation, new orders increased 0.5 percent. Excluding defense, new orders decreased 5.4 percent. Transportation equipment, also down following four consecutive months of increases, drove the decrease, $16.4 billion or 14.3 percent to $98.7 billion.
New Residential Sales Released 8/23/2023 – Sales of new single‐family houses in July 2023 were at a seasonally adjusted annual rate of 714,000, according to estimates released jointly by the U.S. Census Bureau and the Department of Housing and Urban Development. This is 4.4 percent above the revised June rate of 684,000 and is 31.5 percent above the July 2022 estimate of 543,000. The median sales price of new houses sold in July 2023 was $436,700. The average sales price was $513,000. At the end of July, the seasonally adjusted estimate of new homes for sale was 437,000, a supply of 7.3 months at the current sales rate.
Next week we get data on New Residential Sales, Durable Goods, Consumer Confidence, 3rd Estimate of 2nd Quarter GDP, Personal Income, and Chicago PMI.
Data Sources:
Bureau of Economic Analysis (BEA)
Congressional Budget Office (CBO)
U.S. Bureau of Labor Statistics (BLS)
Federal Reserve Economic Data (FRED Charts)
CME Fed Watch
U.S. Treasury – Yields
U.S. Census Bureau
Institute for Supply Management (ISM)
Weekly DOL Employment Data
BLS Monthly Jobs Report
JOLTS
US Energy Admin (EIA)
BLS Consumer Price Index CPI
BLS Producer Price Index PPI
Atlanta Fed GDPNOW
NY Fed Nowcast GDP
US Census Bureau Housing Starts
Consumer Credit
USCB Retail Sales
Construction Spending
Federal Reserve Dot Plots
NY Empire Index
Philadelphia Federal Reserve
P/E Ratio Data -Yardeni Research
Technical Analysis Info:
StockCharts.com – Financial Charts
Exponential vs Simple moving average
Koyfin.com
Other Links:
1973 Arab Oil Embargo
Hunt Brothers Silver
Long-Term Capital bailout
Asian Contagion


Weekly Market Update | Week 38
All 11 sectors were lower this week with consumer discretionary and utilities faring the worst. The S&P moved back below its 100-day moving average for the first time since March and retested June lows just above 4300. Megacaps were largely a drag, with notable declines from TSLA (10.8%), AMZN (8.0%), and GOOGL (5.2%). Autos/suppliers, airlines, credit cards, banks, semis, and REITs were among the other laggards. Managed care, P&C insurers, steel, and healthcare distributors were some areas of relative strength.
Treasuries were weaker across the curve. On Thursday the 2Y yield hit its highest mark since 2006; the 10Y briefly crossed above 4.50% (its highest level since 2007). The dollar was better on the major crosses, particularly vs sterling. Gold finished the week fractionally lower. WTI crude dropped 0.8% after a streak of three consecutive weekly gains, but still settled above $90/barrel.
It was a broad risk-off week, with Friday’s attempt at an oversold bounce not gaining much traction. The major event was the September FOMC meeting, for which takeaways generally leaned hawkish. The Fed kept rates steady as expected but also issued a new edition of the dot plot which maintained forecasts for another 2023 hike and reduced the median forecast for 2024 easing to 50bp (from 100bp in June). For his part, Chair Powell’s comments were consistent with the higher-for-longer mantra, though he stressed (multiple times) that the Fed would proceed carefully.
There was also some economic data of interest. Housing data was somewhat downbeat, with August housing starts logging their slowest growth in three years, August existing-home sales coming in light, and September’s NAHB homebuilder sentiment tying for the lowest mark since April. September’s Philadelphia Fed manufacturing index saw its 14th negative reading of the past 16 months. The release for September’s preliminary US Markit PMIs noted broad stagnation in activity across the private sector (as well as a sharp increase in input prices). And while weekly initial and continuing jobless claims came in at their lowest levels since January, the readings were also consistent with a still-tight labor market.
There was a lot of attention on the ongoing UAW strike, particularly around Friday’s expansion of the strike to new GM and Stellantis facilities (the strike did not extend at Ford plants, with the union pointing to more constructive negotiations). At the same time, there were reports that the Hollywood writers’ strike could be nearing a resolution. There was also a lot of headline volatility around a possible government shutdown after 30-Sep, though at this point a shutdown is largely expected with infighting within the House GOP serving as a major obstacle to progress (while analysts also expect minimal meaningful damage from a shutdown).
All in all, the bearish narrative was gaining momentum this week with focus on higher rates, a somewhat hawkish Fed, and dampened megacap+ momentum. Analysts also discussed margin risks amid rising energy prices, rising equity outflows, uncertain strike/shutdown impacts, downside risks from systematic strategies, and negative seasonality (the back half of September has been one of the toughest periods of the year for the S&P). But at the same time, many of the pillars of the bullish argument remain intact, with the market this week considering oversold conditions, Peak Fed, solid M&A/IPO headlines, some constructive developments around ongoing strikes, ongoing consumer resilience, and additional China policy support.
Next week the economic calendar includes September consumer confidence and August new-home sales; August durable-goods orders; August pending-home sales; and August PCE.
Fixed Income
Yield Curve
July FOMC Statement July Fed Minutes Balance Sheet Reduction Plan Credit, Liquidity and Balance Sheet Federal Reserve Dot Plots
Treasury.gov yields FOMC Policy Normalization Statement Longer- Run Goals Jan 2022
Foreign Exchange Market
Energy Complex
The Baker Hughes rig count was down 11 this week. There are 630 oil and gas rigs operating in the US – Down 134 from last year.
Metals Complex
Employment Picture
Weekly Unemployment Claims – Released Thursday 9/21/2023 –In the week ending September 16, the advance figure for seasonally adjusted initial claims was 201,000 decreasing 20,000 from the previous week’s revised level. The 4-week moving average was 217,000 a decrease of 7,750 from the previous week’s revised average.
August Jobs Report – BLS Summary – Released 9/1/2023 – The US Economy added 187k nonfarm jobs in August and the Unemployment rate edged up to 3.8%. Average hourly earnings increased 8 cents to $33.82. Hiring highlights include +102k Education and Health Services, +40k Leisure and Hospitality, and +22k Construction.
Job Openings & Labor Turnover Survey JOLTS – Released 8/29/2023 – The number of job openings decreased to 8.8 million on the last business day of July, the U.S. Bureau of Labor Statistics reported. Over the month the number of hires and total separations were little changed at 5.8 million and 5.5 million, respectively. Within separations, quits (3.5 million) decreased and discharges (1.6 million) changed little.
Employment Cost Index – Released 7/28/2023 – Compensation costs for civilian workers increased 1.0% for the 3-month period ending in June 2023. The 12-month period ending in June 2023 saw compensation costs increase by 4.5. The 12-month period ending June 2022 increased 5.1%. Wages and salaries increased 4.6 percent over the 12-month June 2023 and increased 5.3 percent for the 12-month period ending in June 2022. Benefit costs increased 4.2 percent over the 12-month period ending June 2023 and increased 4.8 percent for the 12-month period ending in June 2022. This report is published quarterly.
This Week’s Economic Data
Links take you to the data source
Existing Home Sales Released 9/21/2023 – August 2023 brought 4.04 million in sales, a decrease of 0.7% from July. The median sales price was $407,100. The current unsold housing inventory was 3.3 months of inventory.
Housing Starts– Released 9/19/2023 – August housing starts came in at 1,283,000, 11.3% below the July estimate and 14.8% below the August 2022 rate. Building permits were 6.9% above the July rate at $1,543,000 and 2.7% below the August 2022 rate.
Recent Economic Data
Links take you to the data source
Industrial Production and Capacity Utilization Released 9/15/2023 – Industrial production increased 0.4% in August. Utilities output increased 0.9%. Manufacturing increased 0.1%. Mining increased 1.4%. Capacity utilization increased to 79.7% in August, in line with its long-run average.
Retail Sales– Released 9/14/2023 – Headline retail sales increased 0.6% in August and are up 2.5% above August 2022.
Producer Price Index – Released 9/14/2023 – The Producer Price Index for final demand increased 0.7 percent in August, seasonally adjusted. Final demand increased 0.4 percent in July. On an unadjusted basis, the index for final demand moved up 1.6 percent for the 12 months ended in August.
Consumer Price Index – Released 9/13/2023 – The Consumer Price Index for All Urban Consumers rose 0.6 percent in August on a seasonally adjusted basis, after increasing 0.2 percent in July. Over the last 12 months, the all items index increased 3.7 percent before seasonal adjustment.
Consumer Credit – Released 9/8/2023 – Consumer credit increased at a seasonally adjusted annual rate of 2.5 percent in July. Revolving credit increased at an annual rate of 9.2 percent, while nonrevolving credit increased at an annual rate of 0.2 percent.
U.S. Trade Balance – Released 9/6/2023 – The U.S. Census Bureau and the U.S. Bureau of Economic Analysis announced that the goods and services deficit was $65.0 billion in July, up $1.3 billion from $63.7 billion in June. June exports were $251.7 billion, $3.9 billion more than June exports. July imports were $316.7 billion, $5.2 billion more than June imports. The July increase in the goods and services deficit reflected an increase in the goods deficit of $2.0 billion to $90.0 billion and an increase in the services surplus of $0.7 billion to $25.0 billion.
PMI Non-Manufacturing Index – Released 9/5/2023 – Economic activity in the services sector expanded in August for the eighth consecutive month as the Services PMI® registered 54.5 percent, 1.8 percentage point higher than July’s reading of 52.7 percent.
U.S. Construction Spending– Released 9/1/2023 – Construction spending during July 2023 was estimated at a seasonally adjusted annual rate of $1,972.6 billion, 0.7 percent above the revised June estimate of $1,958.9 billion. The July figure is 5.5 percent above the July 2022 estimate of $1,869.3 billion.
PMI Manufacturing Index – Released 9/1/2023 – The August Manufacturing PMI registered 47.6 percent, 1.2 percentage points higher than the 46.4 percent recorded in July. Regarding the overall economy, this figure indicates a ninth month of contraction after a 30-month period of expansion. The New Orders Index remained in contraction territory at 46.8 percent, 0.5 percentage points lower than the figure of 47.3 percent recorded in July. The Production Index reading of 50.0 percent is a 1.7-percentage point increase compared to July’s figure of 48.3 percent.
US Light Vehicle Sales– Released 8/31/2023 – U.S. light vehicle sales were at a seasonally adjusted annual rate (SAAR) of 15.732 million units in August.
Chicago PMI – Released 8/31/2023 – Chicago PMI remained in contraction territory in August increasing to 48.7 points up from 42.8 points in August. This increase surpassed expectations but still marks twelve months in contractionary territory.
Personal Income – Released 8/31/2023 – Personal income increased $45.0 billion (0.2 percent at a monthly rate) in July. Disposable personal income (DPI) increased $7.3 billion (0.1 percent). Personal consumption expenditures (PCE) increased $144.6 billion (0.8 percent).
Second Estimate of 2nd Quarter 2023 GDP – Released 8/30/2023 – Real gross domestic product (GDP) increased at an annual rate of 2.1 percent in the second quarter of 2023, according to the “second” estimate released by the Bureau of Economic Analysis. The GDP estimate released today is based on more complete source data than were available for the “advance” estimate issued last month which had GDP increasing at 2.4 percent. In the first quarter, real GDP increased 2.0 percent. The increase in real GDP reflected increases in consumer spending, nonresidential fixed investment, state and local government spending, private inventory investment, and federal government spending that were partly offset by decreases in exports and residential fixed investment. Imports, which are a subtraction in the calculation of GDP, decreased.The updated estimates primarily reflected downward revisions to private inventory investment and nonresidential fixed investment that were partly offset by an upward revision to state and local government spending.
Consumer Confidence– Released 8/29/2023 – Consumer Confidence decreased in August to 106.1, down from 114.0 in July. August’s decline reflected dips in both the current conditions and expectations indexes. Consumers were once again preoccupied with rising prices in general, and for groceries and gasoline in particular.
Durable Goods Released 8/24/2023 – New orders for manufactured durable goods in July, down following four consecutive months of increases, decreased $15.5 billion or 5.2 percent to $285.9 billion, the U.S. Census Bureau announced today. This followed a 4.4 percent June increase. Excluding transportation, new orders increased 0.5 percent. Excluding defense, new orders decreased 5.4 percent. Transportation equipment, also down following four consecutive months of increases, drove the decrease, $16.4 billion or 14.3 percent to $98.7 billion.
New Residential Sales Released 8/23/2023 – Sales of new single‐family houses in July 2023 were at a seasonally adjusted annual rate of 714,000, according to estimates released jointly by the U.S. Census Bureau and the Department of Housing and Urban Development. This is 4.4 percent above the revised June rate of 684,000 and is 31.5 percent above the July 2022 estimate of 543,000. The median sales price of new houses sold in July 2023 was $436,700. The average sales price was $513,000. At the end of July, the seasonally adjusted estimate of new homes for sale was 437,000, a supply of 7.3 months at the current sales rate.
Next week we get data on New Residential Sales, Durable Goods, Consumer Confidence, 3rd Estimate of 2nd Quarter GDP, Personal Income, and Chicago PMI.
Data Sources:
Bureau of Economic Analysis (BEA)
Congressional Budget Office (CBO)
U.S. Bureau of Labor Statistics (BLS)
Federal Reserve Economic Data (FRED Charts)
CME Fed Watch
U.S. Treasury – Yields
U.S. Census Bureau
Institute for Supply Management (ISM)
Weekly DOL Employment Data
BLS Monthly Jobs Report
JOLTS
US Energy Admin (EIA)
BLS Consumer Price Index CPI
BLS Producer Price Index PPI
Atlanta Fed GDPNOW
NY Fed Nowcast GDP
US Census Bureau Housing Starts
Consumer Credit
USCB Retail Sales
Construction Spending
Federal Reserve Dot Plots
NY Empire Index
Philadelphia Federal Reserve
P/E Ratio Data -Yardeni Research
Technical Analysis Info:
StockCharts.com – Financial Charts
Exponential vs Simple moving average
Koyfin.com
Other Links:
1973 Arab Oil Embargo
Hunt Brothers Silver
Long-Term Capital bailout
Asian Contagion
Categories:
Tags: