Modest Job Growth Shows Economy Expanding, but Slowly
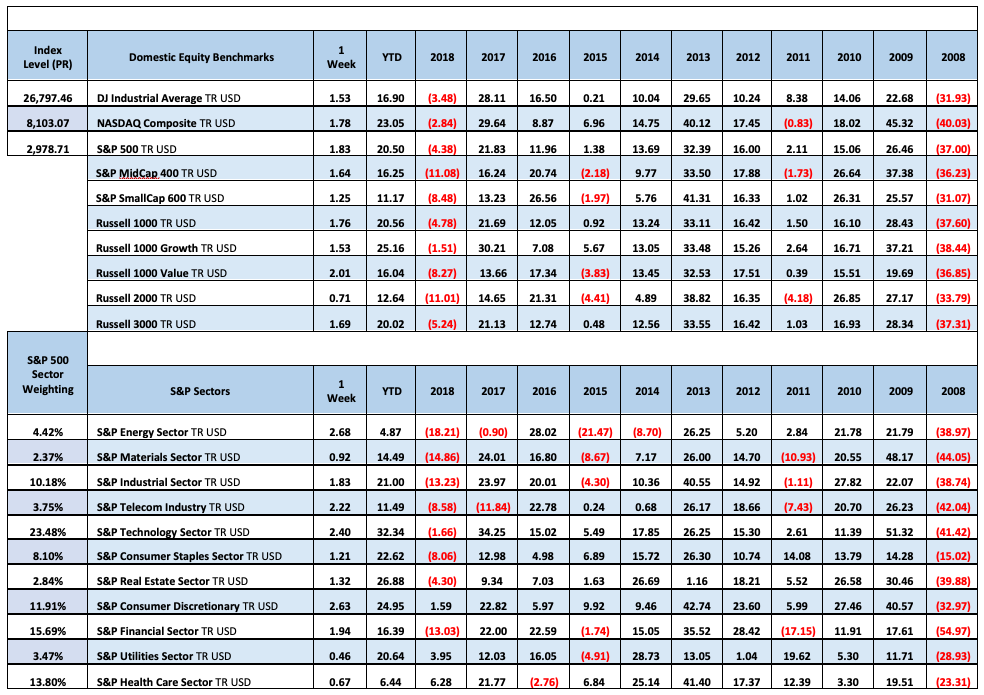
Equites rallied for the second straight week, supported by developments in trade and politics and mildly encouraging economic data. The S&P 500 and Nasdaq both rose 1.8%, the Dow gained 1.5% The R2k was higher by 0.7% but trailed its large-cap peers.
U.S. Treasuries finished lower this week, pushing yields slightly higher. The 2-yr yield increased two basis points to 1.52%, and the 10-yr yield increased four basis points to 1.55%.
The August employment report shows U.S. hiring activity slowing down to a more modest pace as nonfarm payrolls increased by 130,000. Job growth has averaged 158,000 per month so far this year, versus the average monthly gain of 223,000 in 2018. Average hourly earnings, meanwhile, were up 3.2% yr/yr in August. Total construction spending increased 0.1% m/m in July. The ISM Manufacturing Index for August registered 49.1% following a 51.2% reading for July. The dividing line between expansion and contraction is 50.0%. This is the first below 50% reading in three years. The headline number looks porr but it gets even worse; the new orders Index dropped to 47.2% from 50.8% and the new export orders Index decreased to 43.3% from 48.1%, which is the lowest reading since April 2009. The U.S. trade deficit was $54.0 billion in July, down $1.5 billion from $55.5 billion in June. The ISM Non-ManufacturingIndex for August registered 56.4%, up from 53.7% in July which indicates non-manufacturing activity expanded and accelerated versus the pace of activity in July.

Fixed Income
FOMC July Statement Federal Reserve Dot Plots Dec 18 US Debt Measurement– US Corporate Debt Tops $6 Trillion. Treasury.gov yields FOMC Policy Normalization Statement
Global Bond Yields – Next Fed meeting September 17-18.
Daily US Treasury Yields
Foreign Exchange Market
The British Pound had a wild week, on Monday the GBP hit a three year low under 1.20 to the USD. The UK’s new PM Boris Johnson is not getting of to a good start. He has already lost two key votes, even his own brother gave him a vote of no-confidence. Brexit is coming apart at the seams and it feels more and more likely there will be another country wide re-vote on the matter. Wiki Brexit
Energy Complex
The Baker Hughes rig count was lost 6 this week. There are 898 oil and gas rigs operating in the US – Down 150 over last year.
-
- Brent Crude Oil gained 3.86% this week closing at $61.54/bbl
- WTI Crude Oil gained 2.58% this week to close at $56.52/bbl
- Heating Oil gained 3.43% this week closing at $1.90/gallon
- Natural Gas gained 9.23% this week closing at $2.50 per million BTUs
- Unleaded Gas gained 2.91% this week closing at $1.57/gallon
Metals Complex
Gold broke out of a six year trading range in Late July and has been climbing.
- Gold lost 0.91% this week closing at $1515.50/oz
- Silver lost 1.22% on the week closing at $18.12/oz
- Palladium gained 0.36% this week closing at $1544.70/oz
- Platinum gained 2.88% this week closing at $958.50oz
- Copper gained 3.23% this week closing at $2.63/lb
Employment Picture
August Jobs Report – BLS Summary Released 9/6- The US Economy added 130k nonfarm jobs in August and the Unemployment remained constant at 3.7%. Average hourly earnings increased by 11 cents. Hiring highlights include Education and Health Services +32k, Professional and Business Services +37k, Government +34k, and -11k Retail Trade.
- Average hourly earnings increased by 11 cents/ 0.4% in August, y/y hourly earnings are up 3.2%.
- U3 unemployment remained unchanged at 3.7%. U6 unemployment rate increased 0.2% to 7.2%.
- The labor force participation rate increased in August at 63.2% (Unchanged year/y).
- Average work week increased by 0.1 hour to 34.4 hours.
Weekly Unemployment Claims – Released Thursday 9/5– In the week ending August 31th, initial claims were 217,000, an increase of 1,000 from the previous week’s revised level. The 4-week moving average was 216,250, a increase of 1,500 from the previous week’s revised average.
Job Openings & Labor Turnover Survey JOLTS – Released Tuesday 8/6 – The U.S. Bureau of Labor Statistics reported the number of job openings was little changed at 7.3 million on the last business day of June. Over the month, hires were little changed at 5.7 million and separations were little changed at 5.5 million. Within separations, the quits rate remained unchanged at 2.3%. The layoffs and discharges rates was little changed at 1.1%.
Employment Cost Index – Released 7/31/19 – Compensation costs for civilian workers increased 0.6% for the 3-month period ending in June 2019. The 12 month period ending on June 2019 saw compensation costs increase by 2.7% versus 2.8% in June 2018. Wages and salaries were up 2.8% for the 12-month period ending June 2019, versus 2.8% for the 12-month period ending June 2018. Benefit costs increased 2.3% for the 12-month period ending June 2019. For private industry workers, compensation costs increased 2.6% year-over-year, versus 2.9% for the 12 months ending June 2018. This report is published quarterly.
This Week’s Economic Data
Links take you to the data source
PMI Non-Manufacturing Index (ISM Services) – Released 9/5 – Economic activity in the non-manufacturing sector grew in August for the 115th consecutive month. ISM Non-Manufacturing registered 56.4 percent, which is 2.7 percentage points higher than the July reading of 53.7 percent. This represents continued growth in the non-manufacturing sector, at a slightly faster rate.
U.S. Trade Balance – Released 9/4 – . The goods and services deficit has increased $28.2 billion or 8.2% year to date. Year to date exports and imports increased $3.4 billion or 0.2% and $24.9 billion or 1.4% respectively.
US Light Vehicle Sales– Released 9/4 – U.S. light vehicle sales were at a seasonally adjusted annual rate (SAAR) of 17.07 million units in August versus a SAAR of 16.82 million units in July.
PMI Manufacturing ISM Index – Released 9/3 – August PMI decreased 2.1% to 49.1% from July’s reading of 51.2%. The New Orders Index was down 3.6% from July’s reading of 50.8% to 47.2% for August. The Production Index registered 49.5% down 1.3%.
U.S. Construction Spending– Released 9/3 – Construction spending increased by 0.1% in July measuring at a seasonally adjusted annual rate of $1,288.8 billion. The July figure is 2.7% below the July 2018 estimate. Private construction spending was 0.1% below the revised June estimate at $963.7 billion. Public construction spending was 0.4% above the revised June estimate at $324.3 billion.
Recent Economic Data
Links take you to the data source
Chicago PMI – Released 8/30 – Chicago PMI gained 6 points in August rising to 50.4, up from 44.4 in July. This increase shows the index rising above contractionary territory where it was for the prior two months. Only two components declined this month as Supplier Deliveries sharply declined and inventories declined. The survey suggests a softer overall tone in business activity despite the overall gain.
Personal Income – Released 8/30 – Personal Income increased 0.1% in July according to the BEA. The majority of the increase in July was due to increases in compensation of employees and government social benefits which were partially offset by a decline in personal interest income. Real PCE (the Feds preferred inflation gauge) increased 0.4% in July. Real disposable personal income increased 0.1% in July.
Advance Estimate of 2nd Quarter GDP – Released 8/29 – According to the second estimate released by the Bureau of Economic Analysis, Real Gross Domestic Product (Real GDP) increased at an annual rate of 2.0% in the second quarter of 2019. This is 0.1% less than the 2.1% given from the advance estimate. The second estimate is based on data that are more complete than that of the advance estimate issued last month. The second quarter increase in real GDP observed positive contributions from personal consumption expenditures (PCE), federal gov’t spending, and state and local gov’t spending that were partly offset by negative contributions from private inventory investment, exports, nonresidential fixed investment, and residential fixed investment. Imports also increased further offsetting gains to real GDP. A third estimate will be released on September 26, 2019.
Consumer Confidence – Released 8/27 – The Consumer confidence index declined slightly in August following a rebound in July. The Index now shows a reading of 135.1 down from 135.8 in July. Expectations overall still remain strong and consumers remain confident and willing to spend.
Durable Goods – Released 8/26 – New orders for manufactured durable goods increased $5.0 billion or 2.1% to $250.4 billion in July. The increase in July makes two consecutive months of increases. Transportation equipment increased 7.0%, driving the increase by $5.7 billion to $86.3 billion.
New Residential Sales – Released 8/23 – Sales of new single-family homes declined 12.8% to 635k, seasonally adjusted, in July. The median sales price of new homes sold in July was $312.8k with an average sales price of $388k. At the end of July the seasonally adjusted estimate of new homes for sale was 337k. This represents a supply of 6.4 months at the current sales rate.
Existing Home Sales – Released 8/21 – Existing home sales increased on July. Sales gained 2.5% to a seasonally adjusted rate of 5.42 million. A reversal from last month’s decline. Sales are currently up 0.6% from one year ago. Housing inventory declined to 4.2 months of inventory and the total housing inventory decreased to 1.89 million. The median sales price for all types of homes was $280,800, up 4.3% year/y.
Housing Starts – Released 8/16 – New home starts in July were at a seasonally adjusted rate of 1.191 million; down 4.0% below June and 0.6% above last July’s rate. Building Permits were at a seasonally adjusted rate of 1.336 million, up 8.4% compared to June and up 1.5% over last year.
Industrial Production and Capacity Utilization Released 8/15 – Industrial production declined 0.2% in July. Manufacturing output fell 0.4% and mining output declined 1.8%. The index for utilities gained 3.1%. Total capacity utilization decreased 0.3% to 77.5% in July which is 2.3% below its long run average.
Retail Sales – Released 8/15 – U.S. retail sales for July were up 0.7% month/m increasing to $523.5 billion.
Consumer Price Index – Released 8/13 – The Consumer Price Index increased 0.3% in July. Core CPI, which excludes food and energy increased 0.3%. The monthly changes left total CPI up 1.8% year-over-year and core CPI up 2.2%.
Producer Price Index – Released 8/9 – The Producer Price Index for final demand increased 0.2% in July. Core PPI was up 0.1%. Year over year the index for final demand rose 1.7%.
Consumer Credit – Released 8/7 – Consumer credit increased at a seasonally adjusted annual rate of 5.00% in the second quarter. Revolving and nonrevolving credit increased at annual rates of 5.25% and 4.75% respectively. Total Outstanding consumer credit is currently at $4.102 trillion.
Next week we get data on PPI, CPI, Retail Sales, Industrial Production and Capacity Utilization
Data Sources:
Bureau of Economic Analysis (BEA)
Congressional Budget Office (CBO)
U.S. Bureau of Labor Statistics (BLS)
Federal Reserve Economic Data (FRED Charts)
CME Fed Watch
U.S. Treasury – Yields
U.S. Census Bureau
Institute for Supply Management (ISM)
Weekly DOL Employment Data
BLS Monthly Jobs Report
JOLTS
US Energy Admin (EIA)
BLS Consumer Price Index CPI
BLS Producer Price Index PPI
Atlanta Fed GDPNOW
NY Fed Nowcast GDP
US Census Bureau Housing Starts
Consumer Credit
USCB Retail Sales
Construction Spending
Federal Reserve Dot Plots
NY Empire Index
Philadelphia Federal Reserve
P/E Ratio Data -Yardeni Research
Technical Analysis Info:
StockCharts.com – Financial Charts
Exponential vs Simple moving average
Other Links:
1973 Arab Oil Embargo
Hunt Brothers Silver
Long-Term Capital bailout


Week 36 Talking Points #25
Modest Job Growth Shows Economy Expanding, but Slowly
Equites rallied for the second straight week, supported by developments in trade and politics and mildly encouraging economic data. The S&P 500 and Nasdaq both rose 1.8%, the Dow gained 1.5% The R2k was higher by 0.7% but trailed its large-cap peers.
U.S. Treasuries finished lower this week, pushing yields slightly higher. The 2-yr yield increased two basis points to 1.52%, and the 10-yr yield increased four basis points to 1.55%.
The August employment report shows U.S. hiring activity slowing down to a more modest pace as nonfarm payrolls increased by 130,000. Job growth has averaged 158,000 per month so far this year, versus the average monthly gain of 223,000 in 2018. Average hourly earnings, meanwhile, were up 3.2% yr/yr in August. Total construction spending increased 0.1% m/m in July. The ISM Manufacturing Index for August registered 49.1% following a 51.2% reading for July. The dividing line between expansion and contraction is 50.0%. This is the first below 50% reading in three years. The headline number looks porr but it gets even worse; the new orders Index dropped to 47.2% from 50.8% and the new export orders Index decreased to 43.3% from 48.1%, which is the lowest reading since April 2009. The U.S. trade deficit was $54.0 billion in July, down $1.5 billion from $55.5 billion in June. The ISM Non-ManufacturingIndex for August registered 56.4%, up from 53.7% in July which indicates non-manufacturing activity expanded and accelerated versus the pace of activity in July.
Table of Contents
Fixed Income
FOMC July Statement Federal Reserve Dot Plots Dec 18 US Debt Measurement– US Corporate Debt Tops $6 Trillion. Treasury.gov yields FOMC Policy Normalization Statement
Global Bond Yields – Next Fed meeting September 17-18.
Daily US Treasury Yields
Foreign Exchange Market
The British Pound had a wild week, on Monday the GBP hit a three year low under 1.20 to the USD. The UK’s new PM Boris Johnson is not getting of to a good start. He has already lost two key votes, even his own brother gave him a vote of no-confidence. Brexit is coming apart at the seams and it feels more and more likely there will be another country wide re-vote on the matter. Wiki Brexit
Energy Complex
The Baker Hughes rig count was lost 6 this week. There are 898 oil and gas rigs operating in the US – Down 150 over last year.
Metals Complex
Gold broke out of a six year trading range in Late July and has been climbing.
Employment Picture
August Jobs Report – BLS Summary Released 9/6- The US Economy added 130k nonfarm jobs in August and the Unemployment remained constant at 3.7%. Average hourly earnings increased by 11 cents. Hiring highlights include Education and Health Services +32k, Professional and Business Services +37k, Government +34k, and -11k Retail Trade.
Weekly Unemployment Claims – Released Thursday 9/5– In the week ending August 31th, initial claims were 217,000, an increase of 1,000 from the previous week’s revised level. The 4-week moving average was 216,250, a increase of 1,500 from the previous week’s revised average.
Job Openings & Labor Turnover Survey JOLTS – Released Tuesday 8/6 – The U.S. Bureau of Labor Statistics reported the number of job openings was little changed at 7.3 million on the last business day of June. Over the month, hires were little changed at 5.7 million and separations were little changed at 5.5 million. Within separations, the quits rate remained unchanged at 2.3%. The layoffs and discharges rates was little changed at 1.1%.
Employment Cost Index – Released 7/31/19 – Compensation costs for civilian workers increased 0.6% for the 3-month period ending in June 2019. The 12 month period ending on June 2019 saw compensation costs increase by 2.7% versus 2.8% in June 2018. Wages and salaries were up 2.8% for the 12-month period ending June 2019, versus 2.8% for the 12-month period ending June 2018. Benefit costs increased 2.3% for the 12-month period ending June 2019. For private industry workers, compensation costs increased 2.6% year-over-year, versus 2.9% for the 12 months ending June 2018. This report is published quarterly.
This Week’s Economic Data
Links take you to the data source
PMI Non-Manufacturing Index (ISM Services) – Released 9/5 – Economic activity in the non-manufacturing sector grew in August for the 115th consecutive month. ISM Non-Manufacturing registered 56.4 percent, which is 2.7 percentage points higher than the July reading of 53.7 percent. This represents continued growth in the non-manufacturing sector, at a slightly faster rate.
U.S. Trade Balance – Released 9/4 – . The goods and services deficit has increased $28.2 billion or 8.2% year to date. Year to date exports and imports increased $3.4 billion or 0.2% and $24.9 billion or 1.4% respectively.
US Light Vehicle Sales– Released 9/4 – U.S. light vehicle sales were at a seasonally adjusted annual rate (SAAR) of 17.07 million units in August versus a SAAR of 16.82 million units in July.
PMI Manufacturing ISM Index – Released 9/3 – August PMI decreased 2.1% to 49.1% from July’s reading of 51.2%. The New Orders Index was down 3.6% from July’s reading of 50.8% to 47.2% for August. The Production Index registered 49.5% down 1.3%.
U.S. Construction Spending– Released 9/3 – Construction spending increased by 0.1% in July measuring at a seasonally adjusted annual rate of $1,288.8 billion. The July figure is 2.7% below the July 2018 estimate. Private construction spending was 0.1% below the revised June estimate at $963.7 billion. Public construction spending was 0.4% above the revised June estimate at $324.3 billion.
Recent Economic Data
Links take you to the data source
Chicago PMI – Released 8/30 – Chicago PMI gained 6 points in August rising to 50.4, up from 44.4 in July. This increase shows the index rising above contractionary territory where it was for the prior two months. Only two components declined this month as Supplier Deliveries sharply declined and inventories declined. The survey suggests a softer overall tone in business activity despite the overall gain.
Personal Income – Released 8/30 – Personal Income increased 0.1% in July according to the BEA. The majority of the increase in July was due to increases in compensation of employees and government social benefits which were partially offset by a decline in personal interest income. Real PCE (the Feds preferred inflation gauge) increased 0.4% in July. Real disposable personal income increased 0.1% in July.
Advance Estimate of 2nd Quarter GDP – Released 8/29 – According to the second estimate released by the Bureau of Economic Analysis, Real Gross Domestic Product (Real GDP) increased at an annual rate of 2.0% in the second quarter of 2019. This is 0.1% less than the 2.1% given from the advance estimate. The second estimate is based on data that are more complete than that of the advance estimate issued last month. The second quarter increase in real GDP observed positive contributions from personal consumption expenditures (PCE), federal gov’t spending, and state and local gov’t spending that were partly offset by negative contributions from private inventory investment, exports, nonresidential fixed investment, and residential fixed investment. Imports also increased further offsetting gains to real GDP. A third estimate will be released on September 26, 2019.
Consumer Confidence – Released 8/27 – The Consumer confidence index declined slightly in August following a rebound in July. The Index now shows a reading of 135.1 down from 135.8 in July. Expectations overall still remain strong and consumers remain confident and willing to spend.
Durable Goods – Released 8/26 – New orders for manufactured durable goods increased $5.0 billion or 2.1% to $250.4 billion in July. The increase in July makes two consecutive months of increases. Transportation equipment increased 7.0%, driving the increase by $5.7 billion to $86.3 billion.
New Residential Sales – Released 8/23 – Sales of new single-family homes declined 12.8% to 635k, seasonally adjusted, in July. The median sales price of new homes sold in July was $312.8k with an average sales price of $388k. At the end of July the seasonally adjusted estimate of new homes for sale was 337k. This represents a supply of 6.4 months at the current sales rate.
Existing Home Sales – Released 8/21 – Existing home sales increased on July. Sales gained 2.5% to a seasonally adjusted rate of 5.42 million. A reversal from last month’s decline. Sales are currently up 0.6% from one year ago. Housing inventory declined to 4.2 months of inventory and the total housing inventory decreased to 1.89 million. The median sales price for all types of homes was $280,800, up 4.3% year/y.
Housing Starts – Released 8/16 – New home starts in July were at a seasonally adjusted rate of 1.191 million; down 4.0% below June and 0.6% above last July’s rate. Building Permits were at a seasonally adjusted rate of 1.336 million, up 8.4% compared to June and up 1.5% over last year.
Industrial Production and Capacity Utilization Released 8/15 – Industrial production declined 0.2% in July. Manufacturing output fell 0.4% and mining output declined 1.8%. The index for utilities gained 3.1%. Total capacity utilization decreased 0.3% to 77.5% in July which is 2.3% below its long run average.
Retail Sales – Released 8/15 – U.S. retail sales for July were up 0.7% month/m increasing to $523.5 billion.
Consumer Price Index – Released 8/13 – The Consumer Price Index increased 0.3% in July. Core CPI, which excludes food and energy increased 0.3%. The monthly changes left total CPI up 1.8% year-over-year and core CPI up 2.2%.
Producer Price Index – Released 8/9 – The Producer Price Index for final demand increased 0.2% in July. Core PPI was up 0.1%. Year over year the index for final demand rose 1.7%.
Consumer Credit – Released 8/7 – Consumer credit increased at a seasonally adjusted annual rate of 5.00% in the second quarter. Revolving and nonrevolving credit increased at annual rates of 5.25% and 4.75% respectively. Total Outstanding consumer credit is currently at $4.102 trillion.
Next week we get data on PPI, CPI, Retail Sales, Industrial Production and Capacity Utilization
Data Sources:
Bureau of Economic Analysis (BEA)
Congressional Budget Office (CBO)
U.S. Bureau of Labor Statistics (BLS)
Federal Reserve Economic Data (FRED Charts)
CME Fed Watch
U.S. Treasury – Yields
U.S. Census Bureau
Institute for Supply Management (ISM)
Weekly DOL Employment Data
BLS Monthly Jobs Report
JOLTS
US Energy Admin (EIA)
BLS Consumer Price Index CPI
BLS Producer Price Index PPI
Atlanta Fed GDPNOW
NY Fed Nowcast GDP
US Census Bureau Housing Starts
Consumer Credit
USCB Retail Sales
Construction Spending
Federal Reserve Dot Plots
NY Empire Index
Philadelphia Federal Reserve
P/E Ratio Data -Yardeni Research
Technical Analysis Info:
StockCharts.com – Financial Charts
Exponential vs Simple moving average
Other Links:
1973 Arab Oil Embargo
Hunt Brothers Silver
Long-Term Capital bailout
Categories:
Tags: