Good Life Advisors – Talking Points – Week 34
As the probability of a Fed Pivot fades, so does Sentiment
The old adage goes “don’t fight the Fed” – well the markets are certainly adhering to that. The equity and fixed income rally off the June lows was aided by hopes of the Fed slowing and possibly reversing its pace of rate increases. Chairman Powell told us last Friday that they will “keep at it until the Job is done”. SInce his speech in Jackson Hole last week, the markets have been down five out of six days, with the S&P falling more than 6% and the US bond aggregate falling over 4%.
The monthly job report was still strong this month coming in at 315k for August. There was a slight uptick in unemployment rising to 3.7% from 3.5%. The JOLTS survey earlier in the week showed job openings actually increased, although this was for July. Wage growth has been steady the last two months.
Labor force participation rate ticked up to its highest level post covid coming in at 62.4. There has been a big shift in the 55+ as Un-retirement rates have picked up.

On the real estate front, Redfin says in August the average home sold for just under the listing price. The first time this has happened since March of last year, while mortgage applications were down 23% year over year in August.
Nowhere to hide this week as the hawkish Fed continues to weigh on equities.
Fixed Income
The US bond agg continues its longest drawdown, now into its 25th month.
Yield Curve
July Fed Minutes Balance Sheet Reduction Plan Credit, Liquidity and Balance Sheet Federal Reserve Dot Plots
US Corporate Debt Tops 7 Trillion. Treasury.gov yields FOMC Policy Normalization Statement Longer- Run Goals Jan 2022
Foreign Exchange Market
As the US dollar surges, American buyers splurge on European homes – So says the WSJ
Energy Complex
The Baker Hughes rig count decreased by 5 this week. There are 760 oil and gas rigs operating in the US – UP 263 over last year.
Metals Complex
Employment Picture
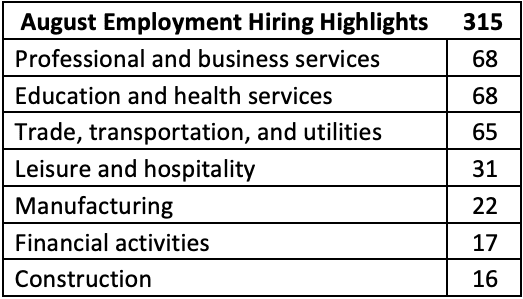
July Jobs Report – BLS Summary – Released 9/2/2022 – The US Economy added 315k nonfarm jobs in August and the Unemployment rate stayed increased to 3.7%. Average hourly earnings increased 10 to $32.36. Hiring highlights include +68k Education and Health Services, +68k Professional and Business Services, and +44k Retail Trade.
- Average hourly earnings increased 10 cents to $32.36.
- U3 unemployment rate remained increased 0.2% to 3.7%. U6 unemployment rate increased 0.3% to 7%.
- The labor force participation rate was increased 0.3% to 62.4%.
- Average work week decreased 0.1 to 34.5 hours.
Weekly Unemployment Claims – Released Thursday 9/1/2022 – The week ending August 27th observed a decrease of 5k in initial claims decreasing to 232k. The four-week moving average of initial jobless claims decreased 4k to 241.5k.
Job Openings & Labor Turnover Survey – JOLTS – Released 8/30/2022 – The US Bureau of Labor Statistics reported the number and rate of job openings was little changed at 11.2 million on the last business day of July. Over the month, hires were little changed at 6.4 million and separations were little changed at 5.9 million. Within separations, quits were little changed at 4.2 million. The layoffs and discharges rates were little changed at 1.4 million.
Employment Cost Index – Released 7/29/2022 – Compensation costs for civilian workers increased 1.3% for the 3-month period ending in June 2022. The 12-month period ending in June 2022 saw compensation costs increase by 5.1%. The 12-month period ending June 2021 increased 2.9%. Wages and salaries increased 5.3% over the year and increased 3.2% for the 12-month period ending in June 2021. Benefit costs increased 4.8% over the year and increased 2.2% for the 12-month period ending in June 2021. This report is published quarterly.
This Week’s Economic Data
Links take you to the data source
PMI Manufacturing Index – Released 9/1/2022 – August PMI was unchanged at 52.8%. The New Orders Index was 51.3% up 3.3% from July’s reading of 48%. The Production Index registered 50.4%, down 3.1%.
U.S. Construction Spending – Released 9/1/2022 – Construction spending decreased 0.4% in July, measuring at a seasonally adjusted annual rate of $1,777.3 billion. The July figure is 8.5% above the July 2021 estimate. Private construction spending declined 0.8% from the revised June estimate at $1,436.4 billion. Public construction spending was 1.5% above the revised June estimate at $353.1 billion.
Chicago PMI – Released 8/31/2022 – Chicago PMI was relatively unchanged in August at 52.20.
Consumer Confidence – Released 8/30/2022 – The consumer confidence index increased in August following three consecutive months of decline. The index now stands at 103.2, up from 95.3 in July.
Recent Economic Data
Links take you to the data source
US Light Vehicle Sales – Released 8/26/2022 – US light vehicle sales were at a seasonally adjusted annual rate of 13.333 million units in July.
Personal Income – Released 8/26/2022 – Personal income increased $47 billion or 0.2% in July according to estimates released by the Bureau of Economic Analysis. Disposable personal income (DPI) increased $37.6 billion or 0.2% and personal consumption expenditures (PCE) increased $23.7 billion or 0.1%.
Second Estimate of 2nd Quarter 2022 GDP Released 8/25/2022 – Real gross domestic product (GDP) decreased at an annual rate of 0.6% in the second quarter of 2022, according to the second estimate released by the Bureau of Economic Analysis. GDP decreased 1.6% in the first quarter of 2022. Two quarters on negative GDP growth marks a technical recession. The GDP estimate released is based on source data that are more complete than that of the advance estimate which saw real GDP decline 0.9% in the second quarter of 2022. The decrease in real GDP reflected decreases in private inventory investment, residential fixed investment, federal government spending, state and local government spending, and nonresidential fixed investment that were partly offset by increases in exports and personal consumption expenditures (PCE). Imports, which are a subtraction in the calculation of GDP, increased. The update primarily reflects upward revisions to consumer spending and private inventory investment that were partly offset by a downward revision to residential fixed investment.
Durable Goods Released 8/24/2022 – New orders for manufactured durable goods in July decreased less than $0.1 billion to $273.5 billion. Transportation equipment led the decrease down $0.6 billion or 0.7% to $93 billion.
New Residential Sales Released 8/23/2022 – Sales of new single-family homes decreased 12.6% to 511k, seasonally adjusted, in July. The median sales price of new homes sold in July was $439,400 with an average sales price of $546,800. At the end of July, the seasonally adjusted estimate of new homes for sale was 464k. This represents a supply of 10.9 months at the current sales rate.
Existing Home Sales – Released 8/18/2022 – Existing home sales decreased in July marking six consecutive months of declines. Sales declined 5.9% to a seasonally adjusted rate of 4.81 million in July. Sales decreased 20.2% year-over-year. Housing inventory sits at 1.31 million units, Up 4.8% from June’s inventory and up 2.4% over last year. Unsold inventory sits at a 3.3-month supply. The median existing home price for all housing types was $403,800, which is up 10.8% from July 2021. This marks 125 consecutive months of year-over-year increases, the longest-running streak on record.
Retail Sales – Released 8/17/2022 – US retail sales for July were essentially unchanged at $682.8 billion and retail sales are 10.3% above July 2021. US retail sales for the May 2022 through July 2022 period were up 9.2% from the same period a year ago.
Housing Starts – Released 8/16/2022 – New home starts in July were at a seasonally adjusted annual rate of 1.446 million; down 9.6% below June, and 8.1% below last July’s rate. Building permits were at a seasonally adjusted annual rate of 1.674 million, down 1.3% compared to June, but up 1.1% over last year.
Industrial Production and Capacity Utilization Released 8/16/2022 – In June, industrial production increased 0.6%. Manufacturing increased 0.7%. Utilities output decreased 0.8%. Mining output increased 0.7%. Total industrial production was 3.9% higher in July than a year ago. Total capacity utilization increased to 80.3% in July which is 0.7% above its long run average.
Producer Price Index – Released 8/11/2022 – The producer price index for final demand decreased 0.5% in July. PPI less food and energy increased 0.2%. The change in PPI for final demand has increased 9.8% year/y.
Consumer Price Index – Released 8/10/2022 – Consumer prices were unchanged m/m in July following a 1.3% increase in June. Consumer prices are up 8.5% for the 12-month period ending in July. Core consumer prices increased 0.3% m/m in July.
Consumer Credit – Released 8/5/2022 – Consumer credit increased at a seasonally adjusted annual rate of 8.7% in the second quarter of 2022. Revolving credit increased at an annual rate of 14.6%, while nonrevolving credit increased at an annual rate of 6.9%.
U.S. Trade Balance – Released 8/4/2022 – According to the US Census Bureau of Economic Analysis, the goods and services deficit decreased in June by $5.3 billion to $79.6 billion. June exports were $260.8 billion, $4.3 billion more than May exports. June imports were $340.4 billion, $1 billion less than May imports. Year to date, the goods and services deficit increased $134.1 billion, or 33.4%, from the same period in 2021. Exports increased $246.2 billion or 20%. Imports increased $380.3 billion or 23.3%.
PMI Non-Manufacturing Index – Released 8/3/2022 – Economic activity in the non-manufacturing sector grew in July for the 26th consecutive month. ISM Non-Manufacturing registered 56.7%, which is 1.4 percentage points above the June reading of 55.%.
Next week we get data on Services PMI, US Trade Balance, and Consumer Credit.
Data Sources:
Bureau of Economic Analysis (BEA)
Congressional Budget Office (CBO)
U.S. Bureau of Labor Statistics (BLS)
Federal Reserve Economic Data (FRED Charts)
CME Fed Watch
U.S. Treasury – Yields
U.S. Census Bureau
Institute for Supply Management (ISM)
Weekly DOL Employment Data
BLS Monthly Jobs Report
JOLTS
US Energy Admin (EIA)
BLS Consumer Price Index CPI
BLS Producer Price Index PPI
Atlanta Fed GDPNOW
NY Fed Nowcast GDP
US Census Bureau Housing Starts
Consumer Credit
USCB Retail Sales
Construction Spending
Federal Reserve Dot Plots
NY Empire Index
Philadelphia Federal Reserve
P/E Ratio Data -Yardeni Research
Technical Analysis Info:
StockCharts.com – Financial Charts
Exponential vs Simple moving average
Other Links:
1973 Arab Oil Embargo
Hunt Brothers Silver
Long-Term Capital bailout


Week 34 Talking Points
Table of Contents
Good Life Advisors – Talking Points – Week 34
As the probability of a Fed Pivot fades, so does Sentiment
The old adage goes “don’t fight the Fed” – well the markets are certainly adhering to that. The equity and fixed income rally off the June lows was aided by hopes of the Fed slowing and possibly reversing its pace of rate increases. Chairman Powell told us last Friday that they will “keep at it until the Job is done”. SInce his speech in Jackson Hole last week, the markets have been down five out of six days, with the S&P falling more than 6% and the US bond aggregate falling over 4%.
The monthly job report was still strong this month coming in at 315k for August. There was a slight uptick in unemployment rising to 3.7% from 3.5%. The JOLTS survey earlier in the week showed job openings actually increased, although this was for July. Wage growth has been steady the last two months.
Labor force participation rate ticked up to its highest level post covid coming in at 62.4. There has been a big shift in the 55+ as Un-retirement rates have picked up.
On the real estate front, Redfin says in August the average home sold for just under the listing price. The first time this has happened since March of last year, while mortgage applications were down 23% year over year in August.
Nowhere to hide this week as the hawkish Fed continues to weigh on equities.
Fixed Income
The US bond agg continues its longest drawdown, now into its 25th month.
Yield Curve
July Fed Minutes Balance Sheet Reduction Plan Credit, Liquidity and Balance Sheet Federal Reserve Dot Plots
US Corporate Debt Tops 7 Trillion. Treasury.gov yields FOMC Policy Normalization Statement Longer- Run Goals Jan 2022
Foreign Exchange Market
As the US dollar surges, American buyers splurge on European homes – So says the WSJ
Energy Complex
The Baker Hughes rig count decreased by 5 this week. There are 760 oil and gas rigs operating in the US – UP 263 over last year.
Metals Complex
Employment Picture
July Jobs Report – BLS Summary – Released 9/2/2022 – The US Economy added 315k nonfarm jobs in August and the Unemployment rate stayed increased to 3.7%. Average hourly earnings increased 10 to $32.36. Hiring highlights include +68k Education and Health Services, +68k Professional and Business Services, and +44k Retail Trade.
Weekly Unemployment Claims – Released Thursday 9/1/2022 – The week ending August 27th observed a decrease of 5k in initial claims decreasing to 232k. The four-week moving average of initial jobless claims decreased 4k to 241.5k.
Job Openings & Labor Turnover Survey – JOLTS – Released 8/30/2022 – The US Bureau of Labor Statistics reported the number and rate of job openings was little changed at 11.2 million on the last business day of July. Over the month, hires were little changed at 6.4 million and separations were little changed at 5.9 million. Within separations, quits were little changed at 4.2 million. The layoffs and discharges rates were little changed at 1.4 million.
Employment Cost Index – Released 7/29/2022 – Compensation costs for civilian workers increased 1.3% for the 3-month period ending in June 2022. The 12-month period ending in June 2022 saw compensation costs increase by 5.1%. The 12-month period ending June 2021 increased 2.9%. Wages and salaries increased 5.3% over the year and increased 3.2% for the 12-month period ending in June 2021. Benefit costs increased 4.8% over the year and increased 2.2% for the 12-month period ending in June 2021. This report is published quarterly.
This Week’s Economic Data
Links take you to the data source
PMI Manufacturing Index – Released 9/1/2022 – August PMI was unchanged at 52.8%. The New Orders Index was 51.3% up 3.3% from July’s reading of 48%. The Production Index registered 50.4%, down 3.1%.
U.S. Construction Spending – Released 9/1/2022 – Construction spending decreased 0.4% in July, measuring at a seasonally adjusted annual rate of $1,777.3 billion. The July figure is 8.5% above the July 2021 estimate. Private construction spending declined 0.8% from the revised June estimate at $1,436.4 billion. Public construction spending was 1.5% above the revised June estimate at $353.1 billion.
Chicago PMI – Released 8/31/2022 – Chicago PMI was relatively unchanged in August at 52.20.
Consumer Confidence – Released 8/30/2022 – The consumer confidence index increased in August following three consecutive months of decline. The index now stands at 103.2, up from 95.3 in July.
Recent Economic Data
Links take you to the data source
US Light Vehicle Sales – Released 8/26/2022 – US light vehicle sales were at a seasonally adjusted annual rate of 13.333 million units in July.
Personal Income – Released 8/26/2022 – Personal income increased $47 billion or 0.2% in July according to estimates released by the Bureau of Economic Analysis. Disposable personal income (DPI) increased $37.6 billion or 0.2% and personal consumption expenditures (PCE) increased $23.7 billion or 0.1%.
Second Estimate of 2nd Quarter 2022 GDP Released 8/25/2022 – Real gross domestic product (GDP) decreased at an annual rate of 0.6% in the second quarter of 2022, according to the second estimate released by the Bureau of Economic Analysis. GDP decreased 1.6% in the first quarter of 2022. Two quarters on negative GDP growth marks a technical recession. The GDP estimate released is based on source data that are more complete than that of the advance estimate which saw real GDP decline 0.9% in the second quarter of 2022. The decrease in real GDP reflected decreases in private inventory investment, residential fixed investment, federal government spending, state and local government spending, and nonresidential fixed investment that were partly offset by increases in exports and personal consumption expenditures (PCE). Imports, which are a subtraction in the calculation of GDP, increased. The update primarily reflects upward revisions to consumer spending and private inventory investment that were partly offset by a downward revision to residential fixed investment.
Durable Goods Released 8/24/2022 – New orders for manufactured durable goods in July decreased less than $0.1 billion to $273.5 billion. Transportation equipment led the decrease down $0.6 billion or 0.7% to $93 billion.
New Residential Sales Released 8/23/2022 – Sales of new single-family homes decreased 12.6% to 511k, seasonally adjusted, in July. The median sales price of new homes sold in July was $439,400 with an average sales price of $546,800. At the end of July, the seasonally adjusted estimate of new homes for sale was 464k. This represents a supply of 10.9 months at the current sales rate.
Existing Home Sales – Released 8/18/2022 – Existing home sales decreased in July marking six consecutive months of declines. Sales declined 5.9% to a seasonally adjusted rate of 4.81 million in July. Sales decreased 20.2% year-over-year. Housing inventory sits at 1.31 million units, Up 4.8% from June’s inventory and up 2.4% over last year. Unsold inventory sits at a 3.3-month supply. The median existing home price for all housing types was $403,800, which is up 10.8% from July 2021. This marks 125 consecutive months of year-over-year increases, the longest-running streak on record.
Retail Sales – Released 8/17/2022 – US retail sales for July were essentially unchanged at $682.8 billion and retail sales are 10.3% above July 2021. US retail sales for the May 2022 through July 2022 period were up 9.2% from the same period a year ago.
Housing Starts – Released 8/16/2022 – New home starts in July were at a seasonally adjusted annual rate of 1.446 million; down 9.6% below June, and 8.1% below last July’s rate. Building permits were at a seasonally adjusted annual rate of 1.674 million, down 1.3% compared to June, but up 1.1% over last year.
Industrial Production and Capacity Utilization Released 8/16/2022 – In June, industrial production increased 0.6%. Manufacturing increased 0.7%. Utilities output decreased 0.8%. Mining output increased 0.7%. Total industrial production was 3.9% higher in July than a year ago. Total capacity utilization increased to 80.3% in July which is 0.7% above its long run average.
Producer Price Index – Released 8/11/2022 – The producer price index for final demand decreased 0.5% in July. PPI less food and energy increased 0.2%. The change in PPI for final demand has increased 9.8% year/y.
Consumer Price Index – Released 8/10/2022 – Consumer prices were unchanged m/m in July following a 1.3% increase in June. Consumer prices are up 8.5% for the 12-month period ending in July. Core consumer prices increased 0.3% m/m in July.
Consumer Credit – Released 8/5/2022 – Consumer credit increased at a seasonally adjusted annual rate of 8.7% in the second quarter of 2022. Revolving credit increased at an annual rate of 14.6%, while nonrevolving credit increased at an annual rate of 6.9%.
U.S. Trade Balance – Released 8/4/2022 – According to the US Census Bureau of Economic Analysis, the goods and services deficit decreased in June by $5.3 billion to $79.6 billion. June exports were $260.8 billion, $4.3 billion more than May exports. June imports were $340.4 billion, $1 billion less than May imports. Year to date, the goods and services deficit increased $134.1 billion, or 33.4%, from the same period in 2021. Exports increased $246.2 billion or 20%. Imports increased $380.3 billion or 23.3%.
PMI Non-Manufacturing Index – Released 8/3/2022 – Economic activity in the non-manufacturing sector grew in July for the 26th consecutive month. ISM Non-Manufacturing registered 56.7%, which is 1.4 percentage points above the June reading of 55.%.
Next week we get data on Services PMI, US Trade Balance, and Consumer Credit.
Data Sources:
Bureau of Economic Analysis (BEA)
Congressional Budget Office (CBO)
U.S. Bureau of Labor Statistics (BLS)
Federal Reserve Economic Data (FRED Charts)
CME Fed Watch
U.S. Treasury – Yields
U.S. Census Bureau
Institute for Supply Management (ISM)
Weekly DOL Employment Data
BLS Monthly Jobs Report
JOLTS
US Energy Admin (EIA)
BLS Consumer Price Index CPI
BLS Producer Price Index PPI
Atlanta Fed GDPNOW
NY Fed Nowcast GDP
US Census Bureau Housing Starts
Consumer Credit
USCB Retail Sales
Construction Spending
Federal Reserve Dot Plots
NY Empire Index
Philadelphia Federal Reserve
P/E Ratio Data -Yardeni Research
Technical Analysis Info:
StockCharts.com – Financial Charts
Exponential vs Simple moving average
Other Links:
1973 Arab Oil Embargo
Hunt Brothers Silver
Long-Term Capital bailout
Categories:
Tags: