Good Life Advisors – Talking Points – Week 33
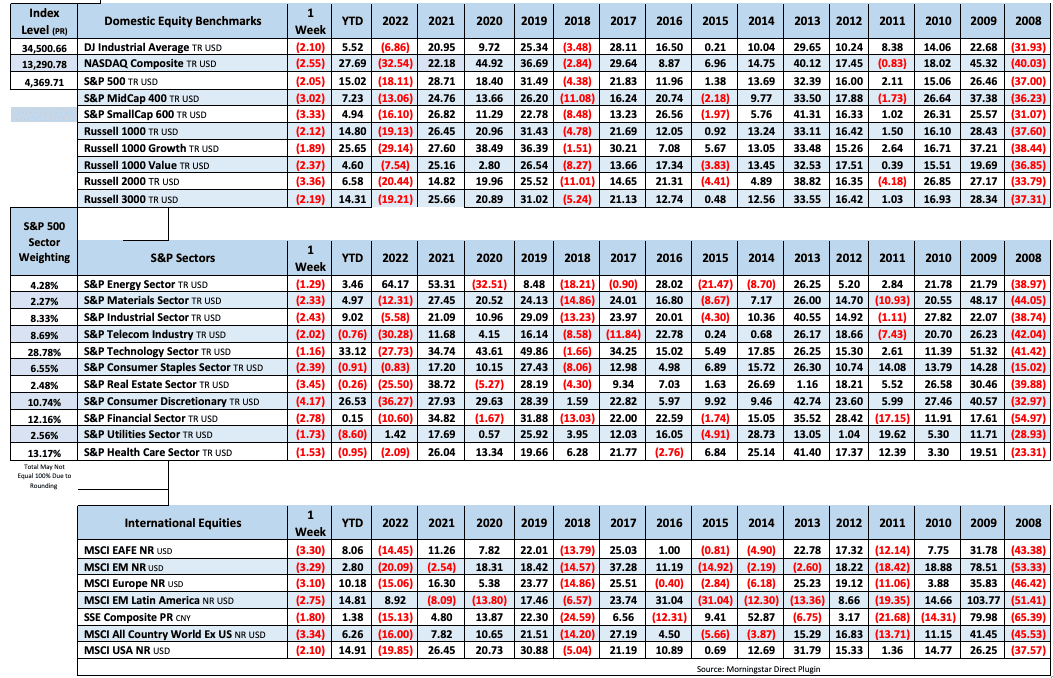
US equities were lower this week, with the S&P 500 and Nasdaq both down for a third-straight week. All sectors were lower for the week though fairly bunched. Big tech was mostly weaker (NVDA +6% the exception), while other underperformers included homebuilders (XHB -4.4%), autos/EVs, entertainment, travel and leisure, banks (BKX -5.6%, KRX -6.3%), credit cards, machinery, road and rails, PBMs, copper and aluminum, precious metals miners, containerboard and packaging. Software, semis (SOX -1.5%), retail (XRT -1.7%), and energy were in line with the broader market. There were few pockets higher, though outperformers included networking and IT equipment, exchanges, pharma, steel, and paper. Treasuries were weaker with the curve steepening. The dollar index was up 0.5%. Gold finished down 1.6%. Bitcoin futures were down over 11%, falling to the lowest level since mid-June. WTI crude was down 2.3%, the first weekly decline in eight weeks.
The big story this week was the ongoing backup in yields, with the 10Y yield hitting 4.33% this week, the highest since 2007, while 10Y TIPS yields hit the highest since 2009. The rise was tabbed in part to stronger economic data and more support for the soft landing narrative after the Citi economic surprise index hit the highest point in more than two years this week. However, resilient economic data also added more support for the higher-for-longer Fed narrative. Markets are pricing in a median year-end fed funds rate of 5.40%, little changed from last week, though pricing for the Jan-25 fed funds rate has risen nearly 40 bp in the past two weeks to nearly 4.20%, suggesting the pace of cuts won’t be as fast as previously predicted. There wasn’t much new from this week’s July FOMC meeting minutes, which contained no hints at future policy actions, though officials warned of significant upside risk to inflation, which could require further tightening of monetary policy.
Overall sentiment continued to slip this week. technical factors were also in focus with the S&P 500, Nasdaq 100, and Russell 2000 all below their 50-DMAs. Other pieces of the bearish narrative include the latest Fitch warnings around US banking industry, UAW contract demands feeding into margin concerns, downside risks to 2024 earnings, and depleted excess savings. US 30Y mortgage rates hit the highest level in 21 years, threatening the housing tailwind, while August NAHB builder confidence fell for the first time in eight months. The latest China headlines remained negative, including Evergrande filing for bankruptcy in New York, and state developers warning of major losses and write-downs.
Any bullish narrative continues to focus on resilient economic growth. The Atlanta Fed’s GDPNow model forecast 5.8% growth for Q3 (though likely to be revised down), while Goldman Sachs economists raised their GDP forecasts by 0.2pp for each of the next three quarters. Analysts noted positioning has normalized in recent weeks, while money market fund assets hit a record high this week. Economic data this week included stronger July retail sales than expected and a surprise positive reading for thePhiladelphia Fed manufacturing index, the first positive print since Aug-22. Despite the builder confidence slip, July housing startsbeat and permits rose by less than expected, though single-family permits up for sixth-straight month . There was also more disinflation support after this week’s NY Fed Survey of Consumer Expectations showed consumer 1Y inflation expectations fell to lowest since Apr-2021.
Next week’s earning calendar includes Nvidia on Wednesday. Data next week include July existing home sales and Richmond Fed index on Tuesday; August flash Markit PMI and July new home sales on Wednesday; July durable goods orders on Thursday; and final Michigan Consumer Sentiment on Friday. Fed Chair Powell is also set to speak on Friday at the Fed’s Jackson Hole symposium.
Fixed Income

Yield Curve
May FOMC Statement March Fed Minutes Balance Sheet Reduction Plan Credit, Liquidity and Balance Sheet Federal Reserve Dot Plots
Treasury.gov yields FOMC Policy Normalization Statement Longer- Run Goals Jan 2022
Foreign Exchange Market
Energy Complex
The Baker Hughes rig count was down 5 this week. There are 654 oil and gas rigs operating in the US – Down 109 from last year.
Metals Complex
Employment Picture
Weekly Unemployment Claims – Released Thursday 8/17/2023 –In the week ending August 12, the advance figure for seasonally adjusted initial claims was 239,000 decreasing 11,000 from the previous week’s revised level. The 4-week moving average was 234,250 an increase of 2,750 from the previous week’s revised average.
July Jobs Report – BLS Summary – Released 8/4/2023 – The US Economy added 187k nonfarm jobs in July and the Unemployment rate was little changed at 3.5%. Average hourly earnings increased 14 cents to $33.74. Hiring highlights include +100k Education and Health Services.
- Average hourly earnings increased 14 cents/0.4% to $33.74.
- U3 unemployment rate was little changed at 3.5%. U6 unemployment rate decreased 0.2% to 6.7%.
- The labor force participation rate was unchanged at 62.6%.
- Average work week decreased 0.1 hours to 34.3 hours.
Job Openings & Labor Turnover Survey JOLTS – Released 8/1/2023 – The number of job openings decreased to 9.6 million on the last business day of June, the U.S. Bureau of Labor Statistics reported. Over the month the number of hires and total separations decreased to 5.9 million and 5.6 million, respectively. Within separations, quits (3.8 million) increased and discharges (1.5 million) changed little.
Employment Cost Index – Released 7/28/2023 – Compensation costs for civilian workers increased 1.0% for the 3-month period ending in June 2023. The 12-month period ending in June 2023 saw compensation costs increase by 4.5. The 12-month period ending June 2022 increased 5.1%. Wages and salaries increased 4.6 percent over the 12-month June 2023 and increased 5.3 percent for the 12-month period ending in June 2022. Benefit costs increased 4.2 percent over the 12-month period ending June 2023 and increased 4.8 percent for the 12-month period ending in June 2022. This report is published quarterly.
This Week’s Economic Data
Links take you to the data source
Housing Starts– Released 8/16/2023 – July housing starts came in at 1,452,000, 3.9% above the June estimate and 5.9% above the July 2022 rate. Building permits were 0.1% above the June rate at $1,441,000 and 13.0% below the July 2022 rate.
Industrial Production and Capacity Utilization Released 8/16/2023 – Industrial production increased 1.0% in July following two months of decline. Utilities output increased 5.4%. Manufacturing increased 0.5%. Mining increased 0.5%. Capacity utilization increased to 79.3% in July, 0.4% below the long-run average.
Retail Sales– Released 8/15/2023 – Headline retail sales increased 0.7% in July and are up 3.2% above July 2022.
Recent Economic Data
Links take you to the data source
Producer Price Index – Released 8/11/2023 – The Producer Price Index for final demand increased 0.3 percent in July, seasonally adjusted. Final demand were unchanged in June and decreased 0.3 in May. On an unadjusted basis, the index for final demand moved up 0.8 percent for the 12 months ended in July.
Consumer Price Index – Released 8/10/2023 – The Consumer Price Index for All Urban Consumers rose 0.2 percent in July on a seasonally adjusted basis, after increasing 0.2 percent in June. Over the last 12 months, the all items index increased 3.2 percent before seasonal adjustment.
U.S. Trade Balance – Released 8/8/2023 – The U.S. Census Bureau and the U.S. Bureau of Economic Analysis announced that the goods and services deficit was $65.5 billion in June, down $2.8 billion from $68.3 billion in May. June exports were $247.5 billion, $0.3 billion less than May exports. June imports were $313.0 billion, $3.1 billion less than May imports. The June decrease in the goods and services deficit reflected a decrease in the goods deficit of $2.8 billion to $88.2 billion and a decrease in the services surplus of less than $0.1 billion to $22.7 billion.
Consumer Credit – Released 8/7/2023 – Consumer credit increased at a seasonally adjusted annual rate of 4 percent in the second quarter. Revolving credit increased at an annual rate of 7.1 percent, while nonrevolving credit increased at an annual rate of 3.0 percent. Consumer credit increased at a seasonally adjusted annual rate of 4.3 percent in June.
PMI Non-Manufacturing Index – Released 8/3/2023 – Economic activity in the services sector expanded in July for the seventh consecutive month as the Services PMI® registered 52.7 percent, 1.2 percentage point lower than June’s reading of 53.9 percent.
U.S. Construction Spending– Released 8/1/2023 – Construction spending during June 2023 was estimated at a seasonally adjusted annual rate of $1,938.4 billion, 0.5 percent above the revised May estimate of $1,929.6 billion. The June figure is 3.5 percent above the June 2022 estimate of $1,873.2 billion.
PMI Manufacturing Index – Released 8/1/2023 – The July Manufacturing PMI registered 46.4 percent, 0.4 percentage points higher than the 46.0 percent recorded in June. Regarding the overall economy, this figure indicates an eighth month of contraction after a 30-month period of expansion. The New Orders Index remained in contraction territory at 47.3 percent, 1.7 percentage points higher than the figure of 45.6 percent recorded in June. The Production Index reading of 48.3 percent is a 1.6-percentage point increase compared to June’s figure of 46.7 percent.
Chicago PMI– Released 7/31/2023 – Chicago PMI remained in contraction territory in July increasing to 42.8 points up from 41.5 points in June. This marks eleven months in contractionary territory.
US Light Vehicle Sales– Released 7/28/2023 – U.S. light vehicle sales were at a seasonally adjusted annual rate (SAAR) of 15.657 million units in June.
Personal Income – Released 7/28/2023 – Personal income increased $69.5 billion (0.3 percent at a monthly rate) in June. Disposable personal income (DPI) increased $67.5 billion (0.3 percent). Personal consumption expenditures (PCE) increased $100.4 billion (0.5 percent).
Advance Estimate of 2nd Quarter 2023 GDP – Released 7/27/2023 – Real gross domestic product (GDP) increased at an annual rate of 2.4 percent in the second quarter of 2023, according to the “advance” estimate released by the Bureau of Economic Analysis. In the first quarter, real GDP increased 2.0 percent. The GDP estimate released today is based on source data that are incomplete or subject to further revision. The increase in real GDP reflected increases in consumer spending, nonresidential fixed investment, state and local government spending, private inventory investment, and federal government spending that were partly offset by decreases in exports and residential fixed investment. Imports, which are a subtraction in the calculation of GDP, decreased.
Durable Goods Released 7/27/2023 – New orders for manufactured durable goods in June, up four consecutive months, increased $13.6 billion or 4.7 percent to $302.5 billion, the U.S. Census Bureau announced today. This followed a 2.0 percent May increase. Excluding transportation, new orders increased 0.6 percent. Excluding defense, new orders increased 6.2 percent. Transportation equipment, also up four consecutive months, drove the increase, $12.4 billion or 12.1 percent to $115.3 billion.
New Residential Sales Released 7/26/2023 – Sales of new single‐family houses in June 2023 were at a seasonally adjusted annual rate of 697,000, according to estimates released jointly by the U.S. Census Bureau and the Department of Housing and Urban Development. This is 2.5 percent below the revised May rate of 715,000 but is 23.8 percent above the June 2022 estimate of 563,000. The median sales price of new houses sold in June 2023 was $415,400. The average sales price was $494,700. At the end of June, the seasonally adjusted estimate of new homes for sale was 432,000, a supply of 7.4 months at the current sales rate.
Consumer Confidence– Released 7/25/2023 – Consumer Confidence increased in July to 117.0, up from 110.1 in June. Consumer confidence improved in July to its highest level since July 2021, reflecting improved current conditions and an improvement in expectations.
Existing Home Sales Released 7/20/2023 – June 2023 brought 4.16 million in sales, a decrease of 3.3% from May. The median sales price was $410,200. The current unsold housing inventory was 3.1 months of inventory.
Next week we get data on Existing Home Sales, New Residential Sales, and Durable Goods.
Data Sources:
Bureau of Economic Analysis (BEA)
Congressional Budget Office (CBO)
U.S. Bureau of Labor Statistics (BLS)
Federal Reserve Economic Data (FRED Charts)
CME Fed Watch
U.S. Treasury – Yields
U.S. Census Bureau
Institute for Supply Management (ISM)
Weekly DOL Employment Data
BLS Monthly Jobs Report
JOLTS
US Energy Admin (EIA)
BLS Consumer Price Index CPI
BLS Producer Price Index PPI
Atlanta Fed GDPNOW
NY Fed Nowcast GDP
US Census Bureau Housing Starts
Consumer Credit
USCB Retail Sales
Construction Spending
Federal Reserve Dot Plots
NY Empire Index
Philadelphia Federal Reserve
P/E Ratio Data -Yardeni Research
Technical Analysis Info:
StockCharts.com – Financial Charts
Exponential vs Simple moving average
Koyfin.com
Other Links:
1973 Arab Oil Embargo
Hunt Brothers Silver
Long-Term Capital bailout
Asian Contagion


Week 33 Talking Points
Table of Contents
Good Life Advisors – Talking Points – Week 33
US equities were lower this week, with the S&P 500 and Nasdaq both down for a third-straight week. All sectors were lower for the week though fairly bunched. Big tech was mostly weaker (NVDA +6% the exception), while other underperformers included homebuilders (XHB -4.4%), autos/EVs, entertainment, travel and leisure, banks (BKX -5.6%, KRX -6.3%), credit cards, machinery, road and rails, PBMs, copper and aluminum, precious metals miners, containerboard and packaging. Software, semis (SOX -1.5%), retail (XRT -1.7%), and energy were in line with the broader market. There were few pockets higher, though outperformers included networking and IT equipment, exchanges, pharma, steel, and paper. Treasuries were weaker with the curve steepening. The dollar index was up 0.5%. Gold finished down 1.6%. Bitcoin futures were down over 11%, falling to the lowest level since mid-June. WTI crude was down 2.3%, the first weekly decline in eight weeks.
The big story this week was the ongoing backup in yields, with the 10Y yield hitting 4.33% this week, the highest since 2007, while 10Y TIPS yields hit the highest since 2009. The rise was tabbed in part to stronger economic data and more support for the soft landing narrative after the Citi economic surprise index hit the highest point in more than two years this week. However, resilient economic data also added more support for the higher-for-longer Fed narrative. Markets are pricing in a median year-end fed funds rate of 5.40%, little changed from last week, though pricing for the Jan-25 fed funds rate has risen nearly 40 bp in the past two weeks to nearly 4.20%, suggesting the pace of cuts won’t be as fast as previously predicted. There wasn’t much new from this week’s July FOMC meeting minutes, which contained no hints at future policy actions, though officials warned of significant upside risk to inflation, which could require further tightening of monetary policy.
Overall sentiment continued to slip this week. technical factors were also in focus with the S&P 500, Nasdaq 100, and Russell 2000 all below their 50-DMAs. Other pieces of the bearish narrative include the latest Fitch warnings around US banking industry, UAW contract demands feeding into margin concerns, downside risks to 2024 earnings, and depleted excess savings. US 30Y mortgage rates hit the highest level in 21 years, threatening the housing tailwind, while August NAHB builder confidence fell for the first time in eight months. The latest China headlines remained negative, including Evergrande filing for bankruptcy in New York, and state developers warning of major losses and write-downs.
Any bullish narrative continues to focus on resilient economic growth. The Atlanta Fed’s GDPNow model forecast 5.8% growth for Q3 (though likely to be revised down), while Goldman Sachs economists raised their GDP forecasts by 0.2pp for each of the next three quarters. Analysts noted positioning has normalized in recent weeks, while money market fund assets hit a record high this week. Economic data this week included stronger July retail sales than expected and a surprise positive reading for thePhiladelphia Fed manufacturing index, the first positive print since Aug-22. Despite the builder confidence slip, July housing startsbeat and permits rose by less than expected, though single-family permits up for sixth-straight month . There was also more disinflation support after this week’s NY Fed Survey of Consumer Expectations showed consumer 1Y inflation expectations fell to lowest since Apr-2021.
Next week’s earning calendar includes Nvidia on Wednesday. Data next week include July existing home sales and Richmond Fed index on Tuesday; August flash Markit PMI and July new home sales on Wednesday; July durable goods orders on Thursday; and final Michigan Consumer Sentiment on Friday. Fed Chair Powell is also set to speak on Friday at the Fed’s Jackson Hole symposium.
Fixed Income
Yield Curve
May FOMC Statement March Fed Minutes Balance Sheet Reduction Plan Credit, Liquidity and Balance Sheet Federal Reserve Dot Plots
Treasury.gov yields FOMC Policy Normalization Statement Longer- Run Goals Jan 2022
Foreign Exchange Market
Energy Complex
The Baker Hughes rig count was down 5 this week. There are 654 oil and gas rigs operating in the US – Down 109 from last year.
Metals Complex
Employment Picture
Weekly Unemployment Claims – Released Thursday 8/17/2023 –In the week ending August 12, the advance figure for seasonally adjusted initial claims was 239,000 decreasing 11,000 from the previous week’s revised level. The 4-week moving average was 234,250 an increase of 2,750 from the previous week’s revised average.
July Jobs Report – BLS Summary – Released 8/4/2023 – The US Economy added 187k nonfarm jobs in July and the Unemployment rate was little changed at 3.5%. Average hourly earnings increased 14 cents to $33.74. Hiring highlights include +100k Education and Health Services.
Job Openings & Labor Turnover Survey JOLTS – Released 8/1/2023 – The number of job openings decreased to 9.6 million on the last business day of June, the U.S. Bureau of Labor Statistics reported. Over the month the number of hires and total separations decreased to 5.9 million and 5.6 million, respectively. Within separations, quits (3.8 million) increased and discharges (1.5 million) changed little.
Employment Cost Index – Released 7/28/2023 – Compensation costs for civilian workers increased 1.0% for the 3-month period ending in June 2023. The 12-month period ending in June 2023 saw compensation costs increase by 4.5. The 12-month period ending June 2022 increased 5.1%. Wages and salaries increased 4.6 percent over the 12-month June 2023 and increased 5.3 percent for the 12-month period ending in June 2022. Benefit costs increased 4.2 percent over the 12-month period ending June 2023 and increased 4.8 percent for the 12-month period ending in June 2022. This report is published quarterly.
This Week’s Economic Data
Links take you to the data source
Housing Starts– Released 8/16/2023 – July housing starts came in at 1,452,000, 3.9% above the June estimate and 5.9% above the July 2022 rate. Building permits were 0.1% above the June rate at $1,441,000 and 13.0% below the July 2022 rate.
Industrial Production and Capacity Utilization Released 8/16/2023 – Industrial production increased 1.0% in July following two months of decline. Utilities output increased 5.4%. Manufacturing increased 0.5%. Mining increased 0.5%. Capacity utilization increased to 79.3% in July, 0.4% below the long-run average.
Retail Sales– Released 8/15/2023 – Headline retail sales increased 0.7% in July and are up 3.2% above July 2022.
Recent Economic Data
Links take you to the data source
Producer Price Index – Released 8/11/2023 – The Producer Price Index for final demand increased 0.3 percent in July, seasonally adjusted. Final demand were unchanged in June and decreased 0.3 in May. On an unadjusted basis, the index for final demand moved up 0.8 percent for the 12 months ended in July.
Consumer Price Index – Released 8/10/2023 – The Consumer Price Index for All Urban Consumers rose 0.2 percent in July on a seasonally adjusted basis, after increasing 0.2 percent in June. Over the last 12 months, the all items index increased 3.2 percent before seasonal adjustment.
U.S. Trade Balance – Released 8/8/2023 – The U.S. Census Bureau and the U.S. Bureau of Economic Analysis announced that the goods and services deficit was $65.5 billion in June, down $2.8 billion from $68.3 billion in May. June exports were $247.5 billion, $0.3 billion less than May exports. June imports were $313.0 billion, $3.1 billion less than May imports. The June decrease in the goods and services deficit reflected a decrease in the goods deficit of $2.8 billion to $88.2 billion and a decrease in the services surplus of less than $0.1 billion to $22.7 billion.
Consumer Credit – Released 8/7/2023 – Consumer credit increased at a seasonally adjusted annual rate of 4 percent in the second quarter. Revolving credit increased at an annual rate of 7.1 percent, while nonrevolving credit increased at an annual rate of 3.0 percent. Consumer credit increased at a seasonally adjusted annual rate of 4.3 percent in June.
PMI Non-Manufacturing Index – Released 8/3/2023 – Economic activity in the services sector expanded in July for the seventh consecutive month as the Services PMI® registered 52.7 percent, 1.2 percentage point lower than June’s reading of 53.9 percent.
U.S. Construction Spending– Released 8/1/2023 – Construction spending during June 2023 was estimated at a seasonally adjusted annual rate of $1,938.4 billion, 0.5 percent above the revised May estimate of $1,929.6 billion. The June figure is 3.5 percent above the June 2022 estimate of $1,873.2 billion.
PMI Manufacturing Index – Released 8/1/2023 – The July Manufacturing PMI registered 46.4 percent, 0.4 percentage points higher than the 46.0 percent recorded in June. Regarding the overall economy, this figure indicates an eighth month of contraction after a 30-month period of expansion. The New Orders Index remained in contraction territory at 47.3 percent, 1.7 percentage points higher than the figure of 45.6 percent recorded in June. The Production Index reading of 48.3 percent is a 1.6-percentage point increase compared to June’s figure of 46.7 percent.
Chicago PMI– Released 7/31/2023 – Chicago PMI remained in contraction territory in July increasing to 42.8 points up from 41.5 points in June. This marks eleven months in contractionary territory.
US Light Vehicle Sales– Released 7/28/2023 – U.S. light vehicle sales were at a seasonally adjusted annual rate (SAAR) of 15.657 million units in June.
Personal Income – Released 7/28/2023 – Personal income increased $69.5 billion (0.3 percent at a monthly rate) in June. Disposable personal income (DPI) increased $67.5 billion (0.3 percent). Personal consumption expenditures (PCE) increased $100.4 billion (0.5 percent).
Advance Estimate of 2nd Quarter 2023 GDP – Released 7/27/2023 – Real gross domestic product (GDP) increased at an annual rate of 2.4 percent in the second quarter of 2023, according to the “advance” estimate released by the Bureau of Economic Analysis. In the first quarter, real GDP increased 2.0 percent. The GDP estimate released today is based on source data that are incomplete or subject to further revision. The increase in real GDP reflected increases in consumer spending, nonresidential fixed investment, state and local government spending, private inventory investment, and federal government spending that were partly offset by decreases in exports and residential fixed investment. Imports, which are a subtraction in the calculation of GDP, decreased.
Durable Goods Released 7/27/2023 – New orders for manufactured durable goods in June, up four consecutive months, increased $13.6 billion or 4.7 percent to $302.5 billion, the U.S. Census Bureau announced today. This followed a 2.0 percent May increase. Excluding transportation, new orders increased 0.6 percent. Excluding defense, new orders increased 6.2 percent. Transportation equipment, also up four consecutive months, drove the increase, $12.4 billion or 12.1 percent to $115.3 billion.
New Residential Sales Released 7/26/2023 – Sales of new single‐family houses in June 2023 were at a seasonally adjusted annual rate of 697,000, according to estimates released jointly by the U.S. Census Bureau and the Department of Housing and Urban Development. This is 2.5 percent below the revised May rate of 715,000 but is 23.8 percent above the June 2022 estimate of 563,000. The median sales price of new houses sold in June 2023 was $415,400. The average sales price was $494,700. At the end of June, the seasonally adjusted estimate of new homes for sale was 432,000, a supply of 7.4 months at the current sales rate.
Consumer Confidence– Released 7/25/2023 – Consumer Confidence increased in July to 117.0, up from 110.1 in June. Consumer confidence improved in July to its highest level since July 2021, reflecting improved current conditions and an improvement in expectations.
Existing Home Sales Released 7/20/2023 – June 2023 brought 4.16 million in sales, a decrease of 3.3% from May. The median sales price was $410,200. The current unsold housing inventory was 3.1 months of inventory.
Next week we get data on Existing Home Sales, New Residential Sales, and Durable Goods.
Data Sources:
Bureau of Economic Analysis (BEA)
Congressional Budget Office (CBO)
U.S. Bureau of Labor Statistics (BLS)
Federal Reserve Economic Data (FRED Charts)
CME Fed Watch
U.S. Treasury – Yields
U.S. Census Bureau
Institute for Supply Management (ISM)
Weekly DOL Employment Data
BLS Monthly Jobs Report
JOLTS
US Energy Admin (EIA)
BLS Consumer Price Index CPI
BLS Producer Price Index PPI
Atlanta Fed GDPNOW
NY Fed Nowcast GDP
US Census Bureau Housing Starts
Consumer Credit
USCB Retail Sales
Construction Spending
Federal Reserve Dot Plots
NY Empire Index
Philadelphia Federal Reserve
P/E Ratio Data -Yardeni Research
Technical Analysis Info:
StockCharts.com – Financial Charts
Exponential vs Simple moving average
Koyfin.com
Other Links:
1973 Arab Oil Embargo
Hunt Brothers Silver
Long-Term Capital bailout
Asian Contagion
Categories:
Tags: