Good Life Advisors – Talking Points – Week 32
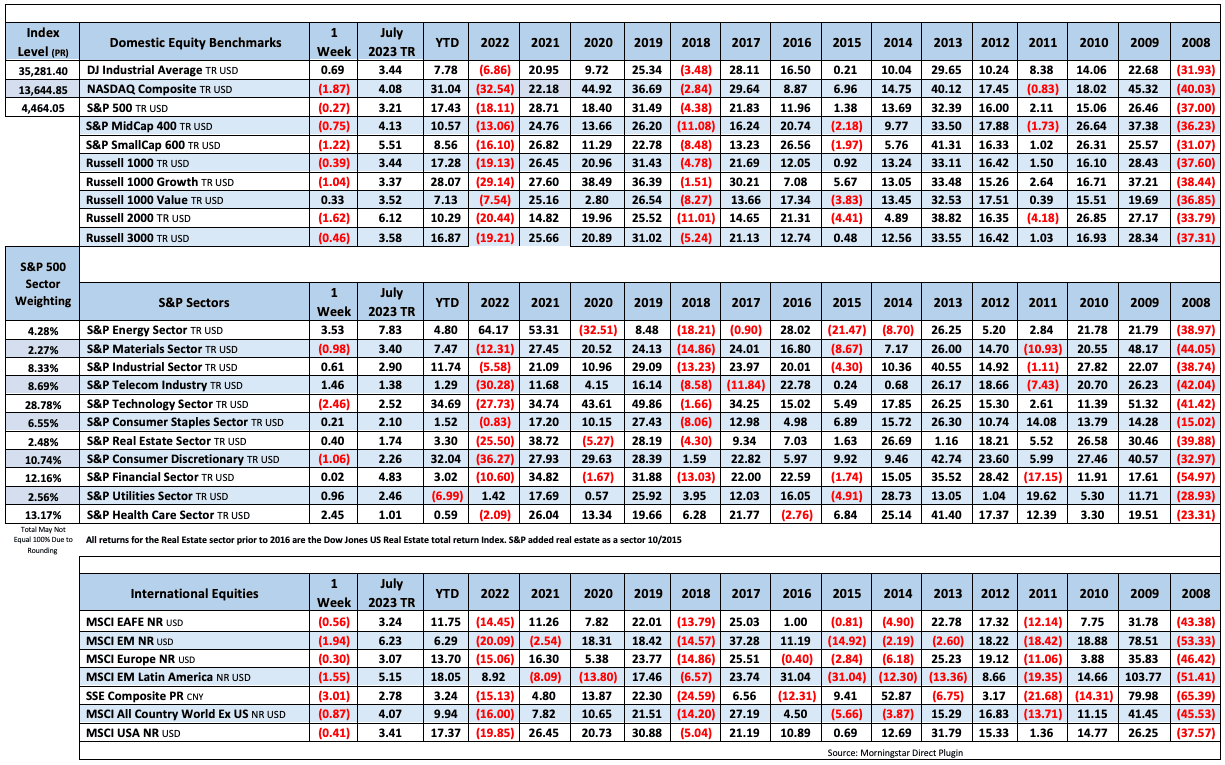
US equities were mostly lower this week, with most major indices adding to last week’s declines (though the DJIA logged a weekly gain). Treasuries were weaker with some curve flattening. The dollar was stronger against the major crosses, particularly vs the yen. Gold finished down 1.5%. Oil was higher, with WTI settling up 0.4% and notching its seventh consecutive weekly gain.
Big tech was mostly lower, particularly NVDA (8.6%), TSLA (4.4%), and AAPL (2.3%). Not much change to the overall narrative. Inflation remains a primary concern, but this week’s softer July CPI report did little more than solidify prior expectations that the Fed may hold rates firm in September. The tail end of the Q2 earnings season has so far not presented any new themes and the broader economic picture remains focused on the likelihood of a soft landing. In this environment, many analysts maintain that the S&P will continue to bounce around in a fairly narrow range as the various bullish and bearish themes are debated. The bulls this week could point to disinflationary traction, some dovish Fedspeak, a solid corporate backdrop with some areas of optimism (including some M&A, obesity-drug breakthroughs, and ongoing AI sentiment). But by the same token, bears this week cited higher Treasury yields (and worries about absorption of new supply), China recovery worries, rising energy prices, Moody’s bank downgrade, and challenging seasonality.
There were few surprises in Thursday’s largely in-line release of July CPI, with the headline and core measures printing monthly increases just below 0.2% for the second straight month. As expected, shelter prices were responsible for most of the increase while airfares and used vehicles continued to drop. The report was largely consistent with expectations that the Fed will remain on hold in September (though the August CPI report will be out before the FOMC meets again). Friday’s hotter-than-forecast July PPI report was greeted with some caution but did not materially impact rate expectations.
There was some attention on Moody’s cut to credit ratings for on ten small and midsize banks (and a warning it may downgrade several others), a development that contributed to the risk-off tone earlier in the week. Nevertheless, sell-side takeaways pointed out that the Moody’s downgrade did not provide any incremental information, as funding cost and other profitability pressures, along with concerns about CRE exposure, have been widely understood for some time.
The market continued to process a high volume of reports from the Q2 earnings season, though only 34 S&P 500 constituents. More than 90% of that index has now reported, with members continuing to report earnings marginally better than expected (but generally not seeing positive earnings surprises rewarded). We are entering the tail end of the Q2 earnings season, but there are still a few highly anticipated reports from retailers (including HD premarket Tuesday; TGT and TJX premarket Wednesday; and WMT on Thursday morning). There will be a modest amount of economic data, particularly the July retail sales report on Tuesday morning. Markets will also process the NY Fed’s August Empire survey and August NAHB homebuilder confidence (Tuesday); July housing starts/permits and July industrial production (Wednesday); and weekly jobless claims and the Philadelphia Fed August survey (Thursday). Finally, the minutes of the July FOMC meeting will be released at 2pm Eastern on Wednesday 16-Aug.
Fixed Income

Yield Curve
May FOMC Statement March Fed Minutes Balance Sheet Reduction Plan Credit, Liquidity and Balance Sheet Federal Reserve Dot Plots
Treasury.gov yields FOMC Policy Normalization Statement Longer- Run Goals Jan 2022
Foreign Exchange Market
Energy Complex
The Baker Hughes rig count was down 5 this week. There are 654 oil and gas rigs operating in the US – Down 109 from last year.
Metals Complex
Employment Picture
Weekly Unemployment Claims – Released Thursday 8/10/2023 – In the week ending August 5, the advance figure for seasonally adjusted initial claims was 248,000 increasing 21,000 from the previous week’s revised level. The 4-week moving average was 231,000 a increase of 2,750 from the previous week’s revised average.
July Jobs Report – BLS Summary – Released 8/4/2023 – The US Economy added 187k nonfarm jobs in July and the Unemployment rate was little changed at 3.5%. Average hourly earnings increased 14 cents to $33.74. Hiring highlights include +100k Education and Health Services.
- Average hourly earnings increased 14 cents/0.4% to $33.74.
- U3 unemployment rate was little changed at 3.5%. U6 unemployment rate decreased 0.2% to 6.7%.
- The labor force participation rate was unchanged at 62.6%.
- Average work week decreased 0.1 hours to 34.3 hours.
Job Openings & Labor Turnover Survey JOLTS – Released 8/1/2023 – The number of job openings decreased to 9.6 million on the last business day of June, the U.S. Bureau of Labor Statistics reported. Over the month the number of hires and total separations decreased to 5.9 million and 5.6 million, respectively. Within separations, quits (3.8 million) increased and discharges (1.5 million) changed little.
Employment Cost Index – Released 7/28/2023 – Compensation costs for civilian workers increased 1.0% for the 3-month period ending in June 2023. The 12-month period ending in June 2023 saw compensation costs increase by 4.5. The 12-month period ending June 2022 increased 5.1%. Wages and salaries increased 4.6 percent over the 12-month June 2023 and increased 5.3 percent for the 12-month period ending in June 2022. Benefit costs increased 4.2 percent over the 12-month period ending June 2023 and increased 4.8 percent for the 12-month period ending in June 2022. This report is published quarterly.
This Week’s Economic Data
Links take you to the data source
Producer Price Index – Released 8/11/2023 – The Producer Price Index for final demand increased 0.3 percent in July, seasonally adjusted. Final demand were unchanged in June and decreased 0.3 in May. On an unadjusted basis, the index for final demand moved up 0.8 percent for the 12 months ended in July.
Consumer Price Index – Released 8/10/2023 – The Consumer Price Index for All Urban Consumers rose 0.2 percent in July on a seasonally adjusted basis, after increasing 0.2 percent in June. Over the last 12 months, the all items index increased 3.2 percent before seasonal adjustment.
U.S. Trade Balance – Released 8/8/2023 – The U.S. Census Bureau and the U.S. Bureau of Economic Analysis announced that the goods and services deficit was $65.5 billion in June, down $2.8 billion from $68.3 billion in May. June exports were $247.5 billion, $0.3 billion less than May exports. June imports were $313.0 billion, $3.1 billion less than May imports. The June decrease in the goods and services deficit reflected a decrease in the goods deficit of $2.8 billion to $88.2 billion and a decrease in the services surplus of less than $0.1 billion to $22.7 billion.
Consumer Credit – Released 8/7/2023 – Consumer credit increased at a seasonally adjusted annual rate of 4 percent in the second quarter. Revolving credit increased at an annual rate of 7.1 percent, while nonrevolving credit increased at an annual rate of 3.0 percent. Consumer credit increased at a seasonally adjusted annual rate of 4.3 percent in June.
Recent Economic Data
Links take you to the data source
PMI Non-Manufacturing Index – Released 8/3/2023 – Economic activity in the services sector expanded in July for the seventh consecutive month as the Services PMI® registered 52.7 percent, 1.2 percentage point lower than June’s reading of 53.9 percent.
U.S. Construction Spending – Released 8/1/2023 – Construction spending during June 2023 was estimated at a seasonally adjusted annual rate of $1,938.4 billion, 0.5 percent above the revised May estimate of $1,929.6 billion. The June figure is 3.5 percent above the June 2022 estimate of $1,873.2 billion.
PMI Manufacturing Index – Released 8/1/2023 – The July Manufacturing PMI registered 46.4 percent, 0.4 percentage points higher than the 46.0 percent recorded in June. Regarding the overall economy, this figure indicates an eighth month of contraction after a 30-month period of expansion. The New Orders Index remained in contraction territory at 47.3 percent, 1.7 percentage points higher than the figure of 45.6 percent recorded in June. The Production Index reading of 48.3 percent is a 1.6-percentage point increase compared to June’s figure of 46.7 percent.
Chicago PMI – Released 7/31/2023 – Chicago PMI remained in contraction territory in July increasing to 42.8 points up from 41.5 points in June. This marks eleven months in contractionary territory.
US Light Vehicle Sales – Released 7/28/2023 – U.S. light vehicle sales were at a seasonally adjusted annual rate (SAAR) of 15.657 million units in June.
Personal Income – Released 7/28/2023 – Personal income increased $69.5 billion (0.3 percent at a monthly rate) in June. Disposable personal income (DPI) increased $67.5 billion (0.3 percent). Personal consumption expenditures (PCE) increased $100.4 billion (0.5 percent).
Advance Estimate of 2nd Quarter 2023 GDP – Released 7/27/2023 – Real gross domestic product (GDP) increased at an annual rate of 2.4 percent in the second quarter of 2023, according to the “advance” estimate released by the Bureau of Economic Analysis. In the first quarter, real GDP increased 2.0 percent. The GDP estimate released today is based on source data that are incomplete or subject to further revision. The increase in real GDP reflected increases in consumer spending, nonresidential fixed investment, state and local government spending, private inventory investment, and federal government spending that were partly offset by decreases in exports and residential fixed investment. Imports, which are a subtraction in the calculation of GDP, decreased.
Durable Goods – Released 7/27/2023 – New orders for manufactured durable goods in June, up four consecutive months, increased $13.6 billion or 4.7 percent to $302.5 billion, the U.S. Census Bureau announced today. This followed a 2.0 percent May increase. Excluding transportation, new orders increased 0.6 percent. Excluding defense, new orders increased 6.2 percent. Transportation equipment, also up four consecutive months, drove the increase, $12.4 billion or 12.1 percent to $115.3 billion.
New Residential Sales – Released 7/26/2023 – Sales of new single‐family houses in June 2023 were at a seasonally adjusted annual rate of 697,000, according to estimates released jointly by the U.S. Census Bureau and the Department of Housing and Urban Development. This is 2.5 percent below the revised May rate of 715,000 but is 23.8 percent above the June 2022 estimate of 563,000. The median sales price of new houses sold in June 2023 was $415,400. The average sales price was $494,700. At the end of June, the seasonally adjusted estimate of new homes for sale was 432,000, a supply of 7.4 months at the current sales rate.
Consumer Confidence – Released 7/25/2023 – Consumer Confidence increased in July to 117.0, up from 110.1 in June.Consumer confidence improved in July to its highest level since July 2021, reflecting improved current conditions and an improvement in expectations.
Existing Home Sales – Released 7/20/2023 – June 2023 brought 4.16 million in sales, a decrease of 3.3% from May. The median sales price was $410,200. The current unsold housing inventory was 3.1 months of inventory.
Housing Starts – Released 7/19/2023 – June housing starts came in at 1,434,000, 8.0% below the May estimate and 8.1% below the June 2022 rate. Building permits were 3.7% below the May rate at $1,440,000 and 15.3% below the June 2022 rate.
Industrial Production and Capacity Utilization – Released 7/18/2023 – Industrial production decreased 0.5% in June for the second consecutive month. Utilities output fell 2.6%. Manufacturing decreased 0.3%. Mining fell 0.2%. Capacity utilization declined to 78.9% in June, 0.8% below the long-run average.
Retail Sales – Released 7/18/2023 – Headline retail sales increased 0.2% in June and are up 1.5% above June 2022.
Next week we get data on Retail Sales, Industrial Production and Capacity Utilization, and Housing Starts.
Data Sources:
Bureau of Economic Analysis (BEA)
Congressional Budget Office (CBO)
U.S. Bureau of Labor Statistics (BLS)
Federal Reserve Economic Data (FRED Charts)
CME Fed Watch
U.S. Treasury – Yields
U.S. Census Bureau
Institute for Supply Management (ISM)
Weekly DOL Employment Data
BLS Monthly Jobs Report
JOLTS
US Energy Admin (EIA)
BLS Consumer Price Index CPI
BLS Producer Price Index PPI
Atlanta Fed GDPNOW
NY Fed Nowcast GDP
US Census Bureau Housing Starts
Consumer Credit
USCB Retail Sales
Construction Spending
Federal Reserve Dot Plots
NY Empire Index
Philadelphia Federal Reserve
P/E Ratio Data -Yardeni Research
Technical Analysis Info:
StockCharts.com – Financial Charts
Exponential vs Simple moving average
Koyfin.com
Other Links:
1973 Arab Oil Embargo
Hunt Brothers Silver
Long-Term Capital bailout
Asian Contagion


Week 32 Talking Points
Table of Contents
Good Life Advisors – Talking Points – Week 32
US equities were mostly lower this week, with most major indices adding to last week’s declines (though the DJIA logged a weekly gain). Treasuries were weaker with some curve flattening. The dollar was stronger against the major crosses, particularly vs the yen. Gold finished down 1.5%. Oil was higher, with WTI settling up 0.4% and notching its seventh consecutive weekly gain.
Big tech was mostly lower, particularly NVDA (8.6%), TSLA (4.4%), and AAPL (2.3%). Not much change to the overall narrative. Inflation remains a primary concern, but this week’s softer July CPI report did little more than solidify prior expectations that the Fed may hold rates firm in September. The tail end of the Q2 earnings season has so far not presented any new themes and the broader economic picture remains focused on the likelihood of a soft landing. In this environment, many analysts maintain that the S&P will continue to bounce around in a fairly narrow range as the various bullish and bearish themes are debated. The bulls this week could point to disinflationary traction, some dovish Fedspeak, a solid corporate backdrop with some areas of optimism (including some M&A, obesity-drug breakthroughs, and ongoing AI sentiment). But by the same token, bears this week cited higher Treasury yields (and worries about absorption of new supply), China recovery worries, rising energy prices, Moody’s bank downgrade, and challenging seasonality.
There were few surprises in Thursday’s largely in-line release of July CPI, with the headline and core measures printing monthly increases just below 0.2% for the second straight month. As expected, shelter prices were responsible for most of the increase while airfares and used vehicles continued to drop. The report was largely consistent with expectations that the Fed will remain on hold in September (though the August CPI report will be out before the FOMC meets again). Friday’s hotter-than-forecast July PPI report was greeted with some caution but did not materially impact rate expectations.
There was some attention on Moody’s cut to credit ratings for on ten small and midsize banks (and a warning it may downgrade several others), a development that contributed to the risk-off tone earlier in the week. Nevertheless, sell-side takeaways pointed out that the Moody’s downgrade did not provide any incremental information, as funding cost and other profitability pressures, along with concerns about CRE exposure, have been widely understood for some time.
The market continued to process a high volume of reports from the Q2 earnings season, though only 34 S&P 500 constituents. More than 90% of that index has now reported, with members continuing to report earnings marginally better than expected (but generally not seeing positive earnings surprises rewarded). We are entering the tail end of the Q2 earnings season, but there are still a few highly anticipated reports from retailers (including HD premarket Tuesday; TGT and TJX premarket Wednesday; and WMT on Thursday morning). There will be a modest amount of economic data, particularly the July retail sales report on Tuesday morning. Markets will also process the NY Fed’s August Empire survey and August NAHB homebuilder confidence (Tuesday); July housing starts/permits and July industrial production (Wednesday); and weekly jobless claims and the Philadelphia Fed August survey (Thursday). Finally, the minutes of the July FOMC meeting will be released at 2pm Eastern on Wednesday 16-Aug.
Fixed Income
Yield Curve
May FOMC Statement March Fed Minutes Balance Sheet Reduction Plan Credit, Liquidity and Balance Sheet Federal Reserve Dot Plots
Treasury.gov yields FOMC Policy Normalization Statement Longer- Run Goals Jan 2022
Foreign Exchange Market
Energy Complex
The Baker Hughes rig count was down 5 this week. There are 654 oil and gas rigs operating in the US – Down 109 from last year.
Metals Complex
Employment Picture
Weekly Unemployment Claims – Released Thursday 8/10/2023 – In the week ending August 5, the advance figure for seasonally adjusted initial claims was 248,000 increasing 21,000 from the previous week’s revised level. The 4-week moving average was 231,000 a increase of 2,750 from the previous week’s revised average.
July Jobs Report – BLS Summary – Released 8/4/2023 – The US Economy added 187k nonfarm jobs in July and the Unemployment rate was little changed at 3.5%. Average hourly earnings increased 14 cents to $33.74. Hiring highlights include +100k Education and Health Services.
Job Openings & Labor Turnover Survey JOLTS – Released 8/1/2023 – The number of job openings decreased to 9.6 million on the last business day of June, the U.S. Bureau of Labor Statistics reported. Over the month the number of hires and total separations decreased to 5.9 million and 5.6 million, respectively. Within separations, quits (3.8 million) increased and discharges (1.5 million) changed little.
Employment Cost Index – Released 7/28/2023 – Compensation costs for civilian workers increased 1.0% for the 3-month period ending in June 2023. The 12-month period ending in June 2023 saw compensation costs increase by 4.5. The 12-month period ending June 2022 increased 5.1%. Wages and salaries increased 4.6 percent over the 12-month June 2023 and increased 5.3 percent for the 12-month period ending in June 2022. Benefit costs increased 4.2 percent over the 12-month period ending June 2023 and increased 4.8 percent for the 12-month period ending in June 2022. This report is published quarterly.
This Week’s Economic Data
Links take you to the data source
Producer Price Index – Released 8/11/2023 – The Producer Price Index for final demand increased 0.3 percent in July, seasonally adjusted. Final demand were unchanged in June and decreased 0.3 in May. On an unadjusted basis, the index for final demand moved up 0.8 percent for the 12 months ended in July.
Consumer Price Index – Released 8/10/2023 – The Consumer Price Index for All Urban Consumers rose 0.2 percent in July on a seasonally adjusted basis, after increasing 0.2 percent in June. Over the last 12 months, the all items index increased 3.2 percent before seasonal adjustment.
U.S. Trade Balance – Released 8/8/2023 – The U.S. Census Bureau and the U.S. Bureau of Economic Analysis announced that the goods and services deficit was $65.5 billion in June, down $2.8 billion from $68.3 billion in May. June exports were $247.5 billion, $0.3 billion less than May exports. June imports were $313.0 billion, $3.1 billion less than May imports. The June decrease in the goods and services deficit reflected a decrease in the goods deficit of $2.8 billion to $88.2 billion and a decrease in the services surplus of less than $0.1 billion to $22.7 billion.
Consumer Credit – Released 8/7/2023 – Consumer credit increased at a seasonally adjusted annual rate of 4 percent in the second quarter. Revolving credit increased at an annual rate of 7.1 percent, while nonrevolving credit increased at an annual rate of 3.0 percent. Consumer credit increased at a seasonally adjusted annual rate of 4.3 percent in June.
Recent Economic Data
Links take you to the data source
PMI Non-Manufacturing Index – Released 8/3/2023 – Economic activity in the services sector expanded in July for the seventh consecutive month as the Services PMI® registered 52.7 percent, 1.2 percentage point lower than June’s reading of 53.9 percent.
U.S. Construction Spending – Released 8/1/2023 – Construction spending during June 2023 was estimated at a seasonally adjusted annual rate of $1,938.4 billion, 0.5 percent above the revised May estimate of $1,929.6 billion. The June figure is 3.5 percent above the June 2022 estimate of $1,873.2 billion.
PMI Manufacturing Index – Released 8/1/2023 – The July Manufacturing PMI registered 46.4 percent, 0.4 percentage points higher than the 46.0 percent recorded in June. Regarding the overall economy, this figure indicates an eighth month of contraction after a 30-month period of expansion. The New Orders Index remained in contraction territory at 47.3 percent, 1.7 percentage points higher than the figure of 45.6 percent recorded in June. The Production Index reading of 48.3 percent is a 1.6-percentage point increase compared to June’s figure of 46.7 percent.
Chicago PMI – Released 7/31/2023 – Chicago PMI remained in contraction territory in July increasing to 42.8 points up from 41.5 points in June. This marks eleven months in contractionary territory.
US Light Vehicle Sales – Released 7/28/2023 – U.S. light vehicle sales were at a seasonally adjusted annual rate (SAAR) of 15.657 million units in June.
Personal Income – Released 7/28/2023 – Personal income increased $69.5 billion (0.3 percent at a monthly rate) in June. Disposable personal income (DPI) increased $67.5 billion (0.3 percent). Personal consumption expenditures (PCE) increased $100.4 billion (0.5 percent).
Advance Estimate of 2nd Quarter 2023 GDP – Released 7/27/2023 – Real gross domestic product (GDP) increased at an annual rate of 2.4 percent in the second quarter of 2023, according to the “advance” estimate released by the Bureau of Economic Analysis. In the first quarter, real GDP increased 2.0 percent. The GDP estimate released today is based on source data that are incomplete or subject to further revision. The increase in real GDP reflected increases in consumer spending, nonresidential fixed investment, state and local government spending, private inventory investment, and federal government spending that were partly offset by decreases in exports and residential fixed investment. Imports, which are a subtraction in the calculation of GDP, decreased.
Durable Goods – Released 7/27/2023 – New orders for manufactured durable goods in June, up four consecutive months, increased $13.6 billion or 4.7 percent to $302.5 billion, the U.S. Census Bureau announced today. This followed a 2.0 percent May increase. Excluding transportation, new orders increased 0.6 percent. Excluding defense, new orders increased 6.2 percent. Transportation equipment, also up four consecutive months, drove the increase, $12.4 billion or 12.1 percent to $115.3 billion.
New Residential Sales – Released 7/26/2023 – Sales of new single‐family houses in June 2023 were at a seasonally adjusted annual rate of 697,000, according to estimates released jointly by the U.S. Census Bureau and the Department of Housing and Urban Development. This is 2.5 percent below the revised May rate of 715,000 but is 23.8 percent above the June 2022 estimate of 563,000. The median sales price of new houses sold in June 2023 was $415,400. The average sales price was $494,700. At the end of June, the seasonally adjusted estimate of new homes for sale was 432,000, a supply of 7.4 months at the current sales rate.
Consumer Confidence – Released 7/25/2023 – Consumer Confidence increased in July to 117.0, up from 110.1 in June.Consumer confidence improved in July to its highest level since July 2021, reflecting improved current conditions and an improvement in expectations.
Existing Home Sales – Released 7/20/2023 – June 2023 brought 4.16 million in sales, a decrease of 3.3% from May. The median sales price was $410,200. The current unsold housing inventory was 3.1 months of inventory.
Housing Starts – Released 7/19/2023 – June housing starts came in at 1,434,000, 8.0% below the May estimate and 8.1% below the June 2022 rate. Building permits were 3.7% below the May rate at $1,440,000 and 15.3% below the June 2022 rate.
Industrial Production and Capacity Utilization – Released 7/18/2023 – Industrial production decreased 0.5% in June for the second consecutive month. Utilities output fell 2.6%. Manufacturing decreased 0.3%. Mining fell 0.2%. Capacity utilization declined to 78.9% in June, 0.8% below the long-run average.
Retail Sales – Released 7/18/2023 – Headline retail sales increased 0.2% in June and are up 1.5% above June 2022.
Next week we get data on Retail Sales, Industrial Production and Capacity Utilization, and Housing Starts.
Data Sources:
Bureau of Economic Analysis (BEA)
Congressional Budget Office (CBO)
U.S. Bureau of Labor Statistics (BLS)
Federal Reserve Economic Data (FRED Charts)
CME Fed Watch
U.S. Treasury – Yields
U.S. Census Bureau
Institute for Supply Management (ISM)
Weekly DOL Employment Data
BLS Monthly Jobs Report
JOLTS
US Energy Admin (EIA)
BLS Consumer Price Index CPI
BLS Producer Price Index PPI
Atlanta Fed GDPNOW
NY Fed Nowcast GDP
US Census Bureau Housing Starts
Consumer Credit
USCB Retail Sales
Construction Spending
Federal Reserve Dot Plots
NY Empire Index
Philadelphia Federal Reserve
P/E Ratio Data -Yardeni Research
Technical Analysis Info:
StockCharts.com – Financial Charts
Exponential vs Simple moving average
Koyfin.com
Other Links:
1973 Arab Oil Embargo
Hunt Brothers Silver
Long-Term Capital bailout
Asian Contagion
Categories:
Tags: