Election Rally
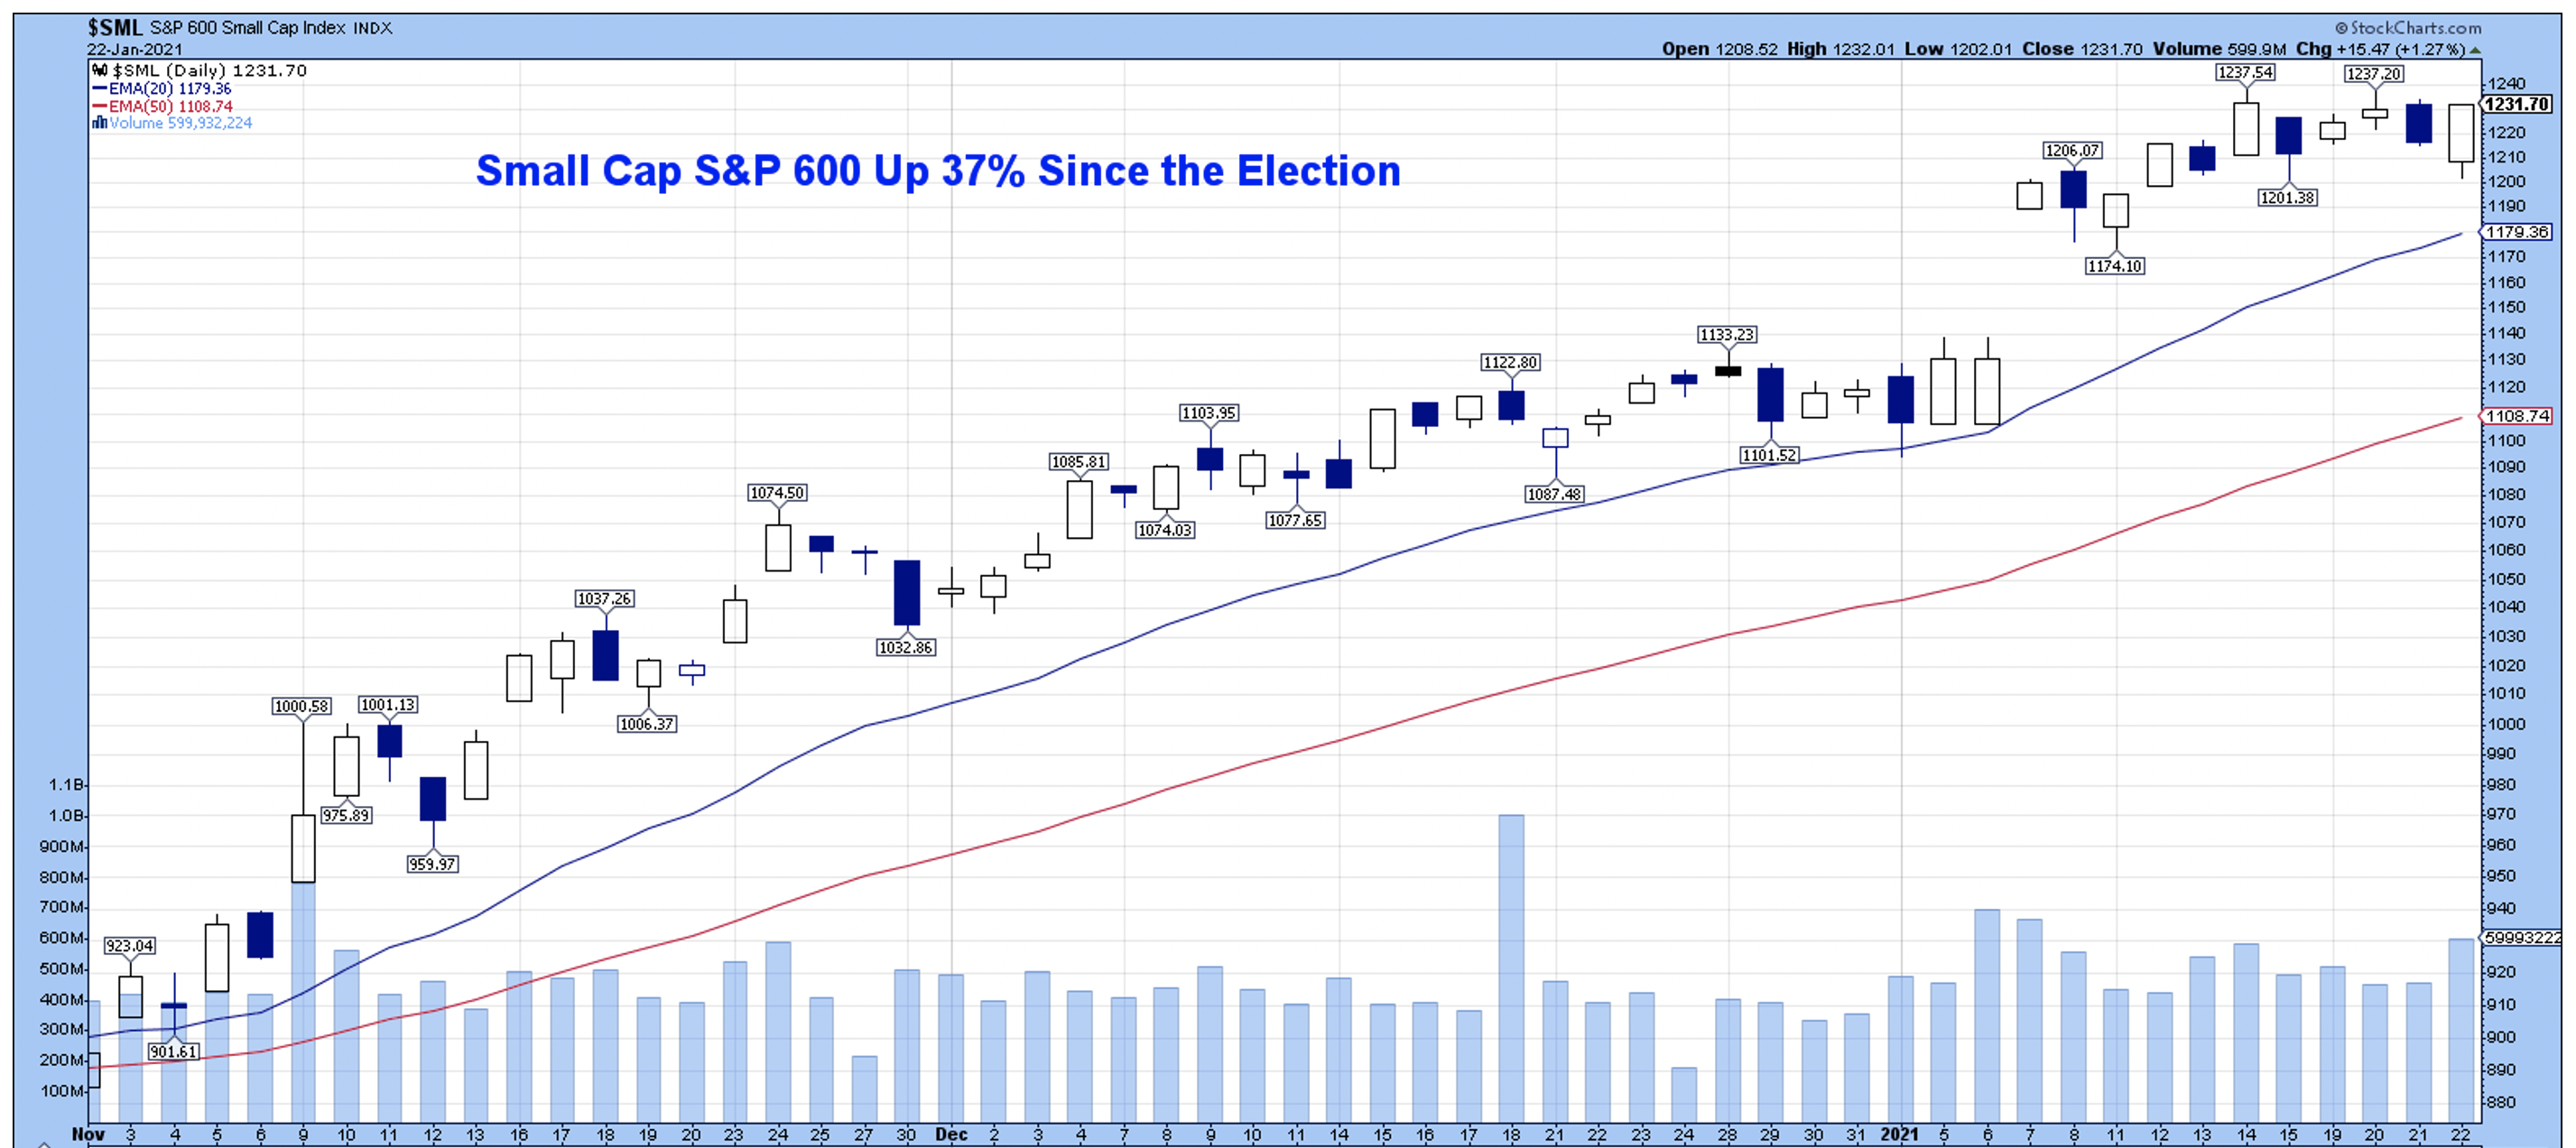
Crude oil is trading solidly in the mid-50s and the energy sector is up over 11% so far this year but is actually up 43% since election day. Small caps are also finding themselves in the middle of a massive election rally, having jumped 37% since Nov 3rd and up 10% YTD while the S&P500 is “only” up 16% over the same time frame. As LPL’s Ryan Detrick points out, the S&P500 actually made a new record, jumping 14.3% from Election day through the Inauguration.

.
Fixed Income
12/16/20 FOMC Statement FOMC Minutes Credit, Liquidity and Balance Sheet Federal Reserve Dot Plots US Debt Measurement US Corporate Debt Tops 7 Trillion Treasury.gov yields FOMC Policy Normalization Statement Longer Run Goals August 2020
Global Bond Yields
Daily US Treasury Yields
Foreign Exchange Market
Energy Complex
After a wild ride in 2020 where we witnessed a negative price in the futures markets, crude oil is making its home in the mid-50s and is up more than six percent in 2021.
The Baker Hughes rig count gained 5 this week. There are 378 oil and gas rigs operating in the US – down 416 over last year.
- Brent Crude Oil gained 0.51% this week closing at $55.24/bbl
- WTI Crude Oil lost 0.29% this week to close at $52.27/bbl
- Heating Oil lost 0.92% this week closing at $1.58/gallon
- Natural Gas lost 10.27% this week closing at $2.46 per million BTUs
- Unleaded Gas gained 1.13% this week closing at $1.54/gallon
Metals Complex
- Gold gained 1.44% this week closing at $1856.20/oz
- Silver gained 2.77% on the week closing at $25.56/oz
- Palladium lost 1.25% this week closing at $2365.20/oz
- Platinum gained 1.99% this week closing at $1111.60/oz
- Copper gained 0.67% this week closing at $3.63/lb
Employment Picture
Weekly Unemployment Claims – Released Thursday 1/21/2021 – Initial jobless claims for the week ending January 16thdecreased 26k to 900k. The 4-week moving average was 848k, an increase of 23.5k.
Job Openings & Labor Turnover Survey JOLTS – Released 1/12/2021 – The U.S. Bureau of Labor Statistics reported the number and rate of job openings was little changed at 6.5 million on the last business day of November. Over the month, hires were little changed at 6.0 million and separations increased to 5.4 million. Within separations, the quits rate was unchanged at 2.2%. The layoffs and discharges rates increased to 1.4%.
November Jobs Report – BLS Summary – Released 1/8/2021 – The US Economy lost 140k nonfarm jobs in December and the Unemployment rate was unchanged at 6.7%. Average hourly earnings increased 23 cents to $29.81. Hiring highlights include +161k Professional and Business Services, +121k Retail Trade, and -498k Leisure and Hospitality.
- Average hourly earnings increased 23 cents to $29.81.
- U3 unemployment rate was unchanged at 6.7%. U6 unemployment rate declined to 11.7%.
- The labor force participation rate was unchanged 61.5%.
- Average work week declined 0.1 hour to 34.7 hours.
Employment Cost Index – Released 10/30/2020 – Compensation costs for civilian workers increased 0.5% for the 3-month period ending in June 2020. The 12 month period ending on September 2020 saw compensation costs increase by 2.4%. The 12 month period ending September 2019 increased 2.8%. Wages and salaries increased 2.5 percent over the year and increased 2.9 percent for the 12-month period ending in September 2019. Benefit costs increased 2.3 percent for the 12-month period ending in September 2020. In September 2019, the increase was also 2.3 percent. This report is published quarterly.
This Week’s Economic Data
Links take you to the data source
Existing Home Sales – Released 1/22/2020 – Existing home sales increased in December. Sales increased 0.7% to a seasonally adjusted rate of 6.76 million in December. Sales are currently up 22.2% from one year ago. Housing inventory sits at 1.07 million units. Down 16.4% over last month. Down 23% over last year. Unsold inventory sits at an all-time low 1.9 month supply. The median existing home price for all housing types was $309,800.
Housing Starts – Released 1/21/2021 – New home starts in December were at a seasonally adjusted annual rate of 1.669 million; up 5.8% above November and 5.2% above last December’s rate. Building Permits were at a seasonally adjusted annual rate of 1.709 million, up –4.5% compared to November and up 17.3% over last year.
Recent Economic Data
Links take you to the data source
Retail Sales – Released 1/15/2021 – U.S. retail sales for December decreased 0.7% to $540.9 billion. U.S. retail sales are up 2.9% year/y.
Industrial Production and Capacity Utilization – Released 1/15/2021 – In December Industrial production increased 1.6%. Total Industrial production is still 3.3% below its pre-pandemic February level. Manufacturing increased 0.9%. Mining increased 1.6%. Utilities increased 6.2%. Total industrial production was 105.7% of its 2012 average which is 3.6% lower in December than a year ago. Total capacity utilization increased 1.1% to 74.5% in December which is 5.3% below its long-run average.
Producer Price Index – Released 1/15/2021 – The Producer Price Index for final demand increased 0.3% in December. PPI less food and energy increased 0.5% in December.
Consumer Price Index – Released 1/13/2021 – The Consumer Price Index increased 0.4% in December. Core CPI, which excludes food and energy was also up 0.1%. The monthly changes left total CPI up 1.4% year-over-year and core CPI up 1.6%.
Consumer Credit – Released 1/8/2021 – In November, consumer credit increased at a seasonally adjusted rate of 4.4%. Revolving credit decreased at an annual rate of 1.0%, while nonrevolving credit increased at an annual rate of 6.1%. Total Outstanding consumer credit is currently at $4.179 trillion.
U.S. Trade Balance – Released 1/7/2021 – According to the U.S. Census Bureau of Economic Analysis, the goods and services deficit increased in November by $5.0 billion to $68.1 billion. November exports were $184.2.0 billion, $2.2 billion more than October exports. November imports were $252.3 billion, $7.2 billion more than October imports. The goods and services deficit increased $73.6 billion or 13.9% year-to-date, from the same period in 2019. Year – over – year exports and imports decreased $372.3 billion or 16.1% and decreased $298.7 billion or 10.5% respectively.
PMI Non-Manufacturing Index (ISM Services) – Released 1/6/2021 – Economic activity in the non-manufacturing sector grew in December for the seventh consecutive month. ISM Non-Manufacturing registered 57.2 percent, which is 1.3 percentage points above the adjusted November reading of 55.9 percent.
PMI Manufacturing ISM Index – Released 1/4/2021 – December PMI increased 3.2% to 60.7% from November’s reading of 57.5%. The New Orders Index was up 2.8% from November’s reading of 65.1% to 67.9%. The Production Index registered 64.8%, up 4.0%.
U.S. Construction Spending – Released 1/4/2021 – Construction spending increased 0.9% in November measuring at a seasonally adjusted annual rate of $1,459.4 billion. The November figure is 3.8% above the November 2019 estimate. Private construction spending was 1.2% above the revised October estimate at $1,098.6 billion. Public construction spending was 0.2% below the revised October estimate at $347.6 billion.
Chicago PMI – Released 12/30/2020 – Chicago PMI increased to 59.5 points in December following a decline in November. This marks six consecutive months above the 50-mark following a full year under it. Employment saw the largest monthly gain, followed by Order Backlogs. New Orders recorded the biggest decline.
Durable Goods – Released 12/23/2020 – New orders for manufactured durable goods in November increased for the seventh consecutive month up $2.2 billion or 0.9% to $244.2 billion. Transportation equipment led the increase raising $1.5 billion or 1.9% to $78.8 billion.
Personal Income – Released 12/23/2020 – Personal income decreased $221.8 billion or 1.1 percent in November according to estimates released today by the Bureau of Economic Analysis. Disposable personal income (DPI) decreased $218 billion or 1.2 percent and personal consumption expenditures (PCE) decreased $63.3 billion or 0.4 percent.
New Residential Sales – Released 12/23/2020 – Sales of new single-family homes declined 11% to 841k, seasonally adjusted, in November. The median sales price of new homes sold in November was $335,300 with an average sales price of $390,100. At the end of November, the seasonally adjusted estimate of new homes for sale was 286k. This represents a supply of 4.1 months at the current sales rate.
Third Estimate of 3rd Quarter 2020 GDP – Released 12/22/2020 – Real gross domestic product (GDP) increased at an annual rate of 33.4 percent in the third quarter of 2020, according to the third estimate released by the Bureau of Economic Analysis. This increase follows a 31.4% decline in GDP in the second quarter of 2020. The GDP third estimate is based on source data that are more complete than that of the advance estimate and second estimate. The increase in real GDP reflected increases in personal consumption expenditures (PCE), private inventory investment, exports, nonresidential fixed investment, and residential fixed investment that were partly offset by decreases in federal government spending (reflecting fewer fees paid to administer the Paycheck Protection Program loans), state and local government spending, and imports. With the second estimate, upward revisions to nonresidential fixed investment, residential investment, and exports were offset by downward revisions to state and local government spending, private inventory investment, imports, and personal consumption expenditures (PCE). In the third estimate, GDP was increased 33.4% vs. 33.1% in the second estimate. The upward revision primarily reflected larger increases in personal consumption expenditures (PCE) and nonresidential fixed investment.
Consumer Confidence – Released 12/22/2020 – The Consumer confidence index declined 4.6% in December following a decline in November. The Index now shows a reading of 88.6, down from 92.9 in November.
US Light Vehicle Sales – Released 12/17/2020 – U.S. light vehicle sales were at a seasonally adjusted annual rate (SAAR) of 15.552 million units in November.
Next week we get data on Consumer Confidence, New Residential Sales, Personal Income, Durable Goods, Chicago PMI, the Advance Estimate of 4th Quarter 2020 GDP, and the Employment Cost Index.
Data Sources:
Bureau of Economic Analysis (BEA)
Congressional Budget Office (CBO)
U.S. Bureau of Labor Statistics (BLS)
Federal Reserve Economic Data (FRED Charts)
CME Fed Watch
U.S. Treasury – Yields
U.S. Census Bureau
Institute for Supply Management (ISM)
Weekly DOL Employment Data
BLS Monthly Jobs Report
JOLTS
US Energy Admin (EIA)
BLS Consumer Price Index CPI
BLS Producer Price Index PPI
Atlanta Fed GDPNOW
NY Fed Nowcast GDP
US Census Bureau Housing Starts
Consumer Credit
USCB Retail Sales
Construction Spending
Federal Reserve Dot Plots
NY Empire Index
Philadelphia Federal Reserve
P/E Ratio Data -Yardeni Research
Technical Analysis Info:
StockCharts.com – Financial Charts
Exponential vs Simple moving average
Other Links:
1973 Arab Oil Embargo
Hunt Brothers Silver
Long-Term Capital bailout


Week 3 Talking Points
Election Rally
Crude oil is trading solidly in the mid-50s and the energy sector is up over 11% so far this year but is actually up 43% since election day. Small caps are also finding themselves in the middle of a massive election rally, having jumped 37% since Nov 3rd and up 10% YTD while the S&P500 is “only” up 16% over the same time frame. As LPL’s Ryan Detrick points out, the S&P500 actually made a new record, jumping 14.3% from Election day through the Inauguration.
.
Table of Contents
Fixed Income
12/16/20 FOMC Statement FOMC Minutes Credit, Liquidity and Balance Sheet Federal Reserve Dot Plots US Debt Measurement US Corporate Debt Tops 7 Trillion Treasury.gov yields FOMC Policy Normalization Statement Longer Run Goals August 2020
Global Bond Yields
Daily US Treasury Yields
Foreign Exchange Market
Energy Complex
After a wild ride in 2020 where we witnessed a negative price in the futures markets, crude oil is making its home in the mid-50s and is up more than six percent in 2021.
The Baker Hughes rig count gained 5 this week. There are 378 oil and gas rigs operating in the US – down 416 over last year.
Metals Complex
Employment Picture
Weekly Unemployment Claims – Released Thursday 1/21/2021 – Initial jobless claims for the week ending January 16thdecreased 26k to 900k. The 4-week moving average was 848k, an increase of 23.5k.
Job Openings & Labor Turnover Survey JOLTS – Released 1/12/2021 – The U.S. Bureau of Labor Statistics reported the number and rate of job openings was little changed at 6.5 million on the last business day of November. Over the month, hires were little changed at 6.0 million and separations increased to 5.4 million. Within separations, the quits rate was unchanged at 2.2%. The layoffs and discharges rates increased to 1.4%.
November Jobs Report – BLS Summary – Released 1/8/2021 – The US Economy lost 140k nonfarm jobs in December and the Unemployment rate was unchanged at 6.7%. Average hourly earnings increased 23 cents to $29.81. Hiring highlights include +161k Professional and Business Services, +121k Retail Trade, and -498k Leisure and Hospitality.
Employment Cost Index – Released 10/30/2020 – Compensation costs for civilian workers increased 0.5% for the 3-month period ending in June 2020. The 12 month period ending on September 2020 saw compensation costs increase by 2.4%. The 12 month period ending September 2019 increased 2.8%. Wages and salaries increased 2.5 percent over the year and increased 2.9 percent for the 12-month period ending in September 2019. Benefit costs increased 2.3 percent for the 12-month period ending in September 2020. In September 2019, the increase was also 2.3 percent. This report is published quarterly.
This Week’s Economic Data
Links take you to the data source
Existing Home Sales – Released 1/22/2020 – Existing home sales increased in December. Sales increased 0.7% to a seasonally adjusted rate of 6.76 million in December. Sales are currently up 22.2% from one year ago. Housing inventory sits at 1.07 million units. Down 16.4% over last month. Down 23% over last year. Unsold inventory sits at an all-time low 1.9 month supply. The median existing home price for all housing types was $309,800.
Housing Starts – Released 1/21/2021 – New home starts in December were at a seasonally adjusted annual rate of 1.669 million; up 5.8% above November and 5.2% above last December’s rate. Building Permits were at a seasonally adjusted annual rate of 1.709 million, up –4.5% compared to November and up 17.3% over last year.
Recent Economic Data
Links take you to the data source
Retail Sales – Released 1/15/2021 – U.S. retail sales for December decreased 0.7% to $540.9 billion. U.S. retail sales are up 2.9% year/y.
Industrial Production and Capacity Utilization – Released 1/15/2021 – In December Industrial production increased 1.6%. Total Industrial production is still 3.3% below its pre-pandemic February level. Manufacturing increased 0.9%. Mining increased 1.6%. Utilities increased 6.2%. Total industrial production was 105.7% of its 2012 average which is 3.6% lower in December than a year ago. Total capacity utilization increased 1.1% to 74.5% in December which is 5.3% below its long-run average.
Producer Price Index – Released 1/15/2021 – The Producer Price Index for final demand increased 0.3% in December. PPI less food and energy increased 0.5% in December.
Consumer Price Index – Released 1/13/2021 – The Consumer Price Index increased 0.4% in December. Core CPI, which excludes food and energy was also up 0.1%. The monthly changes left total CPI up 1.4% year-over-year and core CPI up 1.6%.
Consumer Credit – Released 1/8/2021 – In November, consumer credit increased at a seasonally adjusted rate of 4.4%. Revolving credit decreased at an annual rate of 1.0%, while nonrevolving credit increased at an annual rate of 6.1%. Total Outstanding consumer credit is currently at $4.179 trillion.
U.S. Trade Balance – Released 1/7/2021 – According to the U.S. Census Bureau of Economic Analysis, the goods and services deficit increased in November by $5.0 billion to $68.1 billion. November exports were $184.2.0 billion, $2.2 billion more than October exports. November imports were $252.3 billion, $7.2 billion more than October imports. The goods and services deficit increased $73.6 billion or 13.9% year-to-date, from the same period in 2019. Year – over – year exports and imports decreased $372.3 billion or 16.1% and decreased $298.7 billion or 10.5% respectively.
PMI Non-Manufacturing Index (ISM Services) – Released 1/6/2021 – Economic activity in the non-manufacturing sector grew in December for the seventh consecutive month. ISM Non-Manufacturing registered 57.2 percent, which is 1.3 percentage points above the adjusted November reading of 55.9 percent.
PMI Manufacturing ISM Index – Released 1/4/2021 – December PMI increased 3.2% to 60.7% from November’s reading of 57.5%. The New Orders Index was up 2.8% from November’s reading of 65.1% to 67.9%. The Production Index registered 64.8%, up 4.0%.
U.S. Construction Spending – Released 1/4/2021 – Construction spending increased 0.9% in November measuring at a seasonally adjusted annual rate of $1,459.4 billion. The November figure is 3.8% above the November 2019 estimate. Private construction spending was 1.2% above the revised October estimate at $1,098.6 billion. Public construction spending was 0.2% below the revised October estimate at $347.6 billion.
Chicago PMI – Released 12/30/2020 – Chicago PMI increased to 59.5 points in December following a decline in November. This marks six consecutive months above the 50-mark following a full year under it. Employment saw the largest monthly gain, followed by Order Backlogs. New Orders recorded the biggest decline.
Durable Goods – Released 12/23/2020 – New orders for manufactured durable goods in November increased for the seventh consecutive month up $2.2 billion or 0.9% to $244.2 billion. Transportation equipment led the increase raising $1.5 billion or 1.9% to $78.8 billion.
Personal Income – Released 12/23/2020 – Personal income decreased $221.8 billion or 1.1 percent in November according to estimates released today by the Bureau of Economic Analysis. Disposable personal income (DPI) decreased $218 billion or 1.2 percent and personal consumption expenditures (PCE) decreased $63.3 billion or 0.4 percent.
New Residential Sales – Released 12/23/2020 – Sales of new single-family homes declined 11% to 841k, seasonally adjusted, in November. The median sales price of new homes sold in November was $335,300 with an average sales price of $390,100. At the end of November, the seasonally adjusted estimate of new homes for sale was 286k. This represents a supply of 4.1 months at the current sales rate.
Third Estimate of 3rd Quarter 2020 GDP – Released 12/22/2020 – Real gross domestic product (GDP) increased at an annual rate of 33.4 percent in the third quarter of 2020, according to the third estimate released by the Bureau of Economic Analysis. This increase follows a 31.4% decline in GDP in the second quarter of 2020. The GDP third estimate is based on source data that are more complete than that of the advance estimate and second estimate. The increase in real GDP reflected increases in personal consumption expenditures (PCE), private inventory investment, exports, nonresidential fixed investment, and residential fixed investment that were partly offset by decreases in federal government spending (reflecting fewer fees paid to administer the Paycheck Protection Program loans), state and local government spending, and imports. With the second estimate, upward revisions to nonresidential fixed investment, residential investment, and exports were offset by downward revisions to state and local government spending, private inventory investment, imports, and personal consumption expenditures (PCE). In the third estimate, GDP was increased 33.4% vs. 33.1% in the second estimate. The upward revision primarily reflected larger increases in personal consumption expenditures (PCE) and nonresidential fixed investment.
Consumer Confidence – Released 12/22/2020 – The Consumer confidence index declined 4.6% in December following a decline in November. The Index now shows a reading of 88.6, down from 92.9 in November.
US Light Vehicle Sales – Released 12/17/2020 – U.S. light vehicle sales were at a seasonally adjusted annual rate (SAAR) of 15.552 million units in November.
Next week we get data on Consumer Confidence, New Residential Sales, Personal Income, Durable Goods, Chicago PMI, the Advance Estimate of 4th Quarter 2020 GDP, and the Employment Cost Index.
Data Sources:
Bureau of Economic Analysis (BEA)
Congressional Budget Office (CBO)
U.S. Bureau of Labor Statistics (BLS)
Federal Reserve Economic Data (FRED Charts)
CME Fed Watch
U.S. Treasury – Yields
U.S. Census Bureau
Institute for Supply Management (ISM)
Weekly DOL Employment Data
BLS Monthly Jobs Report
JOLTS
US Energy Admin (EIA)
BLS Consumer Price Index CPI
BLS Producer Price Index PPI
Atlanta Fed GDPNOW
NY Fed Nowcast GDP
US Census Bureau Housing Starts
Consumer Credit
USCB Retail Sales
Construction Spending
Federal Reserve Dot Plots
NY Empire Index
Philadelphia Federal Reserve
P/E Ratio Data -Yardeni Research
Technical Analysis Info:
StockCharts.com – Financial Charts
Exponential vs Simple moving average
Other Links:
1973 Arab Oil Embargo
Hunt Brothers Silver
Long-Term Capital bailout
Categories:
Tags: