Good Life Advisors – Talking Points – Week 29
40 New S&P Highs This Year
New Covid-19 infections continued to rise globally this week with the focus on the spread of the Delta variant. Concerns about the related risks to the global economic recovery were cited as big driver of the selloff in stocks on Monday with the Dow dropping over 900 points intra-day. However, the narrative seemed to quickly spin to the notion that such worries were overdone. Goldman Sachs has highlighted strong vaccine protection against hospitalizations, elevated elderly vaccination rates, higher natural immunity and a lower virus sensitivity of GDP. BofA noted that there is little evidence of the variant significantly affecting economic activity or spending on services, It pointed out that air travel, movie-going and dining out have all continued to increase. Companies in some of the epicenter industries, including the airlines, confirmed this dynamic on their Q2 conference calls this week. The WSJ also discussed how rather than reinstituting rules and restrictions like mask mandates and business and public space closures, local authorities in hot spots around the US are instead looking to curb the spread of the Delta variant by boosting stagnating vaccination rates.
Earnings and revenue beat rates running at record levels. According to FactSet’s latest Earnings Insight report, the blended growth rate for Q2 S&P 500 earnings is 74.2%, up more than 11pp from the end of the quarter, while the blended revenue growth rate is 20.9%. With nearly a quarter of the index having reported, 88% have surpassed consensus EPS expectations, ahead of the one- and five-year averages of 83% and 75%, respectively, and on track for the best performance since FactSet began tracking the metric in 2008. In addition, 86% have beaten consensus revenue expectations, ahead of the one- and five-year averages of 74% and 65%, respectively, and on track for the best performance since FactSet began tracking the metric in 2008. In aggregate, companies are reporting earnings 19% above expectations, better than the 7.8% five-year average, and on the heels of the record 23% positive surprise rate in Q1. In aggregate, companies are reporting revenues 4% above expectations, better than the five-year average positive surprise rate of 1.2%. The report also pointed out that the blended net profit margin for the S&P 500 stands at 12.4%, better than the five-year average of 10.8%.
A bipartisan infrastructure deal may actually get done. As widely expected, Senate Republicans rejected a procedural vote this week to advance the $1.2T bipartisan infrastructure legislation. Republicans argued that they could not support the measure given that the framework has not been finalized. Pay-fors remained the big stumbling block as negotiators scrapped a GOP-criticized provision to step up tax enforcement. However, there appeared to be a path forward late in the week with an agreement to delay a Trump-era Medicare regulation. The move, which eliminates rebates drug companies give benefit managers in Medicare Part D, will cut Medicare spending by about $177B over a decade. A deal could be finalized as soon as Monday though the House could still be a problem given Pelosi’s insistence that Senate Democrats also commit to a separate $3.5T reconciliation bill.
The debt ceiling started to receive some heightened attention as a headline risk for the market this week. The two-year suspension enacted by Congress in 2019 expires at the end of July. Senate Minority Leader McConnell told Punchbowl News that he does not expect a single Republican vote to raise the debt ceiling, while Democrats quickly rejected any attempt by Republicans to set conditions for another reprieve.

Fixed Income
4/28/21 FOMC Statement FOMC Minutes Credit, Liquidity and Balance Sheet Federal Reserve Dot Plots US Corporate Debt Tops 7 Trillion Treasury.gov yields FOMC Policy Normalization Statement Longer Run Goals August 2020
Global Bond Yields
Daily US Treasury Yields
Foreign Exchange Market
Energy Complex
The Baker Hughes rig count increased by 7 this week. There are 491 oil and gas rigs operating in the US – Up 240 over last year.
Metals Complex
Employment Picture
Weekly Unemployment Claims – Released Thursday 7/22/2021 – Initial jobless claims for the week ending July 17th increased 51k to 419k. The 4-week moving average was 385k, an increase of 750.
Job Openings & Labor Turnover Survey JOLTS – Released 7/7/2021 – The U.S. Bureau of Labor Statistics reported the number and rate of job openings was little changed at 9.2 million on the last business day of May. Over the month, hires were little changed at 5.9 million and separations decreased to 5.3 million. Within separations, the quits rate decreased to 2.5%. The layoffs and discharges rates decreased to 0.9%.
June Jobs Report – BLS Summary – Released 7/2/2021 – The US Economy added 850k nonfarm jobs in June and the Unemployment rate was little changed 5.9%. Average hourly earnings increased by 10 cents to $30.40. Hiring highlights include +343k Leisure and Hospitality, +72k Professional and Business Services, and +188k Government.
- Average hourly earnings increased by 10 cents to $30.40.
- U3 unemployment rate was little changed at 5.9%. U6 unemployment rate declined to 9.8%.
- The labor force participation rate was unchanged at 61.6%.
- Average work week decreased 0.1 hour to 34.7 hours.
Employment Cost Index – Released 4/30/2021 – Compensation costs for civilian workers increased 0.9% for the 3-month period ending in March 2021. The 12-month period ending in March 2021 saw compensation costs increase by 2.6%. The 12-month period ending March 2020 increased 2.8%. Wages and salaries increased 2.7 percent over the year and increased 3.1 percent for the 12-month period ending in March 2020. Benefit costs increased 2.5 percent over the year and increased 2.1 percent for the 12-month period ending in March 2020. This report is published quarterly.
This Week’s Economic Data
Links take you to the data source
Existing Home Sales – Released 7/22/2021 – Existing home sales increased in June ending four consecutive months of declines. Sales increased 1.4% to a seasonally adjusted rate of 5.86 million in June. Sales are currently up 22.9% from one year ago. Housing inventory sits at 1.25 million units. Up 3.3% from May’s inventory. Down 18.8% over last year. Unsold inventory sits at a 2.6-month supply. The median existing home price for all housing types was $363,300.
Housing Starts – Released 7/20/2021 – New home starts in June were at a seasonally adjusted annual rate of 1.643 million; up 6.3% above May, and 29.1% above last June’s rate. Building Permits were at a seasonally adjusted annual rate of 1.598 million, down 5.1% compared to May, but up 23.3% over last year.
Recent Economic Data
Links take you to the data source
Retail Sales – Released 7/16/2021 – U.S. retail sales for June increased 0.6% to $621.3 billion and retail sales are 18.0% above June 2020. U.S. retail sales are up 31.5% year/y.
Industrial Production and Capacity Utilization – Released 7/15/2021 – In June Industrial production increased 0.4%. Manufacturing declined 0.1%. Mining increased 1.4%. Utilities output increased 2.7%. Total industrial production was 9.8% higher in June than a year ago, but still 1.2% below its pre-pandemic level. Total capacity utilization increased 0.3% to 75.4% in June which is 4.2% below its long run average.
Producer Price Index – Released 7/14/2021 – The Producer Price Index for final demand increased 1.0% in June. PPI less food and energy increased 1.0% in June.
Consumer Price Index – Released 7/13/2021 – Consumer prices rose 0.9% m/m in June following a 0.64% gain in May. This marks the largest 1 month increase in CPI since June 2008 when CPI increased 1.0%. Core consumer prices increased 0.9% m/m in June following a 0.7% gain in May. Headline prices were up 5.4% y/y, the biggest increase since August 2008. Core prices were up 4.5% y/y, the biggest increase since November 1991.
Consumer Credit – Released 7/8/2021 – Consumer credit increased at a seasonally adjusted annual rate of 10.0 percent in May. Revolving credit increased at an annual rate of 11.4 percent, while nonrevolving credit increased at an annual rate of 9.5 percent.
PMI Non-Manufacturing Index – Released 7/6/2021 – Economic activity in the non-manufacturing sector grew in June for the 13th consecutive month. ISM Non-Manufacturing registered 60.1 percent, which is 3.9 percentage points below the adjusted May reading of 64.0 percent.
US Light Vehicle Sales – Released 7/2/2021 – U.S. light vehicle sales were at a seasonally adjusted annual rate (SAAR) of 15.365 million units in June.
U.S. Trade Balance – Released 7/2/2021 – According to the U.S. Census Bureau of Economic Analysis the goods and services deficit increased in May by $2.2 billion to $71.2 billion. May exports were $206.0 billion, $1.3 billion more than April exports. May imports were $277.3 billion, $3.5 billion more than April imports. Year to date the goods and services deficit increased $110.9 billion or 45.8%, from the same period in 2020. Year to date exports and imports increased $101.6 billion or 11.4% and increased $212.5 billion or 18.7% respectively.
PMI Manufacturing Index – Released 7/1/2021 – June PMI declined 0.6% to 60.6% down from May’s reading of 61.2%. The New Orders Index was down 1.0% from May’s reading of 67.0% to 66.0%. The Production Index registered 60.8%, up 2.3%.
U.S. Construction Spending – Released 7/1/2021 – Construction spending declined 0.3% in May measuring at a seasonally adjusted annual rate of $1,545.3 billion. The May figure is 7.5% above the May 2020 estimate. Private construction spending was 0.3% below the revised April estimate at $1,203.3 billion. Public construction spending was 0.2% below the revised April estimate at $342.0 billion.
Chicago PMI – Released 6/30/2021 – Chicago PMI declined to a four-month low at 66.1 points in June. This marks 12 consecutive month above the 50-mark following a full year under it. Among the main five indicators, Order Backlogs saw the largest decline, with Supplier Deliveries posting the only gain.
Consumer Confidence – Released 6/29/2021 – The Consumer confidence index increased 6.1% in June marking four consecutive months of increases. The Index now shows its highest reading in a year of 127.3, up from 120.0 in May.
Personal Income – Released 6/25/2021 – Personal income decreased $414.3 billion or 2.0 percent in May according to estimates released today by the Bureau of Economic Analysis. Disposable personal income (DPI) decreased $436.3 billion or 2.3 percent and personal consumption expenditures (PCE) increased $2.9 billion or 0.1 percent.
Third Estimate of 1st Quarter 2021 GDP – Released 6/24/2021 – Real gross domestic product (GDP) increased at an annual rate of 6.4 percent in the first quarter of 2021, according to the third estimate released by the Bureau of Economic Analysis. The fourth quarter of 2020 saw an increase of 4.3 percent in real GDP. The increase in real GDP in the first quarter reflected increases in personal consumption expenditures (PCE), nonresidential fixed investment, federal government spending, residential fixed investment, and state and local government spending that were partly offset by decreases in private inventory investment and exports. Imports, which are a subtraction in the calculation of GDP, increased. The second estimate is based on more complete source data than were available for the “advance” estimate issued last month. In the advance estimate, the increase in real GDP was also 6.4 percent. Upward revisions to consumer spending and nonresidential fixed investment were offset by downward revisions to exports and private inventory investment. Imports, which are a subtraction in the calculation of GDP, were revised up. The third estimate of GDP released today is based on more complete source data than were available for the second estimate issued last month. In the second estimate, the increase in real GDP was also 6.4 percent. Upward revisions to nonresidential fixed investment, private inventory investment, and exports were offset by an upward revision to imports, which are a subtraction in the calculation of GDP.
Durable Goods – Released 6/24/2021 – New orders for manufactured durable goods in May increased $5.7 billion or 2.3% to $253.3 billion. Transportation equipment led the increase rising $5.2 billion or 7.6% to $74.2 billion.
New Residential Sales – Released 6/23/2021 – Sales of new single-family homes decreased 5.9% to 817,000, seasonally adjusted, in May. The median sales price of new homes sold in May was $374,400 with an average sales price of $430,600. At the end of May, the seasonally adjusted estimate of new homes for sale was 330k. This represents a supply of 5.1 months at the current sales rate.
Next week we get data on New Residential Sales, Durable Goods, Consumer Confidence, Personal Income, Chicago PMI, the Advance Estimate of 2nd Quarter 2021 GDP, and the Employment Cost Index.
Data Sources:
Bureau of Economic Analysis (BEA)
Congressional Budget Office (CBO)
U.S. Bureau of Labor Statistics (BLS)
Federal Reserve Economic Data (FRED Charts)
CME Fed Watch
U.S. Treasury – Yields
U.S. Census Bureau
Institute for Supply Management (ISM)
Weekly DOL Employment Data
BLS Monthly Jobs Report
JOLTS
US Energy Admin (EIA)
BLS Consumer Price Index CPI
BLS Producer Price Index PPI
Atlanta Fed GDPNOW
NY Fed Nowcast GDP
US Census Bureau Housing Starts
Consumer Credit
USCB Retail Sales
Construction Spending
Federal Reserve Dot Plots
NY Empire Index
Philadelphia Federal Reserve
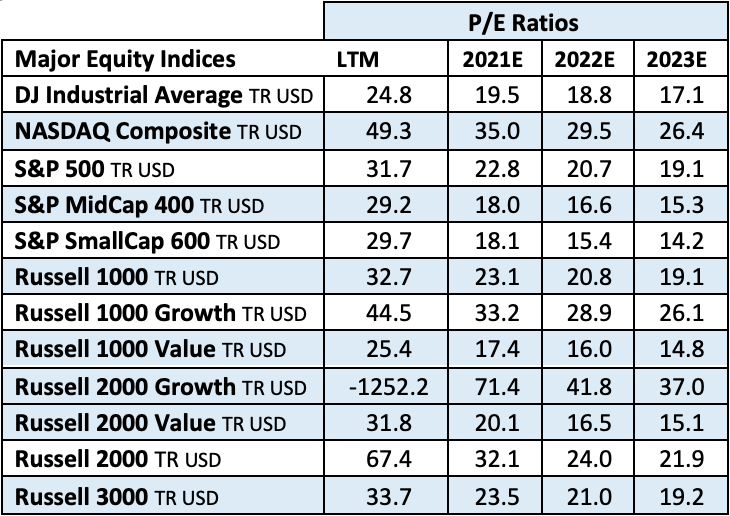
P/E Ratio Data -Yardeni Research
Technical Analysis Info:
StockCharts.com – Financial Charts
Exponential vs Simple moving average
Other Links:
1973 Arab Oil Embargo
Hunt Brothers Silver
Long-Term Capital bailout


Week 29 Talking Points
Good Life Advisors – Talking Points – Week 29
40 New S&P Highs This Year
New Covid-19 infections continued to rise globally this week with the focus on the spread of the Delta variant. Concerns about the related risks to the global economic recovery were cited as big driver of the selloff in stocks on Monday with the Dow dropping over 900 points intra-day. However, the narrative seemed to quickly spin to the notion that such worries were overdone. Goldman Sachs has highlighted strong vaccine protection against hospitalizations, elevated elderly vaccination rates, higher natural immunity and a lower virus sensitivity of GDP. BofA noted that there is little evidence of the variant significantly affecting economic activity or spending on services, It pointed out that air travel, movie-going and dining out have all continued to increase. Companies in some of the epicenter industries, including the airlines, confirmed this dynamic on their Q2 conference calls this week. The WSJ also discussed how rather than reinstituting rules and restrictions like mask mandates and business and public space closures, local authorities in hot spots around the US are instead looking to curb the spread of the Delta variant by boosting stagnating vaccination rates.
Earnings and revenue beat rates running at record levels. According to FactSet’s latest Earnings Insight report, the blended growth rate for Q2 S&P 500 earnings is 74.2%, up more than 11pp from the end of the quarter, while the blended revenue growth rate is 20.9%. With nearly a quarter of the index having reported, 88% have surpassed consensus EPS expectations, ahead of the one- and five-year averages of 83% and 75%, respectively, and on track for the best performance since FactSet began tracking the metric in 2008. In addition, 86% have beaten consensus revenue expectations, ahead of the one- and five-year averages of 74% and 65%, respectively, and on track for the best performance since FactSet began tracking the metric in 2008. In aggregate, companies are reporting earnings 19% above expectations, better than the 7.8% five-year average, and on the heels of the record 23% positive surprise rate in Q1. In aggregate, companies are reporting revenues 4% above expectations, better than the five-year average positive surprise rate of 1.2%. The report also pointed out that the blended net profit margin for the S&P 500 stands at 12.4%, better than the five-year average of 10.8%.
A bipartisan infrastructure deal may actually get done. As widely expected, Senate Republicans rejected a procedural vote this week to advance the $1.2T bipartisan infrastructure legislation. Republicans argued that they could not support the measure given that the framework has not been finalized. Pay-fors remained the big stumbling block as negotiators scrapped a GOP-criticized provision to step up tax enforcement. However, there appeared to be a path forward late in the week with an agreement to delay a Trump-era Medicare regulation. The move, which eliminates rebates drug companies give benefit managers in Medicare Part D, will cut Medicare spending by about $177B over a decade. A deal could be finalized as soon as Monday though the House could still be a problem given Pelosi’s insistence that Senate Democrats also commit to a separate $3.5T reconciliation bill.
The debt ceiling started to receive some heightened attention as a headline risk for the market this week. The two-year suspension enacted by Congress in 2019 expires at the end of July. Senate Minority Leader McConnell told Punchbowl News that he does not expect a single Republican vote to raise the debt ceiling, while Democrats quickly rejected any attempt by Republicans to set conditions for another reprieve.
Table of Contents
Fixed Income
4/28/21 FOMC Statement FOMC Minutes Credit, Liquidity and Balance Sheet Federal Reserve Dot Plots US Corporate Debt Tops 7 Trillion Treasury.gov yields FOMC Policy Normalization Statement Longer Run Goals August 2020
Global Bond Yields
Daily US Treasury Yields
Foreign Exchange Market
Energy Complex
The Baker Hughes rig count increased by 7 this week. There are 491 oil and gas rigs operating in the US – Up 240 over last year.
Metals Complex
Employment Picture
Weekly Unemployment Claims – Released Thursday 7/22/2021 – Initial jobless claims for the week ending July 17th increased 51k to 419k. The 4-week moving average was 385k, an increase of 750.
Job Openings & Labor Turnover Survey JOLTS – Released 7/7/2021 – The U.S. Bureau of Labor Statistics reported the number and rate of job openings was little changed at 9.2 million on the last business day of May. Over the month, hires were little changed at 5.9 million and separations decreased to 5.3 million. Within separations, the quits rate decreased to 2.5%. The layoffs and discharges rates decreased to 0.9%.
June Jobs Report – BLS Summary – Released 7/2/2021 – The US Economy added 850k nonfarm jobs in June and the Unemployment rate was little changed 5.9%. Average hourly earnings increased by 10 cents to $30.40. Hiring highlights include +343k Leisure and Hospitality, +72k Professional and Business Services, and +188k Government.
Employment Cost Index – Released 4/30/2021 – Compensation costs for civilian workers increased 0.9% for the 3-month period ending in March 2021. The 12-month period ending in March 2021 saw compensation costs increase by 2.6%. The 12-month period ending March 2020 increased 2.8%. Wages and salaries increased 2.7 percent over the year and increased 3.1 percent for the 12-month period ending in March 2020. Benefit costs increased 2.5 percent over the year and increased 2.1 percent for the 12-month period ending in March 2020. This report is published quarterly.
This Week’s Economic Data
Links take you to the data source
Existing Home Sales – Released 7/22/2021 – Existing home sales increased in June ending four consecutive months of declines. Sales increased 1.4% to a seasonally adjusted rate of 5.86 million in June. Sales are currently up 22.9% from one year ago. Housing inventory sits at 1.25 million units. Up 3.3% from May’s inventory. Down 18.8% over last year. Unsold inventory sits at a 2.6-month supply. The median existing home price for all housing types was $363,300.
Housing Starts – Released 7/20/2021 – New home starts in June were at a seasonally adjusted annual rate of 1.643 million; up 6.3% above May, and 29.1% above last June’s rate. Building Permits were at a seasonally adjusted annual rate of 1.598 million, down 5.1% compared to May, but up 23.3% over last year.
Recent Economic Data
Links take you to the data source
Retail Sales – Released 7/16/2021 – U.S. retail sales for June increased 0.6% to $621.3 billion and retail sales are 18.0% above June 2020. U.S. retail sales are up 31.5% year/y.
Industrial Production and Capacity Utilization – Released 7/15/2021 – In June Industrial production increased 0.4%. Manufacturing declined 0.1%. Mining increased 1.4%. Utilities output increased 2.7%. Total industrial production was 9.8% higher in June than a year ago, but still 1.2% below its pre-pandemic level. Total capacity utilization increased 0.3% to 75.4% in June which is 4.2% below its long run average.
Producer Price Index – Released 7/14/2021 – The Producer Price Index for final demand increased 1.0% in June. PPI less food and energy increased 1.0% in June.
Consumer Price Index – Released 7/13/2021 – Consumer prices rose 0.9% m/m in June following a 0.64% gain in May. This marks the largest 1 month increase in CPI since June 2008 when CPI increased 1.0%. Core consumer prices increased 0.9% m/m in June following a 0.7% gain in May. Headline prices were up 5.4% y/y, the biggest increase since August 2008. Core prices were up 4.5% y/y, the biggest increase since November 1991.
Consumer Credit – Released 7/8/2021 – Consumer credit increased at a seasonally adjusted annual rate of 10.0 percent in May. Revolving credit increased at an annual rate of 11.4 percent, while nonrevolving credit increased at an annual rate of 9.5 percent.
PMI Non-Manufacturing Index – Released 7/6/2021 – Economic activity in the non-manufacturing sector grew in June for the 13th consecutive month. ISM Non-Manufacturing registered 60.1 percent, which is 3.9 percentage points below the adjusted May reading of 64.0 percent.
US Light Vehicle Sales – Released 7/2/2021 – U.S. light vehicle sales were at a seasonally adjusted annual rate (SAAR) of 15.365 million units in June.
U.S. Trade Balance – Released 7/2/2021 – According to the U.S. Census Bureau of Economic Analysis the goods and services deficit increased in May by $2.2 billion to $71.2 billion. May exports were $206.0 billion, $1.3 billion more than April exports. May imports were $277.3 billion, $3.5 billion more than April imports. Year to date the goods and services deficit increased $110.9 billion or 45.8%, from the same period in 2020. Year to date exports and imports increased $101.6 billion or 11.4% and increased $212.5 billion or 18.7% respectively.
PMI Manufacturing Index – Released 7/1/2021 – June PMI declined 0.6% to 60.6% down from May’s reading of 61.2%. The New Orders Index was down 1.0% from May’s reading of 67.0% to 66.0%. The Production Index registered 60.8%, up 2.3%.
U.S. Construction Spending – Released 7/1/2021 – Construction spending declined 0.3% in May measuring at a seasonally adjusted annual rate of $1,545.3 billion. The May figure is 7.5% above the May 2020 estimate. Private construction spending was 0.3% below the revised April estimate at $1,203.3 billion. Public construction spending was 0.2% below the revised April estimate at $342.0 billion.
Chicago PMI – Released 6/30/2021 – Chicago PMI declined to a four-month low at 66.1 points in June. This marks 12 consecutive month above the 50-mark following a full year under it. Among the main five indicators, Order Backlogs saw the largest decline, with Supplier Deliveries posting the only gain.
Consumer Confidence – Released 6/29/2021 – The Consumer confidence index increased 6.1% in June marking four consecutive months of increases. The Index now shows its highest reading in a year of 127.3, up from 120.0 in May.
Personal Income – Released 6/25/2021 – Personal income decreased $414.3 billion or 2.0 percent in May according to estimates released today by the Bureau of Economic Analysis. Disposable personal income (DPI) decreased $436.3 billion or 2.3 percent and personal consumption expenditures (PCE) increased $2.9 billion or 0.1 percent.
Third Estimate of 1st Quarter 2021 GDP – Released 6/24/2021 – Real gross domestic product (GDP) increased at an annual rate of 6.4 percent in the first quarter of 2021, according to the third estimate released by the Bureau of Economic Analysis. The fourth quarter of 2020 saw an increase of 4.3 percent in real GDP. The increase in real GDP in the first quarter reflected increases in personal consumption expenditures (PCE), nonresidential fixed investment, federal government spending, residential fixed investment, and state and local government spending that were partly offset by decreases in private inventory investment and exports. Imports, which are a subtraction in the calculation of GDP, increased. The second estimate is based on more complete source data than were available for the “advance” estimate issued last month. In the advance estimate, the increase in real GDP was also 6.4 percent. Upward revisions to consumer spending and nonresidential fixed investment were offset by downward revisions to exports and private inventory investment. Imports, which are a subtraction in the calculation of GDP, were revised up. The third estimate of GDP released today is based on more complete source data than were available for the second estimate issued last month. In the second estimate, the increase in real GDP was also 6.4 percent. Upward revisions to nonresidential fixed investment, private inventory investment, and exports were offset by an upward revision to imports, which are a subtraction in the calculation of GDP.
Durable Goods – Released 6/24/2021 – New orders for manufactured durable goods in May increased $5.7 billion or 2.3% to $253.3 billion. Transportation equipment led the increase rising $5.2 billion or 7.6% to $74.2 billion.
New Residential Sales – Released 6/23/2021 – Sales of new single-family homes decreased 5.9% to 817,000, seasonally adjusted, in May. The median sales price of new homes sold in May was $374,400 with an average sales price of $430,600. At the end of May, the seasonally adjusted estimate of new homes for sale was 330k. This represents a supply of 5.1 months at the current sales rate.
Next week we get data on New Residential Sales, Durable Goods, Consumer Confidence, Personal Income, Chicago PMI, the Advance Estimate of 2nd Quarter 2021 GDP, and the Employment Cost Index.
Data Sources:
Bureau of Economic Analysis (BEA)
Congressional Budget Office (CBO)
U.S. Bureau of Labor Statistics (BLS)
Federal Reserve Economic Data (FRED Charts)
CME Fed Watch
U.S. Treasury – Yields
U.S. Census Bureau
Institute for Supply Management (ISM)
Weekly DOL Employment Data
BLS Monthly Jobs Report
JOLTS
US Energy Admin (EIA)
BLS Consumer Price Index CPI
BLS Producer Price Index PPI
Atlanta Fed GDPNOW
NY Fed Nowcast GDP
US Census Bureau Housing Starts
Consumer Credit
USCB Retail Sales
Construction Spending
Federal Reserve Dot Plots
NY Empire Index
Philadelphia Federal Reserve
P/E Ratio Data -Yardeni Research
Technical Analysis Info:
StockCharts.com – Financial Charts
Exponential vs Simple moving average
Other Links:
1973 Arab Oil Embargo
Hunt Brothers Silver
Long-Term Capital bailout
Categories:
Tags: