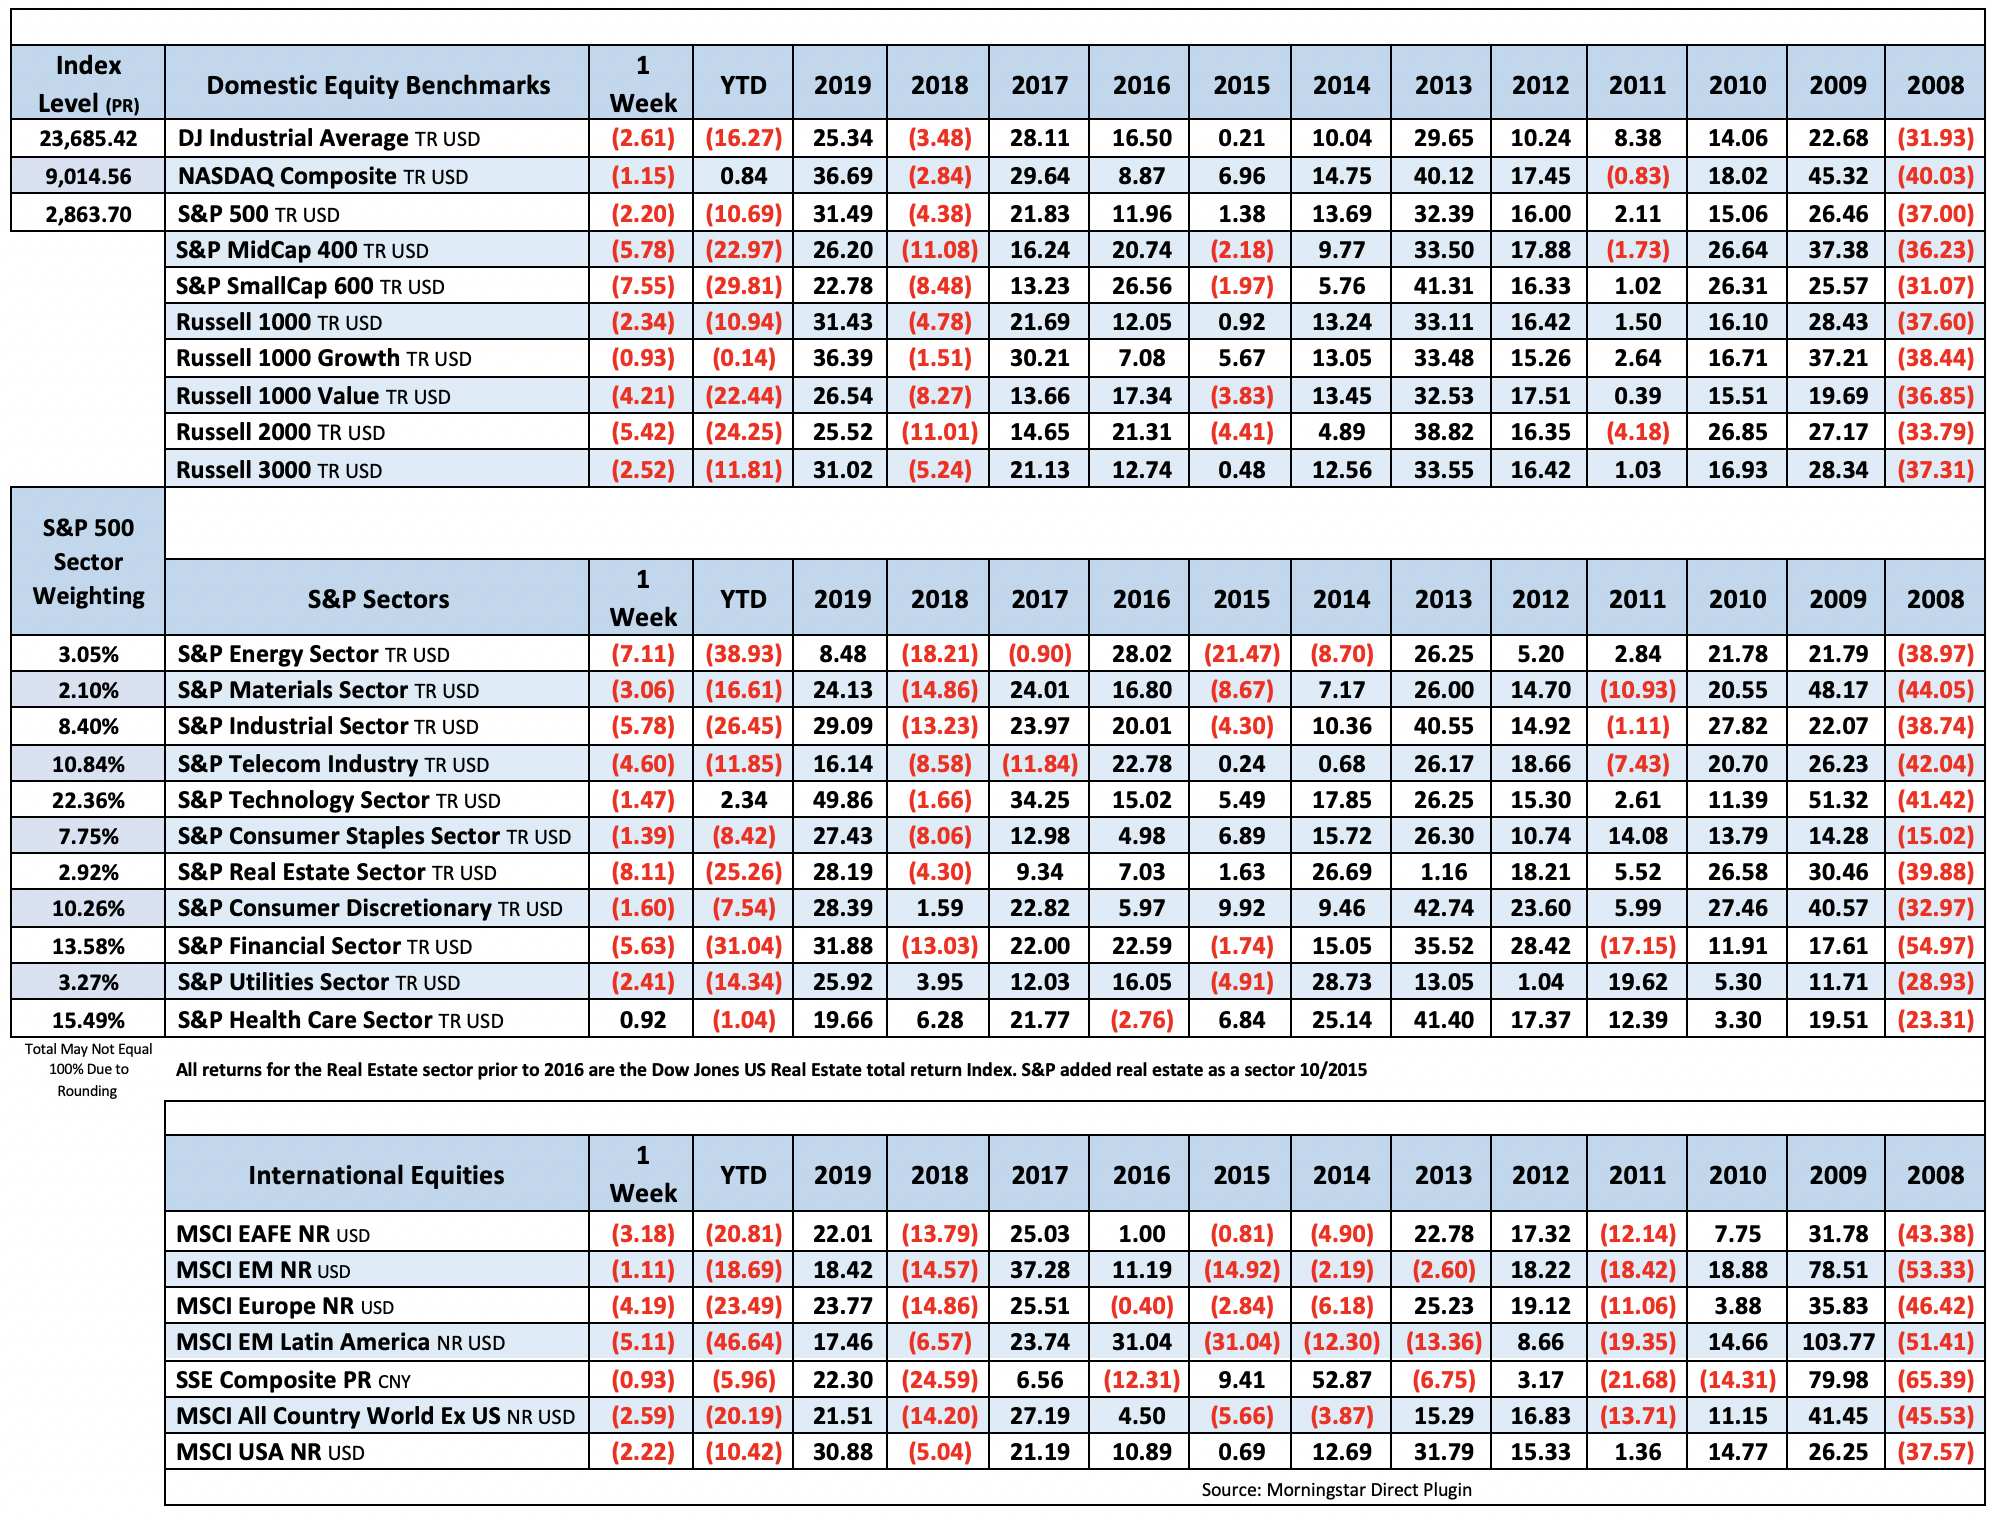
Equity markets closed lower this week, as valuation concerns and U.S.-China tensions weighed on stocks. Mid and Small-caps underperformed with steep declines (5.7% and 7.5%), followed by more modest losses in the Dow (-2.7%), S&P500 (-2.3%), and Nasdaq (-1.2%). The weakest sectors were energy (-7.1%), real estate (-8.1%), industrials (-5.8%), and financials (-5.6%). Energy was among the worst performers even though oil saw big gains jumping 18.8% (WTI). U.S.-China tensions are back on the radar this week fueled by the Trump administration moving to block semiconductor shipments to Huawei; China is reportedly mulling retaliation. It also was confirmed that China-backed hackers have been targeting U.S. organizations conducting COVID-19.
Unemployment claims continued in the millions this week as initial claims were 2,981,000. That brings the total since COVID to 36 million. Pre-COVID there were 152 million people employed in the US. Also spooking markets this week was the Federal Reserve Chairman, who took to the airwaves Wednesday and said the economic outlook remained highly uncertain and subject to significant downside risks, adding that a recovery may take some time to gather momentum. He reiterated his cautiousness Sunday night in a 60 Minutes interview saying, “The economy will recover. It may take a while…. It could stretch through the end of next year. We really don’t know.” Mr. Powell also cautioned that the public would need to stay vigilant to avoid a second wave of infections. “That would be quite damaging to the economy and also to public confidence,” he said. “That’s a risk we really want to avoid.”

Fixed Income
3/15/2020 Statement
FOMC December Statement Federal Reserve Dot Plots US Debt Measurement US Corporate Debt Tops $6 Trillion Treasury.gov yields
FOMC Policy Normalization Statement
Global Bond Yields
The Fed has been busy buying back all sorts of assets during COVID-19. The total fed holdings are just under seven trillion this week.
We can add the United Kingdom to the negative interest rate club.
Daily US Treasury Yields
Foreign Exchange Market
Energy Complex
The Baker Hughes rig count was down 35 this week. There are 339 oil and gas rigs operating in the US – down 648 over last year.
- Brent Crude Oil gained 4.94% this week closing at $32.50/bbl
- WTI Crude Oil gained 12.80% this week to close at $29.52/bbl
- Heating Oil gained 2.35% this week closing at $0.92/gallon
- Natural Gas lost 9.71% this week closing at $1.65 per million BTUs
- Unleaded Gas gained 3.32% this week closing at $0.98/ gallon
Metals Complex
- Gold gained 2.47% this week closing at $1756.30/oz
- Silver gained 8.19% on the week closing at $17.07/oz
- Palladium gained 2.02% this week closing at $1857.90/oz
- Platinum gained 3.52% this week closing at $817.10/oz
- Copper declined 3.14% this week closing at $2.33/lb
Employment Picture
Job Openings & Labor Turnover Survey JOLTS – Released 5/15/2020 – The U.S. Bureau of Labor Statistics reported the number and rate of job openings declined to 6.2 million on the last business day of March. Over the month, hires declined to 5.2 million and separations increased by 8.9 million to 14.5 million. Within separations, the quits rate declined to 1.8%. The layoffs and discharges rates increased to 7.5%.
Weekly Unemployment Claims – Released Thursday 5/14/2020 – In the week ending May 9th, initial claims were 2,981,000, a decrease of 195,000 from the previous week’s revised level. The 4-week moving average was 3,616,500 a decrease of 564,000 from the previous week’s revised average.
April Jobs Report – BLS Summary – Released 5/8/2020 – The US Economy lost 20.5 million nonfarm jobs in April and the Unemployment rate increased to 14.7%. Average hourly earnings increased by $1.34. Hiring highlights include Leisure and Hospitality -7.7 million, Education and Health Services -2.5 million, Retail Trade -2.1 million, Manufacturing -1.3 million.
- Average hourly earnings increased by $1.34 in April to $30.01.
- U3 unemployment rate increased to 14.7%. U6 unemployment rate increased to 22.8%.
- The labor force participation rate declined by 2.5% to 60.2%.
- Average workweek increased by 0.1 hours to 34.2 hours.
Employment Cost Index – Released 4/30/2020 – Compensation costs for civilian workers increased 0.8% for the 3-month period ending in March 2020. The 12 month period ending on March 2020 saw compensation costs increase by 2.8%, same as the 12 month period ending March 2019. Wages and salaries increased 3.1 percent over the year and increased 2.9 percent for the 12-month period ending in March 2019. Benefit costs increased 2.1 percent for the 12-month period ending in March 2020. In March 2019, the increase was 2.6 percent. This report is published quarterly.
This Week’s Economic Data
Links take you to the data source
Industrial Production and Capacity Utilization – Released 5/15 – In April Industrial production declined 11.2%. Manufacturing declined 13.7%, its largest decline on record. The output of motor vehicles and parts is down more than 70 percent. Industrial production was 92.6% of its 2012 average which is 15.0% lower than a year ago. Total capacity utilization declined 8.3% to 64.9% in April which is 14.9% below its long run average.
Retail Sales – Released 5/15 – U.S. retail sales for April declined 16.4% to $403.9 billion. U.S. retail sales are down 21.6% year/y.
Producer Price Index – Released 5/13 – The Producer Price Index for final demand declined 1.3% in April. Core PPI was down 0.4%. Year over year the index for final demand declined 1.2%.
Consumer Price Index – Released 5/12 – The Consumer Price Index declined 0.8% in April. Core CPI, which excludes food and energy declined 0.4%. The monthly changes left total CPI up 0.3% year-over-year and core CPI up 1.4%.
Recent Economic Data
Links take you to the data source
Consumer Credit – Released 5/7 – Consumer credit increased at a seasonally adjusted annual rate of 1.75% in March. Revolving and nonrevolving credit decreased at annual rates of 10.25% and increased 6.0% respectively. Total Outstanding consumer credit is currently at $4.2093 trillion.
PMI Non-Manufacturing Index (ISM Services) – Released 5/5 – Economic activity in the non-manufacturing sector contracted in April for the first time since December 2009 ending 122 months of growth. ISM Non-Manufacturing registered 41.8 percent, which is 10.7 percentage points below the adjusted March reading of 52.5 percent. This represents contraction in the non-manufacturing sector and marks the lowest reading since March 2009.
U.S. Trade Balance – Released 5/5 – According to the U.S. Census Bureau of Economic Analysis, the goods and services deficit increased in March $4.6 billion to $44.4 billion. March exports were $187.7 billion, $20.0 billion less than February exports. March imports were $232.2 billion, $15.4 billion less than February imports. The goods and services deficit decreased $28.1 billion or 17.8% year/y. Year – over – year exports and imports decreased $21.7 billion or 3.5% and decreased $49.7 billion or 6.4% respectively.
PMI Manufacturing ISM Index – Released 5/1 – April PMI declined 7.6% to 41.5% from March’s reading of 49.1%. The New Orders Index was down 15.1% from March’s reading of 42.2% to 27.1%. The Production Index registered 27.5%, down 20.2%.
U.S. Construction Spending – Released 5/1 – Construction spending increased 0.9% in March measuring at a seasonally adjusted annual rate of $1,360.5billion. The March figure is 4.7% above the March 2019 estimate. Private construction spending was 0.7% above the revised February estimate at $1,005.8 billion. Public construction spending was 1.6% above the revised February estimate at $348.0 billion.
Chicago PMI – Released 4/30 – Chicago PMI declined 12.4 points decreasing to 35.4, marking nine consecutive months in contraction and the lowest level since March 2009.
Personal Income – Released 4/30 – Personal income decreased $382.1 billion 2.0 percent in March according to estimates released today by the Bureau of Economic Analysis. Disposable personal income (DPI) decreased $334.6 billion 2.0 percent and personal consumption expenditures (PCE) decreased $1,127.3 billion 7.5 percent.
Advance Estimate of 1st Quarter 2020 GDP – Released 4/29 – Real gross domestic product (GDP) decreased at an annual rate of 4.8 percent in the first quarter of 2020, according to the “advance” estimate released by the Bureau of Economic Analysis. In the fourth quarter of 2019, real GDP increased 2.1 percent. The decrease in real GDP in the first quarter reflected negative contributions from personal consumption expenditures (PCE), nonresidential fixed investment, exports, and private inventory investment that were partly offset by positive contributions from residential fixed investment, federal government spending, and state and local government spending.
Consumer Confidence – Released 4/28 – The Consumer confidence index declined sharply in April following a decline in March. The Index now shows a reading of 86.9 which is down from 118.8 in March.
Durable Goods – Released 4/24 – New orders for manufactured durable goods decreased $36.0 billion or 14.4% in March. Down following three months of increase.
New Residential Sales – Released 4/24 – Sales of new single-family homes declined 15.4% to 627k, seasonally adjusted, in March. The median sales price of new homes sold in March was $321,400 with an average sales price of $375,300. At the end of March, the seasonally adjusted estimate of new homes for sale was 333k. This represents a supply of 6.4 months at the current sales rate.
Existing Home Sales – Released 4/21 – Existing home sales decline in March. Sales declined 8.5% to a seasonally adjusted rate of 5.27 million. Sales are currently up 0.8% from one year ago. Housing inventory sits at 1.50 million units. Up 2.7% over last month. Down 10.2% over last year. Unsold inventory sits at a 3.4 month supply.
Housing Starts – Released 4/16 – New home starts in March were at a seasonally adjusted annual rate of 1.216 million; down 22.3% below February but 1.4% above last March’s rate. Building Permits were at a seasonally adjusted annual rate of 1.353 million, down 6.8% compared to February and up 5.0% over last year.
US Light Vehicle Sales – Released 2/28 – U.S. light vehicle sales were at a seasonally adjusted annual rate (SAAR) of 16.81 million units in January.
Next week we get data on Housing Starts and Existing Home Sales.
Data Sources:
Bureau of Economic Analysis (BEA)
Congressional Budget Office (CBO)
U.S. Bureau of Labor Statistics (BLS)
Federal Reserve Economic Data (FRED Charts)
CME Fed Watch
U.S. Treasury – Yields
U.S. Census Bureau
Institute for Supply Management (ISM)
Weekly DOL Employment Data
BLS Monthly Jobs Report
JOLTS
US Energy Admin (EIA)
BLS Consumer Price Index CPI
BLS Producer Price Index PPI
Atlanta Fed GDPNOW
NY Fed Nowcast GDP
US Census Bureau Housing Starts
Consumer Credit
USCB Retail Sales
Construction Spending
Federal Reserve Dot Plots
NY Empire Index
Philadelphia Federal Reserve
P/E Ratio Data -Yardeni Research
Technical Analysis Info:
StockCharts.com – Financial Charts
Exponential vs Simple moving average
Other Links:
1973 Arab Oil Embargo
Hunt Brothers Silver
Long-Term Capital bailout


Week 20 Talking Points
Equity markets closed lower this week, as valuation concerns and U.S.-China tensions weighed on stocks. Mid and Small-caps underperformed with steep declines (5.7% and 7.5%), followed by more modest losses in the Dow (-2.7%), S&P500 (-2.3%), and Nasdaq (-1.2%). The weakest sectors were energy (-7.1%), real estate (-8.1%), industrials (-5.8%), and financials (-5.6%). Energy was among the worst performers even though oil saw big gains jumping 18.8% (WTI). U.S.-China tensions are back on the radar this week fueled by the Trump administration moving to block semiconductor shipments to Huawei; China is reportedly mulling retaliation. It also was confirmed that China-backed hackers have been targeting U.S. organizations conducting COVID-19.
Unemployment claims continued in the millions this week as initial claims were 2,981,000. That brings the total since COVID to 36 million. Pre-COVID there were 152 million people employed in the US. Also spooking markets this week was the Federal Reserve Chairman, who took to the airwaves Wednesday and said the economic outlook remained highly uncertain and subject to significant downside risks, adding that a recovery may take some time to gather momentum. He reiterated his cautiousness Sunday night in a 60 Minutes interview saying, “The economy will recover. It may take a while…. It could stretch through the end of next year. We really don’t know.” Mr. Powell also cautioned that the public would need to stay vigilant to avoid a second wave of infections. “That would be quite damaging to the economy and also to public confidence,” he said. “That’s a risk we really want to avoid.”
Table of Contents
Fixed Income
3/15/2020 Statement
FOMC December Statement Federal Reserve Dot Plots US Debt Measurement US Corporate Debt Tops $6 Trillion Treasury.gov yields
FOMC Policy Normalization Statement
Global Bond Yields
The Fed has been busy buying back all sorts of assets during COVID-19. The total fed holdings are just under seven trillion this week.
We can add the United Kingdom to the negative interest rate club.
Daily US Treasury Yields
Foreign Exchange Market
Energy Complex
The Baker Hughes rig count was down 35 this week. There are 339 oil and gas rigs operating in the US – down 648 over last year.
Metals Complex
Employment Picture
Job Openings & Labor Turnover Survey JOLTS – Released 5/15/2020 – The U.S. Bureau of Labor Statistics reported the number and rate of job openings declined to 6.2 million on the last business day of March. Over the month, hires declined to 5.2 million and separations increased by 8.9 million to 14.5 million. Within separations, the quits rate declined to 1.8%. The layoffs and discharges rates increased to 7.5%.
Weekly Unemployment Claims – Released Thursday 5/14/2020 – In the week ending May 9th, initial claims were 2,981,000, a decrease of 195,000 from the previous week’s revised level. The 4-week moving average was 3,616,500 a decrease of 564,000 from the previous week’s revised average.
April Jobs Report – BLS Summary – Released 5/8/2020 – The US Economy lost 20.5 million nonfarm jobs in April and the Unemployment rate increased to 14.7%. Average hourly earnings increased by $1.34. Hiring highlights include Leisure and Hospitality -7.7 million, Education and Health Services -2.5 million, Retail Trade -2.1 million, Manufacturing -1.3 million.
Employment Cost Index – Released 4/30/2020 – Compensation costs for civilian workers increased 0.8% for the 3-month period ending in March 2020. The 12 month period ending on March 2020 saw compensation costs increase by 2.8%, same as the 12 month period ending March 2019. Wages and salaries increased 3.1 percent over the year and increased 2.9 percent for the 12-month period ending in March 2019. Benefit costs increased 2.1 percent for the 12-month period ending in March 2020. In March 2019, the increase was 2.6 percent. This report is published quarterly.
This Week’s Economic Data
Links take you to the data source
Industrial Production and Capacity Utilization – Released 5/15 – In April Industrial production declined 11.2%. Manufacturing declined 13.7%, its largest decline on record. The output of motor vehicles and parts is down more than 70 percent. Industrial production was 92.6% of its 2012 average which is 15.0% lower than a year ago. Total capacity utilization declined 8.3% to 64.9% in April which is 14.9% below its long run average.
Retail Sales – Released 5/15 – U.S. retail sales for April declined 16.4% to $403.9 billion. U.S. retail sales are down 21.6% year/y.
Producer Price Index – Released 5/13 – The Producer Price Index for final demand declined 1.3% in April. Core PPI was down 0.4%. Year over year the index for final demand declined 1.2%.
Consumer Price Index – Released 5/12 – The Consumer Price Index declined 0.8% in April. Core CPI, which excludes food and energy declined 0.4%. The monthly changes left total CPI up 0.3% year-over-year and core CPI up 1.4%.
Recent Economic Data
Links take you to the data source
Consumer Credit – Released 5/7 – Consumer credit increased at a seasonally adjusted annual rate of 1.75% in March. Revolving and nonrevolving credit decreased at annual rates of 10.25% and increased 6.0% respectively. Total Outstanding consumer credit is currently at $4.2093 trillion.
PMI Non-Manufacturing Index (ISM Services) – Released 5/5 – Economic activity in the non-manufacturing sector contracted in April for the first time since December 2009 ending 122 months of growth. ISM Non-Manufacturing registered 41.8 percent, which is 10.7 percentage points below the adjusted March reading of 52.5 percent. This represents contraction in the non-manufacturing sector and marks the lowest reading since March 2009.
U.S. Trade Balance – Released 5/5 – According to the U.S. Census Bureau of Economic Analysis, the goods and services deficit increased in March $4.6 billion to $44.4 billion. March exports were $187.7 billion, $20.0 billion less than February exports. March imports were $232.2 billion, $15.4 billion less than February imports. The goods and services deficit decreased $28.1 billion or 17.8% year/y. Year – over – year exports and imports decreased $21.7 billion or 3.5% and decreased $49.7 billion or 6.4% respectively.
PMI Manufacturing ISM Index – Released 5/1 – April PMI declined 7.6% to 41.5% from March’s reading of 49.1%. The New Orders Index was down 15.1% from March’s reading of 42.2% to 27.1%. The Production Index registered 27.5%, down 20.2%.
U.S. Construction Spending – Released 5/1 – Construction spending increased 0.9% in March measuring at a seasonally adjusted annual rate of $1,360.5billion. The March figure is 4.7% above the March 2019 estimate. Private construction spending was 0.7% above the revised February estimate at $1,005.8 billion. Public construction spending was 1.6% above the revised February estimate at $348.0 billion.
Chicago PMI – Released 4/30 – Chicago PMI declined 12.4 points decreasing to 35.4, marking nine consecutive months in contraction and the lowest level since March 2009.
Personal Income – Released 4/30 – Personal income decreased $382.1 billion 2.0 percent in March according to estimates released today by the Bureau of Economic Analysis. Disposable personal income (DPI) decreased $334.6 billion 2.0 percent and personal consumption expenditures (PCE) decreased $1,127.3 billion 7.5 percent.
Advance Estimate of 1st Quarter 2020 GDP – Released 4/29 – Real gross domestic product (GDP) decreased at an annual rate of 4.8 percent in the first quarter of 2020, according to the “advance” estimate released by the Bureau of Economic Analysis. In the fourth quarter of 2019, real GDP increased 2.1 percent. The decrease in real GDP in the first quarter reflected negative contributions from personal consumption expenditures (PCE), nonresidential fixed investment, exports, and private inventory investment that were partly offset by positive contributions from residential fixed investment, federal government spending, and state and local government spending.
Consumer Confidence – Released 4/28 – The Consumer confidence index declined sharply in April following a decline in March. The Index now shows a reading of 86.9 which is down from 118.8 in March.
Durable Goods – Released 4/24 – New orders for manufactured durable goods decreased $36.0 billion or 14.4% in March. Down following three months of increase.
New Residential Sales – Released 4/24 – Sales of new single-family homes declined 15.4% to 627k, seasonally adjusted, in March. The median sales price of new homes sold in March was $321,400 with an average sales price of $375,300. At the end of March, the seasonally adjusted estimate of new homes for sale was 333k. This represents a supply of 6.4 months at the current sales rate.
Existing Home Sales – Released 4/21 – Existing home sales decline in March. Sales declined 8.5% to a seasonally adjusted rate of 5.27 million. Sales are currently up 0.8% from one year ago. Housing inventory sits at 1.50 million units. Up 2.7% over last month. Down 10.2% over last year. Unsold inventory sits at a 3.4 month supply.
Housing Starts – Released 4/16 – New home starts in March were at a seasonally adjusted annual rate of 1.216 million; down 22.3% below February but 1.4% above last March’s rate. Building Permits were at a seasonally adjusted annual rate of 1.353 million, down 6.8% compared to February and up 5.0% over last year.
US Light Vehicle Sales – Released 2/28 – U.S. light vehicle sales were at a seasonally adjusted annual rate (SAAR) of 16.81 million units in January.
Next week we get data on Housing Starts and Existing Home Sales.
Data Sources:
Bureau of Economic Analysis (BEA)
Congressional Budget Office (CBO)
U.S. Bureau of Labor Statistics (BLS)
Federal Reserve Economic Data (FRED Charts)
CME Fed Watch
U.S. Treasury – Yields
U.S. Census Bureau
Institute for Supply Management (ISM)
Weekly DOL Employment Data
BLS Monthly Jobs Report
JOLTS
US Energy Admin (EIA)
BLS Consumer Price Index CPI
BLS Producer Price Index PPI
Atlanta Fed GDPNOW
NY Fed Nowcast GDP
US Census Bureau Housing Starts
Consumer Credit
USCB Retail Sales
Construction Spending
Federal Reserve Dot Plots
NY Empire Index
Philadelphia Federal Reserve
P/E Ratio Data -Yardeni Research
Technical Analysis Info:
StockCharts.com – Financial Charts
Exponential vs Simple moving average
Other Links:
1973 Arab Oil Embargo
Hunt Brothers Silver
Long-Term Capital bailout
Categories:
Tags: