Good Life Advisors – Talking Points – Week 15
The End of Moore’s Law?
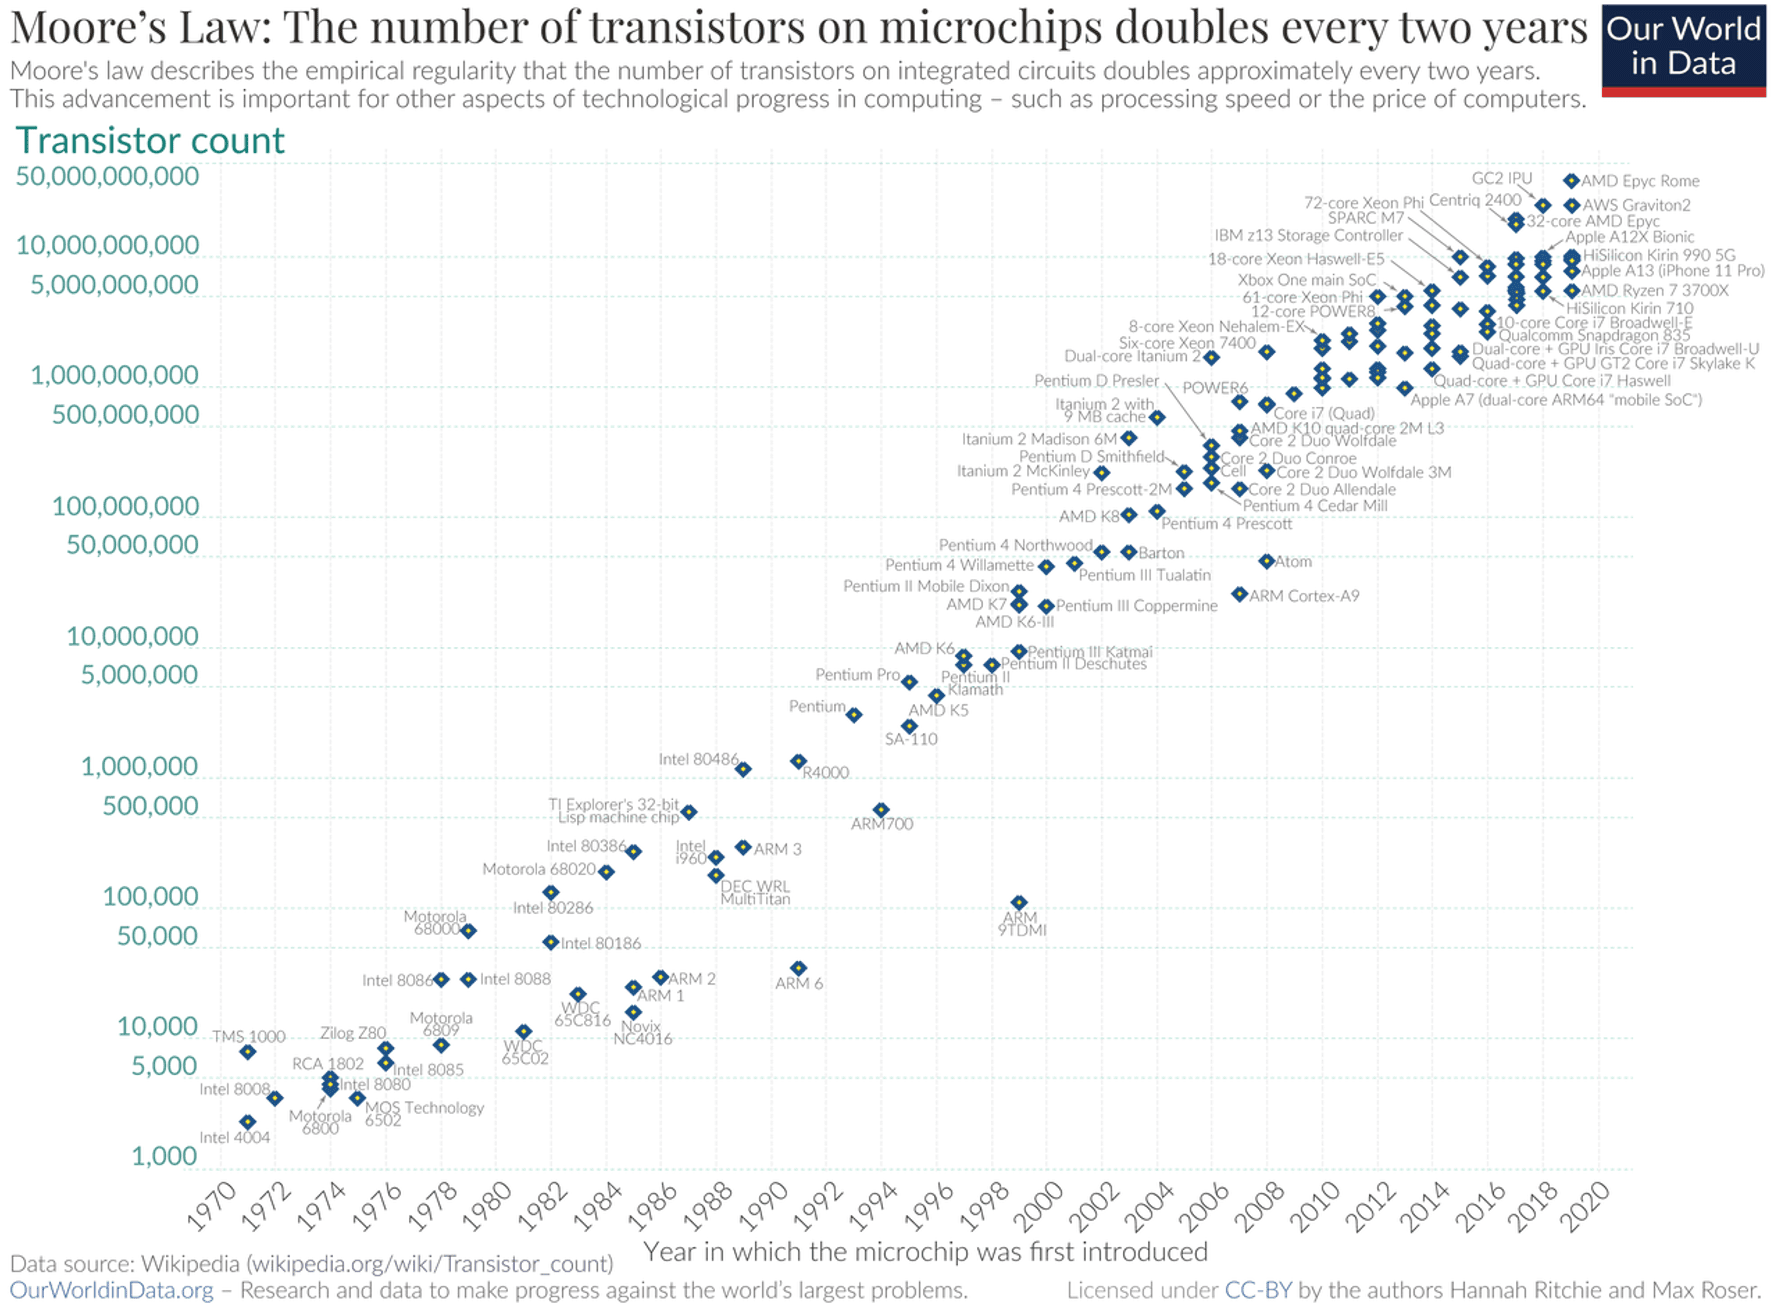
The current crop of microprocessors contain circuitry that is just three nanometers (billionth of a meter) wide. Medieval philosophers once wondered how many angels could dance on the head of a pin. Gordon Moore,wondered how many transistors could be etched on one silicon wafer to make an integrated circuit. Moore was the cofounder of Fairchild Semi and Intel. In 1965 he developed what is now known as Moore’s Law, essentially that semiconductors would double the number of transistors every two years. His prediction has held true since 1975 (the 1st 10 years they doubled every year).
Mr. Moore passed away last month at the age of 94. The first transistors he had ever encountered, in 1954 at a lecture by the man who had co-invented them, William Shockley, were as big as peanuts. But they were shrinking fast. The more you could pack together, the more these tiny marvels could do, the more computing power they contained. From 10,000 transistors in the early 70s to upwards of 50 billion today on a chip today, Moors law has continued to play out. As the circuitry nears a single, billionth of a meter, one wonder how much longer Mr. Moore’s law, will hold true.
We learned this week that progress is being made against inflation but we’ve yet to see the economic pain play out. There was a little something for the bulls and bears this week. Bulls focused on including disinflation traction after cooler-than-expected CPI and PPI prints. March headline CPI of 0.1% was less than the consensus for 0.2%, and down from February’s 0.4% print. Core CPI of 0.4% was in line with consensus, though down from last month’s 0.5%. However, the core goods category accelerated 0.2pp m/m to 0.2%, the most since August, and a reversal from the negative prints throughout Q4-22. Thursday’s March headline PPI was down 0.5% m/m, cooler than consensus for 0.1% and a second-straight monthly contraction, while PPI y/y of 2.7% was the lowest since Jan-21.
Core PPI (excluding food and energy) was down 0.1% m/m, also cooler than consensus 0.3%, while annualized core of 3.4% was the lowest since Mar-21. Bank of America economists said after CPI that this month’s shelter likely marked the start of the long-awaited moderation in rents, while they expect shelter inflation to cool more quickly in 2H-22. However, despite the cooler inflation numbers, Fedspeak mostly hit the higher-for-longer narrative as Fed officials continued to argue that inflation is still too high. Elsewhere, March retail sales were down 1.0% m/m, steeper than consensus for a 0.4% monthly decline, though takeaways noted the deterioration wasn’t enough to push the Fed off its rate path. Preliminary April Michigan Consumer Sentiment of 63.5 missed below consensus 64.0, though the big focus was on 1Y inflation expectations, which jumped 0.9pp to 4.6%, the biggest jump since 2021.
Markets finish higher for the week. Upside this week was tabbed to a few factors. Positioning also remains a key upside risk, with BofA noting investors have put $538B into cash in the past eight weeks, including $51.6B in the week to Wednesday. JPMorgan also noted bearish positioning could flip if hedge funds cut shorts and retail investors return to buying. Other bullish narratives include a well-received start to bank earnings season, banking sector stabilization, a low bar for Q1 earnings season, and pushback against credit contraction fears.
Fed updates leaned hawkish: The minutes of the March FOMC meeting showed staff projections at the time of the meeting to include a mild recession starting later this year driven by the recent banking turmoil. Many officials also said that the banking sector developments led them to lower their assessments of the fed funds rate that would be sufficiently restrictive. While the minutes said that some officials considered a pause given the banking turmoil, takeaways noted that the Fed remains committed to the higher-for-longer strategy given inflation.
Banks kick off earnings season with some well-received reports: Earnings season ramped up Friday with reports from JPM +8.8%, WFC +4.6%, and C +8.1%. Bloomberg noted results reflected better-than-expected trends in deposits, NII, and NIM, while Citigroup in particular posted one of the best FICC quarters in a decade. JPMorgan also raised FY NII from $74B to $81B after Q1 deposits unexpectedly rose and margins beat. Some also noted that provisions missed across most banks, though were better than feared. PNC -0.0%, the first regional bank to report following a volatile quarter for the group, sold off though results were helped by surprise deposit growth and NII up 28% y/y.
The S&P 500 and Nasdaq were both higher this week for the fourth week of the past five, though the major averages ended off the best weekly levels after a bit of a Friday selloff. Outperformers included cyclical groups, notably banks, investment banks, credit cards, machinery, building materials, trucking, chemicals, E&Ps, and oilfield services. Discretionary and tech were fairly mixed. Retail and homebuilders outperformed, while software and internets were in line with the broader market. However, the FANMAGs, semis, and media and entertainment near unchanged for the week. Defensives and flight-to-safety groups underperformed, including grocers, food and beverage, drug stores, and bond proxy REITs and utilities. Treasuries were weaker with the curve flattening, with the 2Y back around 4.10% and 10Y back above 3.50%. The dollar index was down 0.2%, off worst levels through a fifth-straight weekly decline, the longest streak since mid-2020. Gold finished the week down 0.5%. WTI crude was up 2.3% for the week.

Fixed Income
Yield Curve
January FOMC Statement January Fed Minutes Balance Sheet Reduction Plan Credit, Liquidity and Balance Sheet Federal Reserve Dot Plots
Treasury.gov yields FOMC Policy Normalization Statement Longer- Run Goals Jan 2022
Foreign Exchange Market
Energy Complex
The Baker Hughes rig count was down by 3 this week. There are 748 oil and gas rigs operating in the US – Up 53 over last year.
Metals Complex
Employment Picture
Weekly Unemployment Claims – Released Thursday 4/13/2023 – The week ending April 8th observed an increase of 11k in initial claims increasing to 239k. The four-week moving average of initial jobless claims was up by 2.25k to 240k.
March Jobs Report – BLS Summary – Released 4/7/2023 – The US Economy added 236k nonfarm jobs in March and the Unemployment rate was little changed at 3.5%. Average hourly earnings increased 9 cents to $33.18. Hiring highlights include +72k Leisure and Hospitality, +65k Education and Health Services, +47 Government, and +39k Professional and Business Services.
- Average hourly earnings increased 9 cents/0.3% to $33.18.
- U3 unemployment rate was little changed at 3.5%. U6 unemployment rate decreased 0.1% to 6.7%.
- The labor force participation rate was little changed at 62.6%.
- Average work week decreased by 0.1 to 34.4 hours.
Job Openings & Labor Turnover Survey JOLTS – Released 4/4/2023 – The number of job openings decreased to 9.9 million on the last business day of February, the U.S. Bureau of Labor Statistics reported. Over the month the number of hires and total separations changed little at 6.2 million and 5.8 million, respectively. Within separations, quits (4.0 million) increased and layoffs and discharges (1.5 million) decreased.
Employment Cost Index – Released 1/31/2023 – Compensation costs for civilian workers increased 1.0% for the 3-month period ending in December 2022. The 12-month period ending on December 2022 saw compensation costs increase by 5.1%. The 12-month period ending December 2021 increased 4.0%. Wages and salaries increased 5.1 percent over the year and increased 4.5 percent for the 12-month period ending in December 2021. Benefit costs increased 4.9 percent over the year and increased 2.8 percent for the 12-month period ending in December 2021. This report is published quarterly.
This Week’s Economic Data
Links take you to the data source
Industrial Production and Capacity Utilization – Released 4/14/2023 – In March Industrial production increased 0.4%. Manufacturing decreased 0.5%. Utilities output increased 8.4%. Mining output declined 0.5%. Total industrial production was 0.5% higher in March than a year ago. Total capacity utilization increased in March to 79.8% which is 0.1% above its long run average.
Retail Sales – Released 4/14/2023 – U.S. retail sales for March decreased 1.0% to $691.7 billion but retail sales are 2.9% above March 2022. U.S. retail sales for the January 2022 through March 2023 period were up 5.4% from the same period a year ago.
Producer Price Index – Released 4/13/2023 – The PPI for final demand decreased 0.5 percent in March, seasonally adjusted, the U.S. Bureau of Labor Statistics reported. Final demand prices were unchanged in February and increased 0.4 percent in January. On an unadjusted basis, the index for final demand increased 2.7 percent year over year.
Consumer Price Index – Released 4/12/2023 – Consumer prices increased 0.1% m/m in March following a 0.4% increase in February. Consumer prices are up 5.0% for the 12-month period ending in March. Core consumer prices increased 0.4% m/m in March.
Recent Economic Date
Links take you to the data source
Consumer Credit – Released 4/7/2023 – In February, consumer credit increased at a seasonally adjusted annual rate of 3.8 percent. Revolving credit increased at an annual rate of 5.0 percent, while nonrevolving credit increased at an annual rate of 3.4 percent.
U.S. Trade Balance – Released 4/5/2023 – The U.S. monthly international trade deficit increased in February 2023 according to the U.S. Bureau of Economic Analysis and the U.S. Census Bureau. The deficit increased from $68.7 billion in January (revised) to $70.5 billion in February. February exports were $251.2 billion, $6.9 billion less than January exports. February imports were $321.7 billion, $5.0 billion less than January imports. Year-to-date, the goods and services deficit decreased $35.5 billion, or 20.3 percent, from the same period in 2022. Exports increased $49.5 billion or 10.8 percent. Imports increased $14.0 billion or 2.2 percent.
PMI Non-Manufacturing Index – Released 4/5/2023 – Economic activity remained in expansionary territory in March. The Services PMI® registered 51.2 percent, 3.9 percentage points lower than February. In February, the Services PMI® registered 55.1 percent.
PMI Manufacturing Index – Released 4/3/2023 – The March Manufacturing PMI® registered 46.3 percent, 1.4 percentage point lower than the 47.7 percent recorded in February. Regarding the overall economy, this figure indicates four months of contraction following 30 months of expansion. The New Orders Index remained in contraction territory at 44.3 percent, 2.7 percentage points lower than the 47.0 percent recorded in February. The production index increased 0.5 percentage points to 47.8.
U.S. Construction Spending – Released 4/3/2023 – Construction spending during February 2023 was estimated at a seasonally adjusted annual rate of $1,844.4 billion, 0.1 percent below the revised January estimate of $1,845.4 billion. The February figure is 5.2 percent above the February 2022 estimate of $1,753.1 billion.
US Light Vehicle Sales – Released 3/31/2023 – U.S. light vehicle sales were at a seasonally adjusted annual rate (SAAR) of 14.896 million units in February.
Chicago PMI – Released 3/31/2023 – Chicago PMI remained in contraction territory but increased in March to 43.8 points up from 43.6 points in February. This marks seven months in contractionary territory.
Personal Income – Released 3/31/2023 – Personal income increased $72.9 billion, or 0.3 percent in February. Disposable Personal Income increased $89.9 billion or 0.5 percent. Personal Consumption Expenditure increased $27.9 billion or 10.2 percent.
Third Estimate of 4th Quarter 2022 GDP – Released 3/30/2023 – Real gross domestic product (GDP) increased at an annual rate of 2.6 percent in the fourth quarter of 2022 according to the third estimate released by the Bureau of Economic Analysis, following an increase of 3.2 percent in the third quarter of 2022. The second estimate saw real GDP increase 2.7% and the advance estimate saw real GDP increase by 2.9%.The GDP estimate released today is based on source data that are more complete than the advance and second estimate. The increase in real GDP reflected increases in private inventory investment, consumer spending, federal government spending, state and local government spending, and nonresidential fixed investment that were partly offset by decreases in residential fixed investment and exports. Imports, which are a subtraction in the calculation of GDP, decreased. The revision primarily reflected downward revisions to exports and consumer spending. Imports, which are a subtraction in the calculation of GDP, were revised down.
Consumer Confidence – Released 3/28/2023 – The Conference Board Consumer Confidence Index® increased in March. The Index now stands at 104.2 (1985=100), up from 103.4 in February.
Durable Goods – Released 3/24/2023 – New orders for manufactured durable goods in February decreased $2.6 billion or 1.0% to $268.4 billion. Transportation equipment led the decrease down $2.6 billion or 2.8% to $89.4 billion.
New Residential Sales – Released 3/23/2023 – Sales of new single-family homes increased 1.1% to 640k, seasonally adjusted, in February. The median sales price of new homes sold in February was $438,200 with an average sales price of $498,700. At the end of February, the seasonally adjusted estimate of new homes for sale was 436k. This represents a supply of 8.2 months at the current sales rate.
Existing Home Sales – Released 3/21/2023 – Existing home sales increased in February following twelve consecutive months of declines. Sales increased 14.5% to a seasonally adjusted rate of 4.58 million in February. Sales decreased 22.6% year-over-year. Housing inventory sits at 980k units. Identical to January’s inventory. Up 15.3% over last year. Unsold inventory sits at a 2.6-month supply. The median existing home price for all housing types was $363,000 which is down 0.2% from February 2022. February ended 131 consecutive months of year-over-year increases, the longest-running streak on record.
Housing Starts – Released 3/16/2023 – New home starts in February were at a seasonally adjusted annual rate of 1.450 million; up 9.8% above January, but 18.4% below last February’s rate. Building Permits were at a seasonally adjusted annual rate of 1.524 million, up 13.8% compared to January, but down 17.9% over last year.
Next week we get data on Housing Starts and Existing Home Sales.
Data Sources:
Bureau of Economic Analysis (BEA)
Congressional Budget Office (CBO)
U.S. Bureau of Labor Statistics (BLS)
Federal Reserve Economic Data (FRED Charts)
CME Fed Watch
U.S. Treasury – Yields
U.S. Census Bureau
Institute for Supply Management (ISM)
Weekly DOL Employment Data
BLS Monthly Jobs Report
JOLTS
US Energy Admin (EIA)
BLS Consumer Price Index CPI
BLS Producer Price Index PPI
Atlanta Fed GDPNOW
NY Fed Nowcast GDP
US Census Bureau Housing Starts
Consumer Credit
USCB Retail Sales
Construction Spending
Federal Reserve Dot Plots
NY Empire Index
Philadelphia Federal Reserve
P/E Ratio Data -Yardeni Research
Technical Analysis Info:
StockCharts.com – Financial Charts
Exponential vs Simple moving average
Other Links:
1973 Arab Oil Embargo
Hunt Brothers Silver
Long-Term Capital bailout


Week 15 Talking Points
Table of Contents
Good Life Advisors – Talking Points – Week 15
The End of Moore’s Law?
The current crop of microprocessors contain circuitry that is just three nanometers (billionth of a meter) wide. Medieval philosophers once wondered how many angels could dance on the head of a pin. Gordon Moore,wondered how many transistors could be etched on one silicon wafer to make an integrated circuit. Moore was the cofounder of Fairchild Semi and Intel. In 1965 he developed what is now known as Moore’s Law, essentially that semiconductors would double the number of transistors every two years. His prediction has held true since 1975 (the 1st 10 years they doubled every year).
Mr. Moore passed away last month at the age of 94. The first transistors he had ever encountered, in 1954 at a lecture by the man who had co-invented them, William Shockley, were as big as peanuts. But they were shrinking fast. The more you could pack together, the more these tiny marvels could do, the more computing power they contained. From 10,000 transistors in the early 70s to upwards of 50 billion today on a chip today, Moors law has continued to play out. As the circuitry nears a single, billionth of a meter, one wonder how much longer Mr. Moore’s law, will hold true.
We learned this week that progress is being made against inflation but we’ve yet to see the economic pain play out. There was a little something for the bulls and bears this week. Bulls focused on including disinflation traction after cooler-than-expected CPI and PPI prints. March headline CPI of 0.1% was less than the consensus for 0.2%, and down from February’s 0.4% print. Core CPI of 0.4% was in line with consensus, though down from last month’s 0.5%. However, the core goods category accelerated 0.2pp m/m to 0.2%, the most since August, and a reversal from the negative prints throughout Q4-22. Thursday’s March headline PPI was down 0.5% m/m, cooler than consensus for 0.1% and a second-straight monthly contraction, while PPI y/y of 2.7% was the lowest since Jan-21.
Core PPI (excluding food and energy) was down 0.1% m/m, also cooler than consensus 0.3%, while annualized core of 3.4% was the lowest since Mar-21. Bank of America economists said after CPI that this month’s shelter likely marked the start of the long-awaited moderation in rents, while they expect shelter inflation to cool more quickly in 2H-22. However, despite the cooler inflation numbers, Fedspeak mostly hit the higher-for-longer narrative as Fed officials continued to argue that inflation is still too high. Elsewhere, March retail sales were down 1.0% m/m, steeper than consensus for a 0.4% monthly decline, though takeaways noted the deterioration wasn’t enough to push the Fed off its rate path. Preliminary April Michigan Consumer Sentiment of 63.5 missed below consensus 64.0, though the big focus was on 1Y inflation expectations, which jumped 0.9pp to 4.6%, the biggest jump since 2021.
Markets finish higher for the week. Upside this week was tabbed to a few factors. Positioning also remains a key upside risk, with BofA noting investors have put $538B into cash in the past eight weeks, including $51.6B in the week to Wednesday. JPMorgan also noted bearish positioning could flip if hedge funds cut shorts and retail investors return to buying. Other bullish narratives include a well-received start to bank earnings season, banking sector stabilization, a low bar for Q1 earnings season, and pushback against credit contraction fears.
Fed updates leaned hawkish: The minutes of the March FOMC meeting showed staff projections at the time of the meeting to include a mild recession starting later this year driven by the recent banking turmoil. Many officials also said that the banking sector developments led them to lower their assessments of the fed funds rate that would be sufficiently restrictive. While the minutes said that some officials considered a pause given the banking turmoil, takeaways noted that the Fed remains committed to the higher-for-longer strategy given inflation.
Banks kick off earnings season with some well-received reports: Earnings season ramped up Friday with reports from JPM +8.8%, WFC +4.6%, and C +8.1%. Bloomberg noted results reflected better-than-expected trends in deposits, NII, and NIM, while Citigroup in particular posted one of the best FICC quarters in a decade. JPMorgan also raised FY NII from $74B to $81B after Q1 deposits unexpectedly rose and margins beat. Some also noted that provisions missed across most banks, though were better than feared. PNC -0.0%, the first regional bank to report following a volatile quarter for the group, sold off though results were helped by surprise deposit growth and NII up 28% y/y.
The S&P 500 and Nasdaq were both higher this week for the fourth week of the past five, though the major averages ended off the best weekly levels after a bit of a Friday selloff. Outperformers included cyclical groups, notably banks, investment banks, credit cards, machinery, building materials, trucking, chemicals, E&Ps, and oilfield services. Discretionary and tech were fairly mixed. Retail and homebuilders outperformed, while software and internets were in line with the broader market. However, the FANMAGs, semis, and media and entertainment near unchanged for the week. Defensives and flight-to-safety groups underperformed, including grocers, food and beverage, drug stores, and bond proxy REITs and utilities. Treasuries were weaker with the curve flattening, with the 2Y back around 4.10% and 10Y back above 3.50%. The dollar index was down 0.2%, off worst levels through a fifth-straight weekly decline, the longest streak since mid-2020. Gold finished the week down 0.5%. WTI crude was up 2.3% for the week.
Fixed Income
Yield Curve
January FOMC Statement January Fed Minutes Balance Sheet Reduction Plan Credit, Liquidity and Balance Sheet Federal Reserve Dot Plots
Treasury.gov yields FOMC Policy Normalization Statement Longer- Run Goals Jan 2022
Foreign Exchange Market
Energy Complex
The Baker Hughes rig count was down by 3 this week. There are 748 oil and gas rigs operating in the US – Up 53 over last year.
Metals Complex
Employment Picture
Weekly Unemployment Claims – Released Thursday 4/13/2023 – The week ending April 8th observed an increase of 11k in initial claims increasing to 239k. The four-week moving average of initial jobless claims was up by 2.25k to 240k.
March Jobs Report – BLS Summary – Released 4/7/2023 – The US Economy added 236k nonfarm jobs in March and the Unemployment rate was little changed at 3.5%. Average hourly earnings increased 9 cents to $33.18. Hiring highlights include +72k Leisure and Hospitality, +65k Education and Health Services, +47 Government, and +39k Professional and Business Services.
Job Openings & Labor Turnover Survey JOLTS – Released 4/4/2023 – The number of job openings decreased to 9.9 million on the last business day of February, the U.S. Bureau of Labor Statistics reported. Over the month the number of hires and total separations changed little at 6.2 million and 5.8 million, respectively. Within separations, quits (4.0 million) increased and layoffs and discharges (1.5 million) decreased.
Employment Cost Index – Released 1/31/2023 – Compensation costs for civilian workers increased 1.0% for the 3-month period ending in December 2022. The 12-month period ending on December 2022 saw compensation costs increase by 5.1%. The 12-month period ending December 2021 increased 4.0%. Wages and salaries increased 5.1 percent over the year and increased 4.5 percent for the 12-month period ending in December 2021. Benefit costs increased 4.9 percent over the year and increased 2.8 percent for the 12-month period ending in December 2021. This report is published quarterly.
This Week’s Economic Data
Links take you to the data source
Industrial Production and Capacity Utilization – Released 4/14/2023 – In March Industrial production increased 0.4%. Manufacturing decreased 0.5%. Utilities output increased 8.4%. Mining output declined 0.5%. Total industrial production was 0.5% higher in March than a year ago. Total capacity utilization increased in March to 79.8% which is 0.1% above its long run average.
Retail Sales – Released 4/14/2023 – U.S. retail sales for March decreased 1.0% to $691.7 billion but retail sales are 2.9% above March 2022. U.S. retail sales for the January 2022 through March 2023 period were up 5.4% from the same period a year ago.
Producer Price Index – Released 4/13/2023 – The PPI for final demand decreased 0.5 percent in March, seasonally adjusted, the U.S. Bureau of Labor Statistics reported. Final demand prices were unchanged in February and increased 0.4 percent in January. On an unadjusted basis, the index for final demand increased 2.7 percent year over year.
Consumer Price Index – Released 4/12/2023 – Consumer prices increased 0.1% m/m in March following a 0.4% increase in February. Consumer prices are up 5.0% for the 12-month period ending in March. Core consumer prices increased 0.4% m/m in March.
Recent Economic Date
Links take you to the data source
Consumer Credit – Released 4/7/2023 – In February, consumer credit increased at a seasonally adjusted annual rate of 3.8 percent. Revolving credit increased at an annual rate of 5.0 percent, while nonrevolving credit increased at an annual rate of 3.4 percent.
U.S. Trade Balance – Released 4/5/2023 – The U.S. monthly international trade deficit increased in February 2023 according to the U.S. Bureau of Economic Analysis and the U.S. Census Bureau. The deficit increased from $68.7 billion in January (revised) to $70.5 billion in February. February exports were $251.2 billion, $6.9 billion less than January exports. February imports were $321.7 billion, $5.0 billion less than January imports. Year-to-date, the goods and services deficit decreased $35.5 billion, or 20.3 percent, from the same period in 2022. Exports increased $49.5 billion or 10.8 percent. Imports increased $14.0 billion or 2.2 percent.
PMI Non-Manufacturing Index – Released 4/5/2023 – Economic activity remained in expansionary territory in March. The Services PMI® registered 51.2 percent, 3.9 percentage points lower than February. In February, the Services PMI® registered 55.1 percent.
PMI Manufacturing Index – Released 4/3/2023 – The March Manufacturing PMI® registered 46.3 percent, 1.4 percentage point lower than the 47.7 percent recorded in February. Regarding the overall economy, this figure indicates four months of contraction following 30 months of expansion. The New Orders Index remained in contraction territory at 44.3 percent, 2.7 percentage points lower than the 47.0 percent recorded in February. The production index increased 0.5 percentage points to 47.8.
U.S. Construction Spending – Released 4/3/2023 – Construction spending during February 2023 was estimated at a seasonally adjusted annual rate of $1,844.4 billion, 0.1 percent below the revised January estimate of $1,845.4 billion. The February figure is 5.2 percent above the February 2022 estimate of $1,753.1 billion.
US Light Vehicle Sales – Released 3/31/2023 – U.S. light vehicle sales were at a seasonally adjusted annual rate (SAAR) of 14.896 million units in February.
Chicago PMI – Released 3/31/2023 – Chicago PMI remained in contraction territory but increased in March to 43.8 points up from 43.6 points in February. This marks seven months in contractionary territory.
Personal Income – Released 3/31/2023 – Personal income increased $72.9 billion, or 0.3 percent in February. Disposable Personal Income increased $89.9 billion or 0.5 percent. Personal Consumption Expenditure increased $27.9 billion or 10.2 percent.
Third Estimate of 4th Quarter 2022 GDP – Released 3/30/2023 – Real gross domestic product (GDP) increased at an annual rate of 2.6 percent in the fourth quarter of 2022 according to the third estimate released by the Bureau of Economic Analysis, following an increase of 3.2 percent in the third quarter of 2022. The second estimate saw real GDP increase 2.7% and the advance estimate saw real GDP increase by 2.9%.The GDP estimate released today is based on source data that are more complete than the advance and second estimate. The increase in real GDP reflected increases in private inventory investment, consumer spending, federal government spending, state and local government spending, and nonresidential fixed investment that were partly offset by decreases in residential fixed investment and exports. Imports, which are a subtraction in the calculation of GDP, decreased. The revision primarily reflected downward revisions to exports and consumer spending. Imports, which are a subtraction in the calculation of GDP, were revised down.
Consumer Confidence – Released 3/28/2023 – The Conference Board Consumer Confidence Index® increased in March. The Index now stands at 104.2 (1985=100), up from 103.4 in February.
Durable Goods – Released 3/24/2023 – New orders for manufactured durable goods in February decreased $2.6 billion or 1.0% to $268.4 billion. Transportation equipment led the decrease down $2.6 billion or 2.8% to $89.4 billion.
New Residential Sales – Released 3/23/2023 – Sales of new single-family homes increased 1.1% to 640k, seasonally adjusted, in February. The median sales price of new homes sold in February was $438,200 with an average sales price of $498,700. At the end of February, the seasonally adjusted estimate of new homes for sale was 436k. This represents a supply of 8.2 months at the current sales rate.
Existing Home Sales – Released 3/21/2023 – Existing home sales increased in February following twelve consecutive months of declines. Sales increased 14.5% to a seasonally adjusted rate of 4.58 million in February. Sales decreased 22.6% year-over-year. Housing inventory sits at 980k units. Identical to January’s inventory. Up 15.3% over last year. Unsold inventory sits at a 2.6-month supply. The median existing home price for all housing types was $363,000 which is down 0.2% from February 2022. February ended 131 consecutive months of year-over-year increases, the longest-running streak on record.
Housing Starts – Released 3/16/2023 – New home starts in February were at a seasonally adjusted annual rate of 1.450 million; up 9.8% above January, but 18.4% below last February’s rate. Building Permits were at a seasonally adjusted annual rate of 1.524 million, up 13.8% compared to January, but down 17.9% over last year.
Next week we get data on Housing Starts and Existing Home Sales.
Data Sources:
Bureau of Economic Analysis (BEA)
Congressional Budget Office (CBO)
U.S. Bureau of Labor Statistics (BLS)
Federal Reserve Economic Data (FRED Charts)
CME Fed Watch
U.S. Treasury – Yields
U.S. Census Bureau
Institute for Supply Management (ISM)
Weekly DOL Employment Data
BLS Monthly Jobs Report
JOLTS
US Energy Admin (EIA)
BLS Consumer Price Index CPI
BLS Producer Price Index PPI
Atlanta Fed GDPNOW
NY Fed Nowcast GDP
US Census Bureau Housing Starts
Consumer Credit
USCB Retail Sales
Construction Spending
Federal Reserve Dot Plots
NY Empire Index
Philadelphia Federal Reserve
P/E Ratio Data -Yardeni Research
Technical Analysis Info:
StockCharts.com – Financial Charts
Exponential vs Simple moving average
Other Links:
1973 Arab Oil Embargo
Hunt Brothers Silver
Long-Term Capital bailout
Categories:
Tags: