Good Life Advisors – Talking Points – Week 1
Yields are Rising on Quantitative Tightening Outlook
The Fed’s policy pivot remained one of the big stories this week. The bulk of the focus was on the December FOMC minutes, which pointed out that participants generally noted that given their outlooks for the economy, labor market and inflation, it may become warranted to raise the funds rate sooner or at a faster pace than had been anticipated earlier. The CME FedWatch tool shows a 75% chance that the fed will act by the March meeting. Participants also discussed how the current outlook was much stronger, with higher inflation and a tighter labor market, than at the beginning of the previous normalization cycle.
There were several prominent economic releases out this week. ISM manufacturing fell to 58.7 in December from 61.1 in the prior month, below the 60.0 consensus and the lowest since January 2021. However, details were better as new orders remained above 60.0, employment improved, supplier deliveries fell, and prices paid declined sharply to the lowest level since November 2020. ISM services fell to 62.0 from 69.1, below the 67.0 consensus and the sharpest decline since April 2020. However, economists noted the reading remained elevated following the record November print. That said, unlike the manufacturing survey, details were softer and there was no reprieve on the inflation front. The week ended with a 199K increase in December nonfarm payrolls, below the 400K+ consensus and even higher whisper numbers. However, the report still played into the tight labor market theme as there were upward revisions to prior months, average hourly earnings surprised to the upside, increasing 0.6% m/m and the unemployment rate fell 0.3pp to 3.9%, just below the Fed’s long-run estimate.
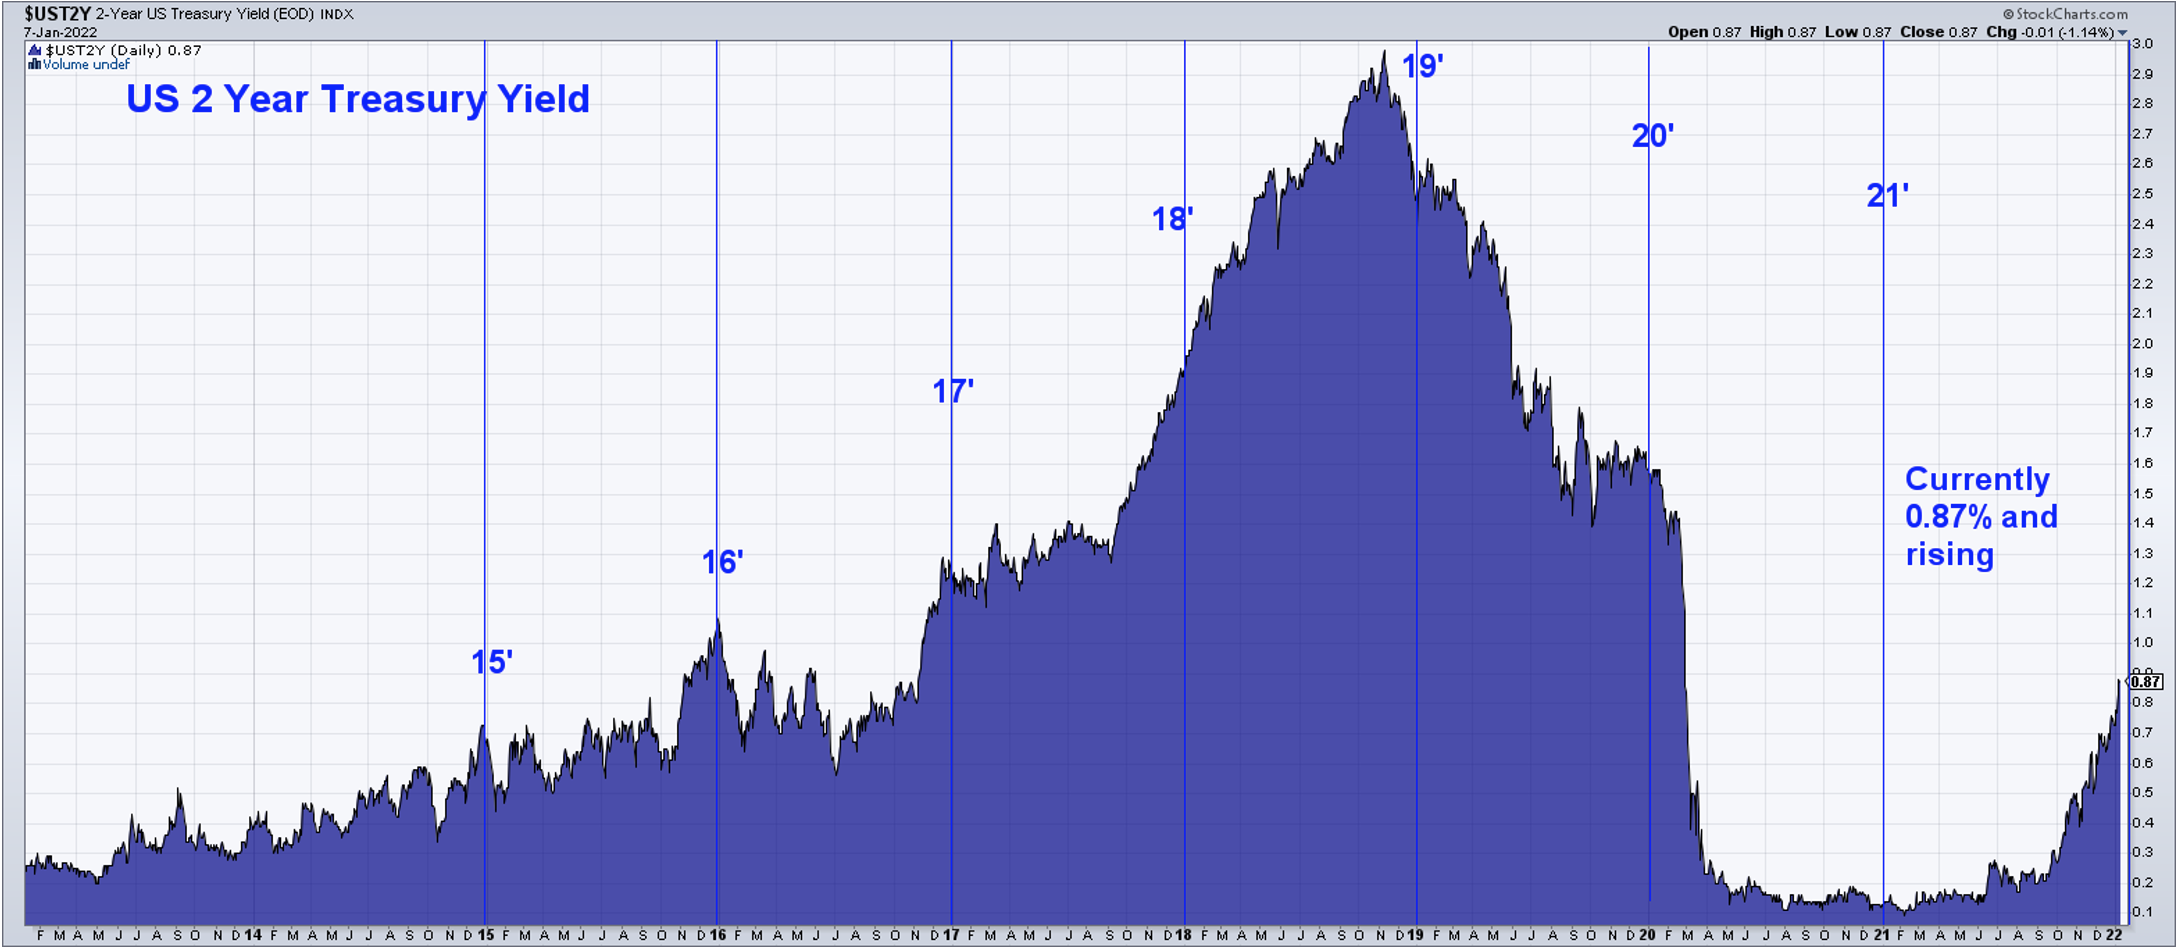
US equities were mostly lower in the first week of 2022 trading. Growth meaningfully underperformed value by 5.5%. REITs put in the worst performance. Tech came under pressure with software hit particularly hard. Healthcare was big laggard with weakness in managed care, pharma. Financials surged more than 5% with banks gaining strength due higher rates. To that end treasuries came under pressure with 10-year yields up over 25 bp to 1.77%. The bond agg was down1.53% this week while TIPS were still down but not as much, while the dollar index was off 0.2%. Gold lost 1.7%. WTI crude gained 5%.

Fixed Income
December FOMC Statement Credit, Liquidity and Balance Sheet Federal Reserve Dot Plots Dec 21′
US Corporate Debt Tops 7 Trillion. Treasury.gov yields FOMC Policy Normalization Statement Longer Run Goals August 2020
Global Bond Yields
Daily US Treasury Yields
Foreign Exchange Market
Energy Complex
The Baker Hughes rig count increased by 2 this week. There are 588 oil and gas rigs operating in the US – Up 228 over last year.
Metals Complex
Employment Picture
December Jobs Report – BLS Summary Released 1/7/2022 – The US Economy added 199k nonfarm jobs in December and the Unemployment rate edged down to 3.9%. Average hourly earnings increased by 19 cents to $31.31. Hiring highlights include +53k Leisure and Hospitality, +43k Professional and Business Services, and +26 in Manufacturing.
- Average hourly earnings increased by 19 cents to $31.31.
- U3 unemployment rate declined 0.3% to 3.9%. U6 unemployment rate declined to 7.3%.
- The labor force participation rate was unchanged at 61.9%.
- Average work week was unchanged at 34.7 hours.
Weekly Unemployment Claims – Released Thursday 1/6/2022 – The week ending January 1st observed an increase of 7k in initial claims currently at 207k. The four-week moving average of initial jobless claims increased 4.75k to 204.5k. The record low on the 4-week is from May of 1969 at 179k.
Job Openings & Labor Turnover Survey JOLTS – Released 1/4/2022 – The U.S. Bureau of Labor Statistics reported the number and rate of job openings decreased to 10.6 million on the last business day of November. Over the month, hires were little changed at 6.7 million and separations increased to 6.3 million. Within separations, the quits rate increased to 3.0%. The layoffs and discharges rates were unchanged at 0.9%.
Employment Cost Index – Released 10/29/2021 – Compensation costs for civilian workers increased 1.3% for the 3-month period ending in September 2021. The 12-month period ending in September 2021 saw compensation costs increase by 3.7%. The 12-month period ending September 2020 increased 2.4%. Wages and salaries increased 4.2 percent over the year and increased 2.5 percent for the 12-month period ending in September 2020. Benefit costs increased 2.5 percent over the year and increased 2.3 percent for the 12-month period ending in September 2020. This report is published quarterly.
This Week’s Economic Data
Links take you to the data source
Consumer Credit – Released 1/7/2022 – Consumer credit increased at a seasonally adjusted annual rate of 11.0 percent in November. Revolving credit increased at an annual rate of 23.4 percent, while nonrevolving credit increased at an annual rate of 7.2 percent.
U.S. Trade Balance – Released 1/6/2022 – According to the U.S. Census Bureau of Economic Analysis the goods and services deficit increased in November by $13 billion to $80.2 billion. November exports were $224.2 billion, $0.4 billion more than October exports. November imports were $304.4 billion, $13.4 billion more than October imports. Year to date the goods and services deficit increased $174.6 billion or 28.6%, from the same period in 2020. Year to date exports and imports increased $354.4 billion or 18.2% and increased $529.0 billion or 20.7% respectively.
PMI Non-Manufacturing Index – Released 1/6/2022 – Economic activity in the non-manufacturing sector grew in November for the 19th consecutive month. ISM Non-Manufacturing registered 62.0 percent, which is 7.1 percentage points below the adjusted November reading of 69.1 percent.
PMI Manufacturing Index – Released 1/3/2022 – December PMI decreased 2.4% to 58.7% down from November’s reading of 61.1%. The New Orders Index was 60.4% down 1.1% from November’s reading of 61.5%. The Production Index registered 59.2%, down 2.3%.
U.S. Construction Spending – Released 1/3/2022 – Construction spending increased 0.4% in November measuring at a seasonally adjusted annual rate of $1,625.9 billion. The November figure is 9.3% above the November 2020 estimate. Private construction spending was 0.6% above the revised October estimate at $1,273.6 billion. Public construction spending was 0.2% below the revised October estimate at $352.3 billion.
Recent Economic Data
Links take you to the data source
Chicago PMI – Released 12/31/2021 – Chicago PMI increased to 63.1 points in December. Among the main five indicators, Production and New Orders and were higher. Order Backlogs, Employment and Supplier Deliveries fell across the month.
US Light Vehicle Sales – Released 12/23/2021 – U.S. light vehicle sales were at a seasonally adjusted annual rate (SAAR) of 12.857 million units in November.
Personal Income – Released 12/23/2021 – Personal income increased $90.4 billion or 0.4 percent in November according to estimates released today by the Bureau of Economic Analysis. Disposable personal income (DPI) increased $70.4 billion or 0.4 percent and personal consumption expenditures (PCE) increased $104.7 billion or 0.6 percent.
Durable Goods – Released 12/23/2021 –New orders for manufactured durable goods in November increased $6.5billion or 2.5% to $268.3 billion. Transportation equipment led the increase raising $5.0 billion or 6.5% to $82.1 billion.
New Residential Sales – Released 12/23/2021 – Sales of new single-family homes increased 12.4% to 744k, seasonally adjusted, in November. The median sales price of new homes sold in November was $416,900 with an average sales price of $481,700. At the end of November, the seasonally adjusted estimate of new homes for sale was 402k. This represents a supply of 6.5 months at the current sales rate.
Existing Home Sales – Released 12/22/2021 – Existing home sales increased in November. Sales rose 1.9% to a seasonally adjusted rate of 6.46 million in November. Sales are currently down 2.0% from one year ago. Housing inventory sits at 1.11 million units. Down 9.8% from October’s inventory. Down 13.3% over last year. Unsold inventory sits at a 2.1-month supply. The median existing home price for all housing types was $353,900.
Consumer Confidence – Released 12/22/2021 – The Consumer confidence index increased in December following a modest gain in November. The Index now stands at 115.8, up from 111.9 in November.
Third Estimate of 3rd Quarter 2021 GDP – Released 12/22/2021 – Real gross domestic product (GDP) increased at an annual rate of 2.3 percent in the third quarter of 2021, according to the third estimate released by the Bureau of Economic Analysis. The third estimate is based on source data that are more complete than the data available for the second and advance estimates. Real GDP increased 2.0% in the advance estimate and 2.1% in the second estimate. The increase in real GDP in the third quarter reflected increases in private inventory investment, personal consumption expenditures (PCE), state and local government spending, and nonresidential fixed investment that were partly offset by decreases in residential fixed investment, federal government spending, and exports. Imports, which are a subtraction in the calculation of GDP, increased. The update primarily reflects upward revisions to personal consumption expenditures (PCE) and private inventory investment that were partly offset by a downward revision to exports. Imports, which are a subtraction in the calculation of GDP, were revised down.
Housing Starts – Released 12/16/2021 – New home starts in November were at a seasonally adjusted annual rate of 1.679 million; up 11.8% above October, and 8.3% above last November’s rate. Building Permits were at a seasonally adjusted annual rate of 1.712 million, up 3.6% compared to October, and up 0.9% over last year.
Industrial Production and Capacity Utilization – Released 12/16/2021 – In November Industrial production increased 0.5%. Manufacturing increased 0.7%. Utilities output decreased 0.8%. Mining output increased 0.7%. Total industrial production was 5.3% higher in November than a year ago. Total capacity utilization increased 0.3% to 76.8% in November which is 2.8% below its long run average.
Retail Sales – Released 12/15/2021 – U.S. retail sales for November increased 0.3% to $639.8 billion and retail sales are 18.2% above November 2020. U.S. retail sales for the September 2021 through November 2021 period were up 16.2% from the same period a year ago.
Producer Price Index – Released 12/14/2021 – The Producer Price Index for final demand increased 0.8% in November. PPI less food and energy also increased 0.8% in November. The change in PPI for final demand has increased 9.6% year/y.
Consumer Price Index – Released 12/10/2021 – Consumer prices rose 0.8% m/m in November following a 0.9% gain in October. Consumer prices are up 6.8% for the 12-month period ending in November marking the largest 12-month increase since the period ending June 1982. Core consumer prices increased 0.5% m/m in November following a 0.6% gain in October.
Next week we get data on the CPI, PPI, Retail Sales, and Industrial Production and Capacity Utilization.
Data Sources:
Bureau of Economic Analysis (BEA)
Congressional Budget Office (CBO)
U.S. Bureau of Labor Statistics (BLS)
Federal Reserve Economic Data (FRED Charts)
CME Fed Watch
U.S. Treasury – Yields
U.S. Census Bureau
Institute for Supply Management (ISM)
Weekly DOL Employment Data
BLS Monthly Jobs Report
JOLTS
US Energy Admin (EIA)
BLS Consumer Price Index CPI
BLS Producer Price Index PPI
Atlanta Fed GDPNOW
NY Fed Nowcast GDP
US Census Bureau Housing Starts
Consumer Credit
USCB Retail Sales
Construction Spending
Federal Reserve Dot Plots
NY Empire Index
Philadelphia Federal Reserve
P/E Ratio Data -Yardeni Research
Technical Analysis Info:
StockCharts.com – Financial Charts
Exponential vs Simple moving average
Other Links:
1973 Arab Oil Embargo
Hunt Brothers Silver
Long-Term Capital bailout


Week 1 Talking Points
Good Life Advisors – Talking Points – Week 1
Yields are Rising on Quantitative Tightening Outlook
The Fed’s policy pivot remained one of the big stories this week. The bulk of the focus was on the December FOMC minutes, which pointed out that participants generally noted that given their outlooks for the economy, labor market and inflation, it may become warranted to raise the funds rate sooner or at a faster pace than had been anticipated earlier. The CME FedWatch tool shows a 75% chance that the fed will act by the March meeting. Participants also discussed how the current outlook was much stronger, with higher inflation and a tighter labor market, than at the beginning of the previous normalization cycle.
There were several prominent economic releases out this week. ISM manufacturing fell to 58.7 in December from 61.1 in the prior month, below the 60.0 consensus and the lowest since January 2021. However, details were better as new orders remained above 60.0, employment improved, supplier deliveries fell, and prices paid declined sharply to the lowest level since November 2020. ISM services fell to 62.0 from 69.1, below the 67.0 consensus and the sharpest decline since April 2020. However, economists noted the reading remained elevated following the record November print. That said, unlike the manufacturing survey, details were softer and there was no reprieve on the inflation front. The week ended with a 199K increase in December nonfarm payrolls, below the 400K+ consensus and even higher whisper numbers. However, the report still played into the tight labor market theme as there were upward revisions to prior months, average hourly earnings surprised to the upside, increasing 0.6% m/m and the unemployment rate fell 0.3pp to 3.9%, just below the Fed’s long-run estimate.
US equities were mostly lower in the first week of 2022 trading. Growth meaningfully underperformed value by 5.5%. REITs put in the worst performance. Tech came under pressure with software hit particularly hard. Healthcare was big laggard with weakness in managed care, pharma. Financials surged more than 5% with banks gaining strength due higher rates. To that end treasuries came under pressure with 10-year yields up over 25 bp to 1.77%. The bond agg was down1.53% this week while TIPS were still down but not as much, while the dollar index was off 0.2%. Gold lost 1.7%. WTI crude gained 5%.
Table of Contents
Fixed Income
December FOMC Statement Credit, Liquidity and Balance Sheet Federal Reserve Dot Plots Dec 21′
US Corporate Debt Tops 7 Trillion. Treasury.gov yields FOMC Policy Normalization Statement Longer Run Goals August 2020
Global Bond Yields
Daily US Treasury Yields
Foreign Exchange Market
Energy Complex
The Baker Hughes rig count increased by 2 this week. There are 588 oil and gas rigs operating in the US – Up 228 over last year.
Metals Complex
Employment Picture
December Jobs Report – BLS Summary Released 1/7/2022 – The US Economy added 199k nonfarm jobs in December and the Unemployment rate edged down to 3.9%. Average hourly earnings increased by 19 cents to $31.31. Hiring highlights include +53k Leisure and Hospitality, +43k Professional and Business Services, and +26 in Manufacturing.
Weekly Unemployment Claims – Released Thursday 1/6/2022 – The week ending January 1st observed an increase of 7k in initial claims currently at 207k. The four-week moving average of initial jobless claims increased 4.75k to 204.5k. The record low on the 4-week is from May of 1969 at 179k.
Job Openings & Labor Turnover Survey JOLTS – Released 1/4/2022 – The U.S. Bureau of Labor Statistics reported the number and rate of job openings decreased to 10.6 million on the last business day of November. Over the month, hires were little changed at 6.7 million and separations increased to 6.3 million. Within separations, the quits rate increased to 3.0%. The layoffs and discharges rates were unchanged at 0.9%.
Employment Cost Index – Released 10/29/2021 – Compensation costs for civilian workers increased 1.3% for the 3-month period ending in September 2021. The 12-month period ending in September 2021 saw compensation costs increase by 3.7%. The 12-month period ending September 2020 increased 2.4%. Wages and salaries increased 4.2 percent over the year and increased 2.5 percent for the 12-month period ending in September 2020. Benefit costs increased 2.5 percent over the year and increased 2.3 percent for the 12-month period ending in September 2020. This report is published quarterly.
This Week’s Economic Data
Links take you to the data source
Consumer Credit – Released 1/7/2022 – Consumer credit increased at a seasonally adjusted annual rate of 11.0 percent in November. Revolving credit increased at an annual rate of 23.4 percent, while nonrevolving credit increased at an annual rate of 7.2 percent.
U.S. Trade Balance – Released 1/6/2022 – According to the U.S. Census Bureau of Economic Analysis the goods and services deficit increased in November by $13 billion to $80.2 billion. November exports were $224.2 billion, $0.4 billion more than October exports. November imports were $304.4 billion, $13.4 billion more than October imports. Year to date the goods and services deficit increased $174.6 billion or 28.6%, from the same period in 2020. Year to date exports and imports increased $354.4 billion or 18.2% and increased $529.0 billion or 20.7% respectively.
PMI Non-Manufacturing Index – Released 1/6/2022 – Economic activity in the non-manufacturing sector grew in November for the 19th consecutive month. ISM Non-Manufacturing registered 62.0 percent, which is 7.1 percentage points below the adjusted November reading of 69.1 percent.
PMI Manufacturing Index – Released 1/3/2022 – December PMI decreased 2.4% to 58.7% down from November’s reading of 61.1%. The New Orders Index was 60.4% down 1.1% from November’s reading of 61.5%. The Production Index registered 59.2%, down 2.3%.
U.S. Construction Spending – Released 1/3/2022 – Construction spending increased 0.4% in November measuring at a seasonally adjusted annual rate of $1,625.9 billion. The November figure is 9.3% above the November 2020 estimate. Private construction spending was 0.6% above the revised October estimate at $1,273.6 billion. Public construction spending was 0.2% below the revised October estimate at $352.3 billion.
Recent Economic Data
Links take you to the data source
Chicago PMI – Released 12/31/2021 – Chicago PMI increased to 63.1 points in December. Among the main five indicators, Production and New Orders and were higher. Order Backlogs, Employment and Supplier Deliveries fell across the month.
US Light Vehicle Sales – Released 12/23/2021 – U.S. light vehicle sales were at a seasonally adjusted annual rate (SAAR) of 12.857 million units in November.
Personal Income – Released 12/23/2021 – Personal income increased $90.4 billion or 0.4 percent in November according to estimates released today by the Bureau of Economic Analysis. Disposable personal income (DPI) increased $70.4 billion or 0.4 percent and personal consumption expenditures (PCE) increased $104.7 billion or 0.6 percent.
Durable Goods – Released 12/23/2021 –New orders for manufactured durable goods in November increased $6.5billion or 2.5% to $268.3 billion. Transportation equipment led the increase raising $5.0 billion or 6.5% to $82.1 billion.
New Residential Sales – Released 12/23/2021 – Sales of new single-family homes increased 12.4% to 744k, seasonally adjusted, in November. The median sales price of new homes sold in November was $416,900 with an average sales price of $481,700. At the end of November, the seasonally adjusted estimate of new homes for sale was 402k. This represents a supply of 6.5 months at the current sales rate.
Existing Home Sales – Released 12/22/2021 – Existing home sales increased in November. Sales rose 1.9% to a seasonally adjusted rate of 6.46 million in November. Sales are currently down 2.0% from one year ago. Housing inventory sits at 1.11 million units. Down 9.8% from October’s inventory. Down 13.3% over last year. Unsold inventory sits at a 2.1-month supply. The median existing home price for all housing types was $353,900.
Consumer Confidence – Released 12/22/2021 – The Consumer confidence index increased in December following a modest gain in November. The Index now stands at 115.8, up from 111.9 in November.
Third Estimate of 3rd Quarter 2021 GDP – Released 12/22/2021 – Real gross domestic product (GDP) increased at an annual rate of 2.3 percent in the third quarter of 2021, according to the third estimate released by the Bureau of Economic Analysis. The third estimate is based on source data that are more complete than the data available for the second and advance estimates. Real GDP increased 2.0% in the advance estimate and 2.1% in the second estimate. The increase in real GDP in the third quarter reflected increases in private inventory investment, personal consumption expenditures (PCE), state and local government spending, and nonresidential fixed investment that were partly offset by decreases in residential fixed investment, federal government spending, and exports. Imports, which are a subtraction in the calculation of GDP, increased. The update primarily reflects upward revisions to personal consumption expenditures (PCE) and private inventory investment that were partly offset by a downward revision to exports. Imports, which are a subtraction in the calculation of GDP, were revised down.
Housing Starts – Released 12/16/2021 – New home starts in November were at a seasonally adjusted annual rate of 1.679 million; up 11.8% above October, and 8.3% above last November’s rate. Building Permits were at a seasonally adjusted annual rate of 1.712 million, up 3.6% compared to October, and up 0.9% over last year.
Industrial Production and Capacity Utilization – Released 12/16/2021 – In November Industrial production increased 0.5%. Manufacturing increased 0.7%. Utilities output decreased 0.8%. Mining output increased 0.7%. Total industrial production was 5.3% higher in November than a year ago. Total capacity utilization increased 0.3% to 76.8% in November which is 2.8% below its long run average.
Retail Sales – Released 12/15/2021 – U.S. retail sales for November increased 0.3% to $639.8 billion and retail sales are 18.2% above November 2020. U.S. retail sales for the September 2021 through November 2021 period were up 16.2% from the same period a year ago.
Producer Price Index – Released 12/14/2021 – The Producer Price Index for final demand increased 0.8% in November. PPI less food and energy also increased 0.8% in November. The change in PPI for final demand has increased 9.6% year/y.
Consumer Price Index – Released 12/10/2021 – Consumer prices rose 0.8% m/m in November following a 0.9% gain in October. Consumer prices are up 6.8% for the 12-month period ending in November marking the largest 12-month increase since the period ending June 1982. Core consumer prices increased 0.5% m/m in November following a 0.6% gain in October.
Next week we get data on the CPI, PPI, Retail Sales, and Industrial Production and Capacity Utilization.
Data Sources:
Bureau of Economic Analysis (BEA)
Congressional Budget Office (CBO)
U.S. Bureau of Labor Statistics (BLS)
Federal Reserve Economic Data (FRED Charts)
CME Fed Watch
U.S. Treasury – Yields
U.S. Census Bureau
Institute for Supply Management (ISM)
Weekly DOL Employment Data
BLS Monthly Jobs Report
JOLTS
US Energy Admin (EIA)
BLS Consumer Price Index CPI
BLS Producer Price Index PPI
Atlanta Fed GDPNOW
NY Fed Nowcast GDP
US Census Bureau Housing Starts
Consumer Credit
USCB Retail Sales
Construction Spending
Federal Reserve Dot Plots
NY Empire Index
Philadelphia Federal Reserve
P/E Ratio Data -Yardeni Research
Technical Analysis Info:
StockCharts.com – Financial Charts
Exponential vs Simple moving average
Other Links:
1973 Arab Oil Embargo
Hunt Brothers Silver
Long-Term Capital bailout
Categories:
Tags: