Good Life Advisors – Talking Points – Week 7
Inflation – Down, but not out.
The S&P logged its second-straight weekly decline, though it finished the week not far below 4100 and remained in the same trading range it has occupied since late January. Much of the market conversation of late has touched on the resilience of equities in the face of the Fed’s consistent “higher for longer” messaging and a slight ratcheting upward of peak-rate expectations. The bullish case has pointed to a still-tight labor market, consumer health (displayed in this week’s retail sales release), well-anchored inflation expectations, a lower bar for Q4 earnings, and (until this week) the perception of steady disinflationary progress. But this week challenged that key latter pillar, with a hotter January PPI report and upward moves in the prices-paid components of some regional manufacturing surveys giving the market pause (despite the fact analysts have warned the path down could be bumpy). At the same time, somewhat hawkish Fedspeak raising even the possibility of a 50bp hike in March injected a bit of caution. Several other factors-including the disconnect between stocks and bonds, valuation concerns, heightened scrutiny around retail investment, and the influence of a high volume of very short-term options-also contributed to the week’s risk-off atmosphere. Oil was lower, with WTI dropping 4.0% after an 8.6% gain in the prior week. Concerns about the US interest-rate trajectory and continuing inventory builds seemed to outweigh longer-term prospects of a China-driven global demand increase. Gold declined for the third consecutive week, dropping 1.3%. The 2/10 spread logged its deepest inversion since the early 1980s at -0.87bp
The week’s heavy schedule of economic releases helped flesh out the disinflation narrative; and while analysts had stressed that the deceleration would likely be bumpy, the reports nevertheless seemed to inject a note of caution into the debate. Headline and core January CPI came in largely in line with consensus in terms of m/m readings, though services inflation remained stubbornly high. January PPI, however, came in hotter than consensus on both the headline and core readings, with goods prices rising their fastest since last June. February’s NY Fed Empire manufacturing survey and the similar Philadelphia Fed report both showed prices paid ticking higher. Elsewhere, January retail sales surged 3.0% m/m, well ahead of the 1.7% consensus, with control-group sales beating as well. Despite what were seen as some seasonal distortions, the underlying picture was of still-healthy consumption growth, though there were also some concerns strong demand could urge inflation up in some supply constrained categories. Finally, yet another week of sub-200K initial jobless claims provided more evidence for a tight labor market with possible implications for wage growth.
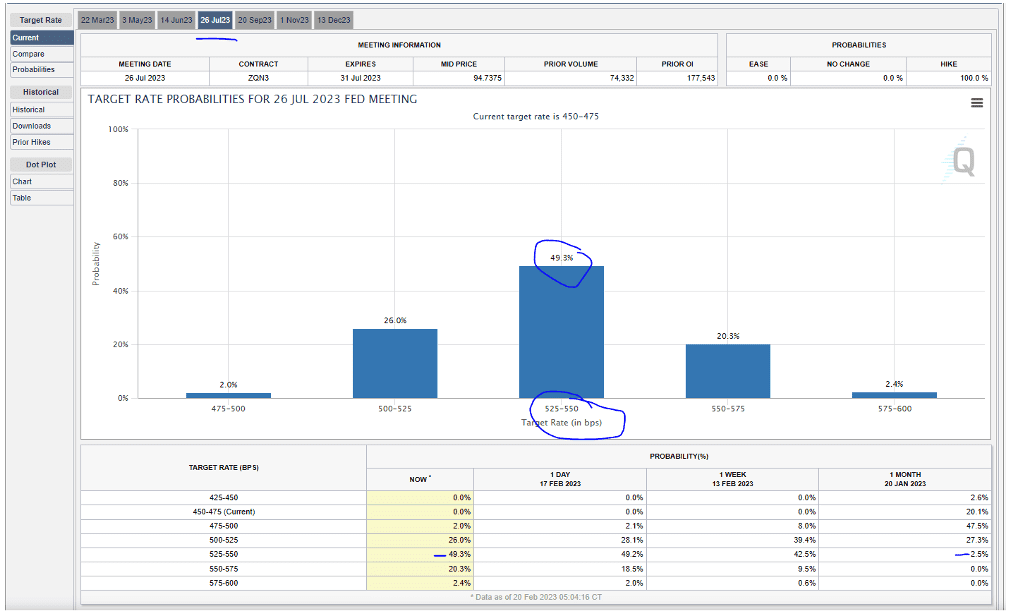
This week’s Fedspeak trended toward the hawkish, resulting in investors revisiting their expectations for the Fed’s nearer-term rate path. St. Louis Fed President Bullard (nonvoter) drew the lion’s share of attention after he said Thursday that he wouldn’t rule out a 50bp hike at the March FOMC meeting. Cleveland Fed President Mester (nonvoter) said she saw a compelling case for a 50bp move at the 1-Feb meeting, adding that rates will have to be held above 5% for some time to tame inflation. Dallas Fed President Logan (voter) argued rates may have to rise higher than expected, stressing that the Fed must remain flexible. NY Fed President Williams (voter) hewed closely to the “raise and hold” messaging, saying the Fed will stay the course until it regains the 2% inflation target. In the wake of these comments, market pricing showed expectations for three more 25bp hikes, with rates topping out at 5.25-5.50% by July (though the Fed is also seen starting to cut by December). Consensus still only sees a 25bp hike in March, however. The CME FedWatch Tool is showing a 70% chance of 5.25% or higher at the July Fed meeting.

Fixed Income
Yield Curve
December FOMC Statement December Fed Minutes Balance Sheet Reduction Plan Credit, Liquidity and Balance Sheet Federal Reserve Dot Plots
Treasury.gov yields FOMC Policy Normalization Statement Longer- Run Goals Jan 2022
Foreign Exchange Market
Energy Complex
The Baker Hughes rig count was down by 1 this week. There are 760 oil and gas rigs operating in the US – Up 115 over last year.
Metals Complex
Employment Picture
Weekly Unemployment Claims – Released Thursday 2/16/2023 – The week ending February 11thobserved a decrease of 1k in initial claims decreasing to 194k. The four-week moving average of initial jobless claims was up by 500 to 189.5k.
January Jobs Report – BLS Summary – Released 2/3/2023 – The US Economy added 517k nonfarm jobs in January and the Unemployment rate declined to 3.4%. Average hourly earnings increased 10 cents to $33.03. Hiring highlights include +128k Leisure and Hospitality, +105k Education and Health Services, and +82 Professional and Business Services.
- Average hourly earnings increased 10 cents/0.3% to $33.03.
- U3 unemployment rate declined 0.1% to 3.4%. U6 unemployment rate increased 0.1% to 6.6%.
- The labor force participation rate was little changed at 62.4%.
- Average work week increased by 0.3 to 34.7 hours.
Job Openings & Labor Turnover Survey JOLTS – Released 2/1/2023 – The number of job openings increased to 11.0 million on the last business day of December, the U.S. Bureau of Labor Statistics reported. Over the month the number of hires and total separations changed little at 6.2 million and 5.9 million, respectively. Within separations, quits (4.1 million) and layoffs and discharges (1.5 million) changed little.
Employment Cost Index – Released 1/31/2023 – Compensation costs for civilian workers increased 1.0% for the 3-month period ending in December 2022. The 12-month period ending on December 2022 saw compensation costs increase by 5.1%. The 12-month period ending December 2021 increased 4.0%. Wages and salaries increased 5.1 percent over the year and increased 4.5 percent for the 12-month period ending in December 2021. Benefit costs increased 4.9 percent over the year and increased 2.8 percent for the 12-month period ending in December 2021. This report is published quarterly.
This Week’s Economic Data
Links take you to the data source
Producer Price Index – Released 2/16/2023 – The PPI for final demand increased 0.7 percent in January, seasonally adjusted, the U.S. Bureau of Labor Statistics reported. Final demand prices declined 0.2 percent in December but increased 0.3 percent in November. On an unadjusted basis, the index for final demand increased 6.0 percent year over year.
Housing Starts– Released 2/16/2023 – New home starts in January were at a seasonally adjusted annual rate of 1.309 million; down 4.5% below December, and 21.4% below last January’s rate. Building Permits were at a seasonally adjusted annual rate of 1.339 million, up 0.1% compared to December, but down 27.3% over last year.
Industrial Production and Capacity Utilization Released 2/15/2023 – In January Industrial production was unchanged. Manufacturing increased 1.0%. Utilities output decreased 9.9%. Mining output increased 2.0%. Total industrial production was 0.8% higher in January than a year ago. Total capacity utilization decreased 0.1% in January to 78.3% which is 1.3% below its long run average.
Retail Sales– Released 2/15/2023 – U.S. retail sales for January increased 3.0% to $697.0 billion and retail sales are 6.4% above January 2022. U.S. retail sales for the November 2022 through January 2023 period were up 6.1% from the same period a year ago.
Consumer Price Index – Released 2/14/2023 – Consumer prices increased 0.5% m/m in January following a 0.1% increase in December. Consumer prices are up 6.4% for the 12-month period ending in January. Core consumer prices increased 0.4% m/m in January.
Recent Economic Date
Links take you to the data source
Consumer Credit – Released 2/7/2023 – In December, consumer credit increased at a seasonally adjusted annual rate of 7.8 percent. Revolving credit increased at an annual rate of 14.8 percent, while nonrevolving credit increased at an annual rate of 5.6 percent.
U.S. Trade Balance – Released 2/7/2023 – The U.S. monthly international trade deficit increased in December 2022 according to the U.S. Bureau of Economic Analysis and the U.S. Census Bureau. The deficit increased from $61.0 billion in November (revised) to $67.4 billion in December. December exports were $250.2 billion, $2.2 billion less than November exports. December imports were $317.6 billion, $4.2 billion more than November imports. In 2022, the goods and services deficit increased $103.0 billion, or 12.2 percent, from 2021. Exports increased $453.1 billion or 17.7 percent. Imports increased $556.1 billion or 16.3 percent.
PMI Non-Manufacturing Index – Released 2/3/2023 – Economic activity grew in January after entering contraction territory in December. The Services PMI® registered 55.2 percent, 6.0 percentage points higher than December. In December the Services PMI® registered 49.2 percent.
PMI Manufacturing Index – Released 2/1/2023 – The January Manufacturing PMI® registered 47.4 percent, 1.0 percentage point lower than the 48.4 percent recorded in December. Regarding the overall economy, this figure indicates two months of contraction following 30 months of expansion. The Manufacturing PMI® figure is the lowest since May 2020, when it registered 43.5 percent. The New Orders Index remained in contraction territory at 42.5 percent, 2.6 percentage points lower than the 45.1 percent recorded in December.
U.S. Construction Spending– Released 2/1/2023 – Construction spending during December 2022 was estimated at a seasonally adjusted annual rate of $1,809.8 billion, 0.4 percent above the revised November estimate of $1,817.3 billion. The December figure is 7.7 percent above the December 2021 estimate of $1,681.0 billion. Over the year, construction spending amounted to $1,792.9 billion, 10.2 percent above the $1,626.4 billion for the same period in 2021.
Chicago PMI– Released 1/31/2023 – Chicago PMI remained in contraction territory but decreased in January to 44.3 points from 44.9 points in December.
Consumer Confidence– Released 1/31/2023 – The Conference Board Consumer Confidence Index® decreased in January. The Index now stands at 107.1 (1985=100), down from 109.0 in December.
US Light Vehicle Sales– Released 1/27/2023 – U.S. light vehicle sales were at a seasonally adjusted annual rate (SAAR) of 13.314 million units in December.
Personal Income – Released 1/27/2023 – Personal income increased $49.5 billion, or 0.2 percent in December. Disposable Personal Income increased $49.2 billion or 0.3 percent. Personal Consumption Expenditure decreased $41.6 billion or 0.2 percent.
Durable Goods Released 1/26/2023 – New orders for manufactured durable goods in December increased $15.3 billion or 5.6% to $286.9 billion. Transportation equipment increased up $15.5 billion or 16.7% to $108.1 billion.
New Residential Sales Released 1/26/2023 – Sales of new single-family homes increased 2.3% to 616k, seasonally adjusted, in December. The median sales price of new homes sold in December was $442,100 with an average sales price of $528,400. At the end of December, the seasonally adjusted estimate of new homes for sale was 461k. This represents a supply of 9.0 months at the current sales rate.
First Estimate of 4th Quarter 2022 GDP Released 1/26/2023 – Real gross domestic product (GDP) increased at an annual rate of 2.9 percent in the fourth quarter of 2022 according to the advanced estimate released by the Bureau of Economic Analysis, following an increase of 3.2 percent in the third quarter of 2022. The GDP estimate released today is based on source data that are incomplete or subject to further revision. The increase in real GDP reflected increases in private inventory investment, consumer spending, federal government spending, state and local government spending, and nonresidential fixed investment that were partly offset by decreases in residential fixed investment and exports. Imports, which are a subtraction in the calculation of GDP, decreased.
Existing Home Sales Released 1/20/2023 – Existing home sales decreased in December marking eleven consecutive months of declines. Sales declined 1.5% to a seasonally adjusted rate of 4.02 million in December. Sales decreased 34.0% year-over-year. Housing inventory sits at 970k units. Down 13.4% from November’s inventory. Up 10.2% over last year. Unsold inventory sits at a 2.9-month supply. The median existing home price for all housing types was $366,900 which is up 2.3% from December 2021. This marks 130 consecutive months of year-over-year increases, the longest-running streak on record.
Next week we get data on Existing Home Sales, the 2nd Estimate of 4th Quarter GDP, New Residential Sales, and Personal Income.
Data Sources:
Bureau of Economic Analysis (BEA)
Congressional Budget Office (CBO)
U.S. Bureau of Labor Statistics (BLS)
Federal Reserve Economic Data (FRED Charts)
CME Fed Watch
U.S. Treasury – Yields
U.S. Census Bureau
Institute for Supply Management (ISM)
Weekly DOL Employment Data
BLS Monthly Jobs Report
JOLTS
US Energy Admin (EIA)
BLS Consumer Price Index CPI
BLS Producer Price Index PPI
Atlanta Fed GDPNOW
NY Fed Nowcast GDP
US Census Bureau Housing Starts
Consumer Credit
USCB Retail Sales
Construction Spending
Federal Reserve Dot Plots
NY Empire Index
Philadelphia Federal Reserve
P/E Ratio Data -Yardeni Research
Technical Analysis Info:
StockCharts.com – Financial Charts
Exponential vs Simple moving average
Other Links:
1973 Arab Oil Embargo
Hunt Brothers Silver
Long-Term Capital bailout


Week 7 Talking Points
Table of Contents
Good Life Advisors – Talking Points – Week 7
Inflation – Down, but not out.
The S&P logged its second-straight weekly decline, though it finished the week not far below 4100 and remained in the same trading range it has occupied since late January. Much of the market conversation of late has touched on the resilience of equities in the face of the Fed’s consistent “higher for longer” messaging and a slight ratcheting upward of peak-rate expectations. The bullish case has pointed to a still-tight labor market, consumer health (displayed in this week’s retail sales release), well-anchored inflation expectations, a lower bar for Q4 earnings, and (until this week) the perception of steady disinflationary progress. But this week challenged that key latter pillar, with a hotter January PPI report and upward moves in the prices-paid components of some regional manufacturing surveys giving the market pause (despite the fact analysts have warned the path down could be bumpy). At the same time, somewhat hawkish Fedspeak raising even the possibility of a 50bp hike in March injected a bit of caution. Several other factors-including the disconnect between stocks and bonds, valuation concerns, heightened scrutiny around retail investment, and the influence of a high volume of very short-term options-also contributed to the week’s risk-off atmosphere. Oil was lower, with WTI dropping 4.0% after an 8.6% gain in the prior week. Concerns about the US interest-rate trajectory and continuing inventory builds seemed to outweigh longer-term prospects of a China-driven global demand increase. Gold declined for the third consecutive week, dropping 1.3%. The 2/10 spread logged its deepest inversion since the early 1980s at -0.87bp
The week’s heavy schedule of economic releases helped flesh out the disinflation narrative; and while analysts had stressed that the deceleration would likely be bumpy, the reports nevertheless seemed to inject a note of caution into the debate. Headline and core January CPI came in largely in line with consensus in terms of m/m readings, though services inflation remained stubbornly high. January PPI, however, came in hotter than consensus on both the headline and core readings, with goods prices rising their fastest since last June. February’s NY Fed Empire manufacturing survey and the similar Philadelphia Fed report both showed prices paid ticking higher. Elsewhere, January retail sales surged 3.0% m/m, well ahead of the 1.7% consensus, with control-group sales beating as well. Despite what were seen as some seasonal distortions, the underlying picture was of still-healthy consumption growth, though there were also some concerns strong demand could urge inflation up in some supply constrained categories. Finally, yet another week of sub-200K initial jobless claims provided more evidence for a tight labor market with possible implications for wage growth.
This week’s Fedspeak trended toward the hawkish, resulting in investors revisiting their expectations for the Fed’s nearer-term rate path. St. Louis Fed President Bullard (nonvoter) drew the lion’s share of attention after he said Thursday that he wouldn’t rule out a 50bp hike at the March FOMC meeting. Cleveland Fed President Mester (nonvoter) said she saw a compelling case for a 50bp move at the 1-Feb meeting, adding that rates will have to be held above 5% for some time to tame inflation. Dallas Fed President Logan (voter) argued rates may have to rise higher than expected, stressing that the Fed must remain flexible. NY Fed President Williams (voter) hewed closely to the “raise and hold” messaging, saying the Fed will stay the course until it regains the 2% inflation target. In the wake of these comments, market pricing showed expectations for three more 25bp hikes, with rates topping out at 5.25-5.50% by July (though the Fed is also seen starting to cut by December). Consensus still only sees a 25bp hike in March, however. The CME FedWatch Tool is showing a 70% chance of 5.25% or higher at the July Fed meeting.
Fixed Income
Yield Curve
December FOMC Statement December Fed Minutes Balance Sheet Reduction Plan Credit, Liquidity and Balance Sheet Federal Reserve Dot Plots
Treasury.gov yields FOMC Policy Normalization Statement Longer- Run Goals Jan 2022
Foreign Exchange Market
Energy Complex
The Baker Hughes rig count was down by 1 this week. There are 760 oil and gas rigs operating in the US – Up 115 over last year.
Metals Complex
Employment Picture
Weekly Unemployment Claims – Released Thursday 2/16/2023 – The week ending February 11thobserved a decrease of 1k in initial claims decreasing to 194k. The four-week moving average of initial jobless claims was up by 500 to 189.5k.
January Jobs Report – BLS Summary – Released 2/3/2023 – The US Economy added 517k nonfarm jobs in January and the Unemployment rate declined to 3.4%. Average hourly earnings increased 10 cents to $33.03. Hiring highlights include +128k Leisure and Hospitality, +105k Education and Health Services, and +82 Professional and Business Services.
Job Openings & Labor Turnover Survey JOLTS – Released 2/1/2023 – The number of job openings increased to 11.0 million on the last business day of December, the U.S. Bureau of Labor Statistics reported. Over the month the number of hires and total separations changed little at 6.2 million and 5.9 million, respectively. Within separations, quits (4.1 million) and layoffs and discharges (1.5 million) changed little.
Employment Cost Index – Released 1/31/2023 – Compensation costs for civilian workers increased 1.0% for the 3-month period ending in December 2022. The 12-month period ending on December 2022 saw compensation costs increase by 5.1%. The 12-month period ending December 2021 increased 4.0%. Wages and salaries increased 5.1 percent over the year and increased 4.5 percent for the 12-month period ending in December 2021. Benefit costs increased 4.9 percent over the year and increased 2.8 percent for the 12-month period ending in December 2021. This report is published quarterly.
This Week’s Economic Data
Links take you to the data source
Producer Price Index – Released 2/16/2023 – The PPI for final demand increased 0.7 percent in January, seasonally adjusted, the U.S. Bureau of Labor Statistics reported. Final demand prices declined 0.2 percent in December but increased 0.3 percent in November. On an unadjusted basis, the index for final demand increased 6.0 percent year over year.
Housing Starts– Released 2/16/2023 – New home starts in January were at a seasonally adjusted annual rate of 1.309 million; down 4.5% below December, and 21.4% below last January’s rate. Building Permits were at a seasonally adjusted annual rate of 1.339 million, up 0.1% compared to December, but down 27.3% over last year.
Industrial Production and Capacity Utilization Released 2/15/2023 – In January Industrial production was unchanged. Manufacturing increased 1.0%. Utilities output decreased 9.9%. Mining output increased 2.0%. Total industrial production was 0.8% higher in January than a year ago. Total capacity utilization decreased 0.1% in January to 78.3% which is 1.3% below its long run average.
Retail Sales– Released 2/15/2023 – U.S. retail sales for January increased 3.0% to $697.0 billion and retail sales are 6.4% above January 2022. U.S. retail sales for the November 2022 through January 2023 period were up 6.1% from the same period a year ago.
Consumer Price Index – Released 2/14/2023 – Consumer prices increased 0.5% m/m in January following a 0.1% increase in December. Consumer prices are up 6.4% for the 12-month period ending in January. Core consumer prices increased 0.4% m/m in January.
Recent Economic Date
Links take you to the data source
Consumer Credit – Released 2/7/2023 – In December, consumer credit increased at a seasonally adjusted annual rate of 7.8 percent. Revolving credit increased at an annual rate of 14.8 percent, while nonrevolving credit increased at an annual rate of 5.6 percent.
U.S. Trade Balance – Released 2/7/2023 – The U.S. monthly international trade deficit increased in December 2022 according to the U.S. Bureau of Economic Analysis and the U.S. Census Bureau. The deficit increased from $61.0 billion in November (revised) to $67.4 billion in December. December exports were $250.2 billion, $2.2 billion less than November exports. December imports were $317.6 billion, $4.2 billion more than November imports. In 2022, the goods and services deficit increased $103.0 billion, or 12.2 percent, from 2021. Exports increased $453.1 billion or 17.7 percent. Imports increased $556.1 billion or 16.3 percent.
PMI Non-Manufacturing Index – Released 2/3/2023 – Economic activity grew in January after entering contraction territory in December. The Services PMI® registered 55.2 percent, 6.0 percentage points higher than December. In December the Services PMI® registered 49.2 percent.
PMI Manufacturing Index – Released 2/1/2023 – The January Manufacturing PMI® registered 47.4 percent, 1.0 percentage point lower than the 48.4 percent recorded in December. Regarding the overall economy, this figure indicates two months of contraction following 30 months of expansion. The Manufacturing PMI® figure is the lowest since May 2020, when it registered 43.5 percent. The New Orders Index remained in contraction territory at 42.5 percent, 2.6 percentage points lower than the 45.1 percent recorded in December.
U.S. Construction Spending– Released 2/1/2023 – Construction spending during December 2022 was estimated at a seasonally adjusted annual rate of $1,809.8 billion, 0.4 percent above the revised November estimate of $1,817.3 billion. The December figure is 7.7 percent above the December 2021 estimate of $1,681.0 billion. Over the year, construction spending amounted to $1,792.9 billion, 10.2 percent above the $1,626.4 billion for the same period in 2021.
Chicago PMI– Released 1/31/2023 – Chicago PMI remained in contraction territory but decreased in January to 44.3 points from 44.9 points in December.
Consumer Confidence– Released 1/31/2023 – The Conference Board Consumer Confidence Index® decreased in January. The Index now stands at 107.1 (1985=100), down from 109.0 in December.
US Light Vehicle Sales– Released 1/27/2023 – U.S. light vehicle sales were at a seasonally adjusted annual rate (SAAR) of 13.314 million units in December.
Personal Income – Released 1/27/2023 – Personal income increased $49.5 billion, or 0.2 percent in December. Disposable Personal Income increased $49.2 billion or 0.3 percent. Personal Consumption Expenditure decreased $41.6 billion or 0.2 percent.
Durable Goods Released 1/26/2023 – New orders for manufactured durable goods in December increased $15.3 billion or 5.6% to $286.9 billion. Transportation equipment increased up $15.5 billion or 16.7% to $108.1 billion.
New Residential Sales Released 1/26/2023 – Sales of new single-family homes increased 2.3% to 616k, seasonally adjusted, in December. The median sales price of new homes sold in December was $442,100 with an average sales price of $528,400. At the end of December, the seasonally adjusted estimate of new homes for sale was 461k. This represents a supply of 9.0 months at the current sales rate.
First Estimate of 4th Quarter 2022 GDP Released 1/26/2023 – Real gross domestic product (GDP) increased at an annual rate of 2.9 percent in the fourth quarter of 2022 according to the advanced estimate released by the Bureau of Economic Analysis, following an increase of 3.2 percent in the third quarter of 2022. The GDP estimate released today is based on source data that are incomplete or subject to further revision. The increase in real GDP reflected increases in private inventory investment, consumer spending, federal government spending, state and local government spending, and nonresidential fixed investment that were partly offset by decreases in residential fixed investment and exports. Imports, which are a subtraction in the calculation of GDP, decreased.
Existing Home Sales Released 1/20/2023 – Existing home sales decreased in December marking eleven consecutive months of declines. Sales declined 1.5% to a seasonally adjusted rate of 4.02 million in December. Sales decreased 34.0% year-over-year. Housing inventory sits at 970k units. Down 13.4% from November’s inventory. Up 10.2% over last year. Unsold inventory sits at a 2.9-month supply. The median existing home price for all housing types was $366,900 which is up 2.3% from December 2021. This marks 130 consecutive months of year-over-year increases, the longest-running streak on record.
Next week we get data on Existing Home Sales, the 2nd Estimate of 4th Quarter GDP, New Residential Sales, and Personal Income.
Data Sources:
Bureau of Economic Analysis (BEA)
Congressional Budget Office (CBO)
U.S. Bureau of Labor Statistics (BLS)
Federal Reserve Economic Data (FRED Charts)
CME Fed Watch
U.S. Treasury – Yields
U.S. Census Bureau
Institute for Supply Management (ISM)
Weekly DOL Employment Data
BLS Monthly Jobs Report
JOLTS
US Energy Admin (EIA)
BLS Consumer Price Index CPI
BLS Producer Price Index PPI
Atlanta Fed GDPNOW
NY Fed Nowcast GDP
US Census Bureau Housing Starts
Consumer Credit
USCB Retail Sales
Construction Spending
Federal Reserve Dot Plots
NY Empire Index
Philadelphia Federal Reserve
P/E Ratio Data -Yardeni Research
Technical Analysis Info:
StockCharts.com – Financial Charts
Exponential vs Simple moving average
Other Links:
1973 Arab Oil Embargo
Hunt Brothers Silver
Long-Term Capital bailout
Categories:
Tags: