Tariff Man would like to sack the Fed Chair after losing his Secretary of Defense during a Gov’t Shutdown.
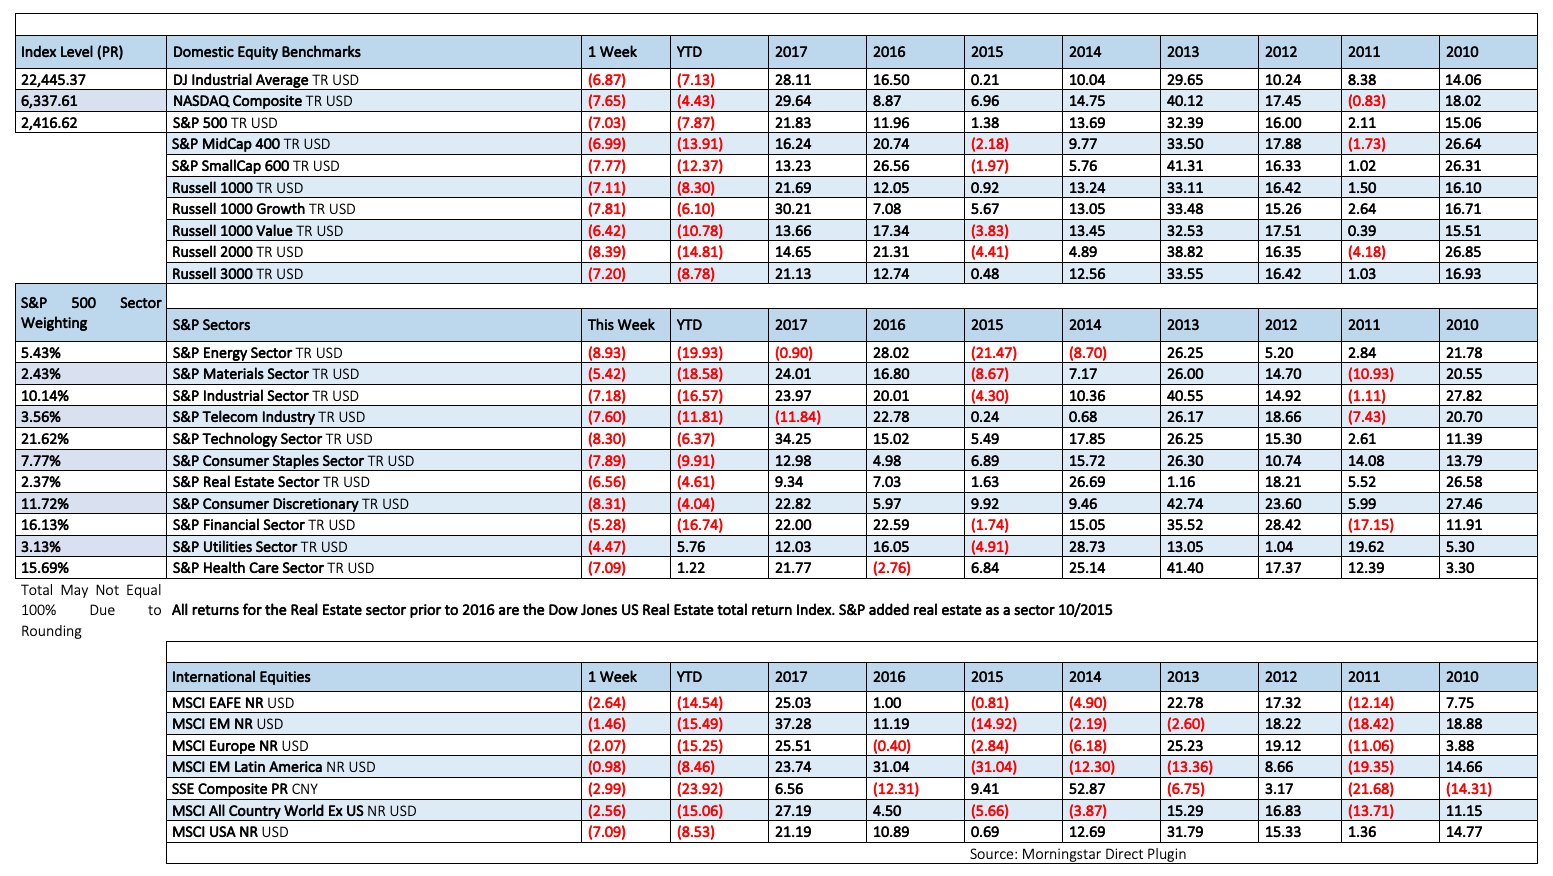
The fourth quarter has been extremely hard on equity investors. Less than three months ago (October 3rd) the S&P 500 was up 10% for the year, headed for its 10th consecutive positive year (total return). Now, the index is down by 7% ytd, and down a staggering 17% from 10/3. In fact, the S&P 500 has lost 10.5% of its value over just the last 11 trading days.
I am not sure how or if, you can quantify exactly how much of this sell off is related to the chaos coming from the White House. What I can say is that since the President tweeted that he was a “tariff man” on 12/4, the S&P500 is down 13.4%. It should also be pointed out that the SP500 is down 6.5% since 2pm Wednesday when the Federal Reserve raised interest rates and refused to consider tweaking the central bank’s balance sheet program. Fed Chair Powell irked the market during his press conference when he said that policy does not need to be accommodative now and that he does not see the Fed altering its approach to balance sheet normalization.
Of course, there was a growing concern, over the week, that there could be a partial government shutdown, and that did indeed occur. At the same time, you can feel a sense building that the U.S. and China aren’t going to be able to reach a trade agreement on structural issues in the 90 day window. On top of all this you add in that estimated S&P earnings for the fourth quarter have fallen by 3.2% since September 30 and analysts have been reducing their growth expectations for 2019, with estimates of just 5-6% annualized earnings growth through the first three quarters of next year.
All of this adds up to the worst week since 2008.
Fixed Income

FOMC December Statement Federal Reserve Dot Plots Dec 18 US Debt Measurement November Meeting Minutes US Corporate Debt Tops $6 Trillion
Global Bond Yields
The 2 year and 5-year yields are so close they round to even.
Foreign Exchange Market
The 2 year and Uncertainly around Brexit has kept pressure on the British Pound since April.
Energy Complex
Is $60 the new $80 for oil?
The Baker Hughes rig count showed a gain of 9 rigs this week. There are 1080 oil and gas rigs operating in the US. Up 149 over last year.
• Brent Crude Oil dropped 11.25% this week closing at $53.50/bbl.
• WTI Crude Oil lost 10.96% this week to close at $45.59/bbl.
• Heating Oil lost 6.52% this week closing at $1.725/gallon
• Natural Gas dropped 2.01% this week closing at $3.750 per million BTUs
• Unleaded Gas fell 8.94% this week at closing at $1.306/gallon
Metals Complex
Precious metals went nowhere this week.
• Gold rose 1.35% this week closing at $1258.10/oz
• Silver fell 0.44% on the week closing at $14.70/oz
• Palladium lost 1.10% this week closing at $1158.70/oz
• Copper fell 3.20% this week closing at $2.674 /lb.
Employment Picture
Weekly Unemployment Claims – Released Thursday 12/20 – In the week ending December 15th, initial claims were 214,000, an increase of 8,000 from the previous week’s unrevised level. The 4-week moving average was 222,000, an decrease of 2,750 from the previous week’s unrevised average.
Job Openings & Labor Turnover Survey – JOLTS Released Monday 12/10 – The number of job openings was a slight increase edging up by 0.1 million to 7.1 million on the last business day of October. Over the month, hires increased by 0.2 million to 5.9 million and separations declined slightly by 0.1 million to 5.6 million. Within separations, the quits rate saw a slight decline by 0.1 percent to 2.3 percent and the layoffs and discharges rate was unchanged at 1.1 percent.
November Jobs Report – BLS Summary Released 12/7 – The US Economy added 155k nonfarm jobs in November. The revision for October was downward by 13k and the revision for September was upward 1k. Hiring highlights include Education and Health care +34k, Professional and Business Services +32k, Manufacturing +27k, and Transportations and Warehousing +25k.
• Average hourly earnings increased by 6 cents/ 0.22% in November y/y hourly earnings are up 3.1%.
• U3 Civilian unemployment rate remained unchanged at 3.7%. U6 unemployment rate increased 0.2% to 7.6%
• The labor force participation rate was unchanged at 62.9%
• Average work week decreased by 0.1 hour to 34.4 hours.
Employment Cost Index – Released 10/31 – Compensation costs for civilian workers increased 2.8% for the 12-month period ending in September 2018 compared with a compensation costs increase of 2.5% in September 2017. Wages and salaries were up 2.9%, versus 2.5% for the 12-month period ending September 2017. Benefit costs increased 2.6%, versus 2.4% in September 2017. For private industry workers, compensation costs increased 2.9% year-over-year, versus 2.5% for the 12 months ending September 2017. Wages and salaries increased 3.1% year-over-year, versus 2.6% for the 12 months ending September 2017. Benefit costs increased 2.5%, versus 2.4% for the 12 months ending September 2017. This report is published quarterly.
This Week’s Economic Data
Personal Income – Released 12/21 – Personal Income increased 0.2% in November according to the BEA. The majority of this increase was due to increases in wages and salaries and increases in farm proprietor’s income. Real PCE (the Feds preferred inflation gauge) increased 0.3%. Real disposable personal income increased 0.2%. Real Personal Consumption Expenditures (PCE) has risen 1.8% y/y.
3rd Estimate of 3rd Quarter GDP – Released 12/21 – According to the third estimate released by the Bureau of Economic Analysis, Real Gross Domestic Product (Real GDP) increased at an annual rate of 3.4% in the third quarter of 2018. This result is slightly lower by 0.1% from 3.5% seen in the second estimate. The general outlook of real GDP remains roughly the same. The third estimate data provided an upward revision to private inventory investment. Downward revisions were reflected in personal consumption expenditures (PCE) and exports.
Durable Goods – Released 12/21 – New orders for manufactured durable goods increased $1.9 billion or 0.8% to $250.8 billion in November. This increase follows two consecutive months of decline. Transportation equipment, up 2.9%, drove the increase by $2.5 billion to $87 billion.
Existing Home Sales – Released 12/19 – Existing home sales increased 1.9% in November. Sales increased to a seasonally adjusted rate of 5.32 million. Sales are currently down 7.0% from one year ago. Housing inventory declined to 3.9 months of inventory and the existing homes for sale declined to 1.74 million. The median sales price for all types of homes was $257,700, up 4.2% year/y.
Housing Starts – Released 12/18 – New home starts in November were at a seasonally adjusted rate of 1.256 million; up 3.2% above October and down 3.6% from last November. Building Permits were at a seasonally adjusted rate of 1.328 million, up 5.0% compared to last month and up 0.4% over last year.
Recent Economic Data
Industrial Production and Capacity Utilization – Released 12/14 – Industrial production rose just 0.6% in November. Manufacturing output was unchanged. Capacity utilization gained 0.4% to78.5%. Utilization is 1.3% below its long run (1972-2017) average.
Retail Sales – Released 12/14 – Retail Sales increased by 0.2% to $513.5 billion in November. Year over year retail sales increased 4.3%.
Consumer Price Index – Released 12/12 – The Consumer Price Index was unchanged in November after an increase of 0.3 percent in October. For the 12 month period the index rose 2.2 percent before seasonal adjustment.
Producer Price Index – Released 12/11 – The Producer Price Index for final demand saw an increase of 0.1% in November. Core PPI (less food and energy) increased 0.3%. Year over year the index for final demand rose 2.5%.
Consumer Credit – Released 12/7 – Total outstanding consumer credit increased by 25.4 billion in October. Nonrevolving credit accounted for the majority of the gain. This results in an annual rate of 7.75%.
US Light Vehicle Sales – Released 12/6 – U.S. light vehicle sales were at a seasonally adjusted annual rate (SAAR) of 17.40 million units in November versus a SAAR of 17.49 million units in October. The November run rate was down 0.7% from the SAAR of 17.52 million units for November 2017.
PMI Non-Manufacturing Index (ISM Services) – Released 12/6 – The ISM Non-Manufacturing Index registered 0.4% points higher than last month at 60.7%. This represents continued growth in the non-manufacturing sector, at a slightly faster rate.
U.S. Trade Balance – Released 12/6 – The trade deficit rose $0.9 billion in October to – $55.5 billion. Exports were $211.0 billion while imports were $266.5 billion.
U.S. Construction Spending – Released 12/3 – Construction spending decreased slightly by 0.1% in October measuring at a seasonally adjusted annual rate of $1,308.8 billion. The October figure is 4.9% above the October 2017 estimate. Private construction spending was 0.4% below the revised September estimate.
PMI Manufacturing ISM Index – Released 12/3 – November PMI increased 1.6% to 59.3% from October’s reading of 57.7%. The New Orders Index was up 4.7% to 62.1%. The Production Index registered 60.6% up 0.7%.
Chicago PMI – Released 11/30 – Chicago PMI increased 8.0 points in November rising to an 11-month high of 66.4, up from 58.4 in October. The Prices Paid index remained locked in a historically elevated range.
New Residential Sales – Released 11/28 – Sales of new single-family homes declined in October by 8.9% to 544k, seasonally adjusted. The median sales price of new homes sold in October was $309.7k with an average sales price of $395.0k. At the end of October, the seasonally adjusted estimate of new homes for sale was 336k. This represents a supply of 7.4 months at the current sales rate.
Consumer Confidence – Released 11/27 – The Consumer confidence index declined in November. The Index now shows a reading of 135.7 down from 137.9 in October. Despite the decline in November, Consumer Confidence remains at historically strong levels. Should consumers’ assessment of the current conditions soften further; the pace of economic growth is likely to decline.
All sources linked HERE.


Week 51 #41 Talking Points
Tariff Man would like to sack the Fed Chair after losing his Secretary of Defense during a Gov’t Shutdown.
The fourth quarter has been extremely hard on equity investors. Less than three months ago (October 3rd) the S&P 500 was up 10% for the year, headed for its 10th consecutive positive year (total return). Now, the index is down by 7% ytd, and down a staggering 17% from 10/3. In fact, the S&P 500 has lost 10.5% of its value over just the last 11 trading days.
I am not sure how or if, you can quantify exactly how much of this sell off is related to the chaos coming from the White House. What I can say is that since the President tweeted that he was a “tariff man” on 12/4, the S&P500 is down 13.4%. It should also be pointed out that the SP500 is down 6.5% since 2pm Wednesday when the Federal Reserve raised interest rates and refused to consider tweaking the central bank’s balance sheet program. Fed Chair Powell irked the market during his press conference when he said that policy does not need to be accommodative now and that he does not see the Fed altering its approach to balance sheet normalization.
Of course, there was a growing concern, over the week, that there could be a partial government shutdown, and that did indeed occur. At the same time, you can feel a sense building that the U.S. and China aren’t going to be able to reach a trade agreement on structural issues in the 90 day window. On top of all this you add in that estimated S&P earnings for the fourth quarter have fallen by 3.2% since September 30 and analysts have been reducing their growth expectations for 2019, with estimates of just 5-6% annualized earnings growth through the first three quarters of next year.
All of this adds up to the worst week since 2008.
Table of Contents
Fixed Income
FOMC December Statement Federal Reserve Dot Plots Dec 18 US Debt Measurement November Meeting Minutes US Corporate Debt Tops $6 Trillion
Global Bond Yields
The 2 year and 5-year yields are so close they round to even.
Foreign Exchange Market
The 2 year and Uncertainly around Brexit has kept pressure on the British Pound since April.
Energy Complex
Is $60 the new $80 for oil?
The Baker Hughes rig count showed a gain of 9 rigs this week. There are 1080 oil and gas rigs operating in the US. Up 149 over last year.
• Brent Crude Oil dropped 11.25% this week closing at $53.50/bbl.
• WTI Crude Oil lost 10.96% this week to close at $45.59/bbl.
• Heating Oil lost 6.52% this week closing at $1.725/gallon
• Natural Gas dropped 2.01% this week closing at $3.750 per million BTUs
• Unleaded Gas fell 8.94% this week at closing at $1.306/gallon
Metals Complex
Precious metals went nowhere this week.
• Gold rose 1.35% this week closing at $1258.10/oz
• Silver fell 0.44% on the week closing at $14.70/oz
• Palladium lost 1.10% this week closing at $1158.70/oz
• Copper fell 3.20% this week closing at $2.674 /lb.
Employment Picture
Weekly Unemployment Claims – Released Thursday 12/20 – In the week ending December 15th, initial claims were 214,000, an increase of 8,000 from the previous week’s unrevised level. The 4-week moving average was 222,000, an decrease of 2,750 from the previous week’s unrevised average.
Job Openings & Labor Turnover Survey – JOLTS Released Monday 12/10 – The number of job openings was a slight increase edging up by 0.1 million to 7.1 million on the last business day of October. Over the month, hires increased by 0.2 million to 5.9 million and separations declined slightly by 0.1 million to 5.6 million. Within separations, the quits rate saw a slight decline by 0.1 percent to 2.3 percent and the layoffs and discharges rate was unchanged at 1.1 percent.
November Jobs Report – BLS Summary Released 12/7 – The US Economy added 155k nonfarm jobs in November. The revision for October was downward by 13k and the revision for September was upward 1k. Hiring highlights include Education and Health care +34k, Professional and Business Services +32k, Manufacturing +27k, and Transportations and Warehousing +25k.
• Average hourly earnings increased by 6 cents/ 0.22% in November y/y hourly earnings are up 3.1%.
• U3 Civilian unemployment rate remained unchanged at 3.7%. U6 unemployment rate increased 0.2% to 7.6%
• The labor force participation rate was unchanged at 62.9%
• Average work week decreased by 0.1 hour to 34.4 hours.
Employment Cost Index – Released 10/31 – Compensation costs for civilian workers increased 2.8% for the 12-month period ending in September 2018 compared with a compensation costs increase of 2.5% in September 2017. Wages and salaries were up 2.9%, versus 2.5% for the 12-month period ending September 2017. Benefit costs increased 2.6%, versus 2.4% in September 2017. For private industry workers, compensation costs increased 2.9% year-over-year, versus 2.5% for the 12 months ending September 2017. Wages and salaries increased 3.1% year-over-year, versus 2.6% for the 12 months ending September 2017. Benefit costs increased 2.5%, versus 2.4% for the 12 months ending September 2017. This report is published quarterly.
This Week’s Economic Data
Personal Income – Released 12/21 – Personal Income increased 0.2% in November according to the BEA. The majority of this increase was due to increases in wages and salaries and increases in farm proprietor’s income. Real PCE (the Feds preferred inflation gauge) increased 0.3%. Real disposable personal income increased 0.2%. Real Personal Consumption Expenditures (PCE) has risen 1.8% y/y.
3rd Estimate of 3rd Quarter GDP – Released 12/21 – According to the third estimate released by the Bureau of Economic Analysis, Real Gross Domestic Product (Real GDP) increased at an annual rate of 3.4% in the third quarter of 2018. This result is slightly lower by 0.1% from 3.5% seen in the second estimate. The general outlook of real GDP remains roughly the same. The third estimate data provided an upward revision to private inventory investment. Downward revisions were reflected in personal consumption expenditures (PCE) and exports.
Durable Goods – Released 12/21 – New orders for manufactured durable goods increased $1.9 billion or 0.8% to $250.8 billion in November. This increase follows two consecutive months of decline. Transportation equipment, up 2.9%, drove the increase by $2.5 billion to $87 billion.
Existing Home Sales – Released 12/19 – Existing home sales increased 1.9% in November. Sales increased to a seasonally adjusted rate of 5.32 million. Sales are currently down 7.0% from one year ago. Housing inventory declined to 3.9 months of inventory and the existing homes for sale declined to 1.74 million. The median sales price for all types of homes was $257,700, up 4.2% year/y.
Housing Starts – Released 12/18 – New home starts in November were at a seasonally adjusted rate of 1.256 million; up 3.2% above October and down 3.6% from last November. Building Permits were at a seasonally adjusted rate of 1.328 million, up 5.0% compared to last month and up 0.4% over last year.
Recent Economic Data
Industrial Production and Capacity Utilization – Released 12/14 – Industrial production rose just 0.6% in November. Manufacturing output was unchanged. Capacity utilization gained 0.4% to78.5%. Utilization is 1.3% below its long run (1972-2017) average.
Retail Sales – Released 12/14 – Retail Sales increased by 0.2% to $513.5 billion in November. Year over year retail sales increased 4.3%.
Consumer Price Index – Released 12/12 – The Consumer Price Index was unchanged in November after an increase of 0.3 percent in October. For the 12 month period the index rose 2.2 percent before seasonal adjustment.
Producer Price Index – Released 12/11 – The Producer Price Index for final demand saw an increase of 0.1% in November. Core PPI (less food and energy) increased 0.3%. Year over year the index for final demand rose 2.5%.
Consumer Credit – Released 12/7 – Total outstanding consumer credit increased by 25.4 billion in October. Nonrevolving credit accounted for the majority of the gain. This results in an annual rate of 7.75%.
US Light Vehicle Sales – Released 12/6 – U.S. light vehicle sales were at a seasonally adjusted annual rate (SAAR) of 17.40 million units in November versus a SAAR of 17.49 million units in October. The November run rate was down 0.7% from the SAAR of 17.52 million units for November 2017.
PMI Non-Manufacturing Index (ISM Services) – Released 12/6 – The ISM Non-Manufacturing Index registered 0.4% points higher than last month at 60.7%. This represents continued growth in the non-manufacturing sector, at a slightly faster rate.
U.S. Trade Balance – Released 12/6 – The trade deficit rose $0.9 billion in October to – $55.5 billion. Exports were $211.0 billion while imports were $266.5 billion.
U.S. Construction Spending – Released 12/3 – Construction spending decreased slightly by 0.1% in October measuring at a seasonally adjusted annual rate of $1,308.8 billion. The October figure is 4.9% above the October 2017 estimate. Private construction spending was 0.4% below the revised September estimate.
PMI Manufacturing ISM Index – Released 12/3 – November PMI increased 1.6% to 59.3% from October’s reading of 57.7%. The New Orders Index was up 4.7% to 62.1%. The Production Index registered 60.6% up 0.7%.
Chicago PMI – Released 11/30 – Chicago PMI increased 8.0 points in November rising to an 11-month high of 66.4, up from 58.4 in October. The Prices Paid index remained locked in a historically elevated range.
New Residential Sales – Released 11/28 – Sales of new single-family homes declined in October by 8.9% to 544k, seasonally adjusted. The median sales price of new homes sold in October was $309.7k with an average sales price of $395.0k. At the end of October, the seasonally adjusted estimate of new homes for sale was 336k. This represents a supply of 7.4 months at the current sales rate.
Consumer Confidence – Released 11/27 – The Consumer confidence index declined in November. The Index now shows a reading of 135.7 down from 137.9 in October. Despite the decline in November, Consumer Confidence remains at historically strong levels. Should consumers’ assessment of the current conditions soften further; the pace of economic growth is likely to decline.
All sources linked HERE.
Categories:
Tags: