Good Life Advisors – Talking Points – Week 44
All Time Highs, Again
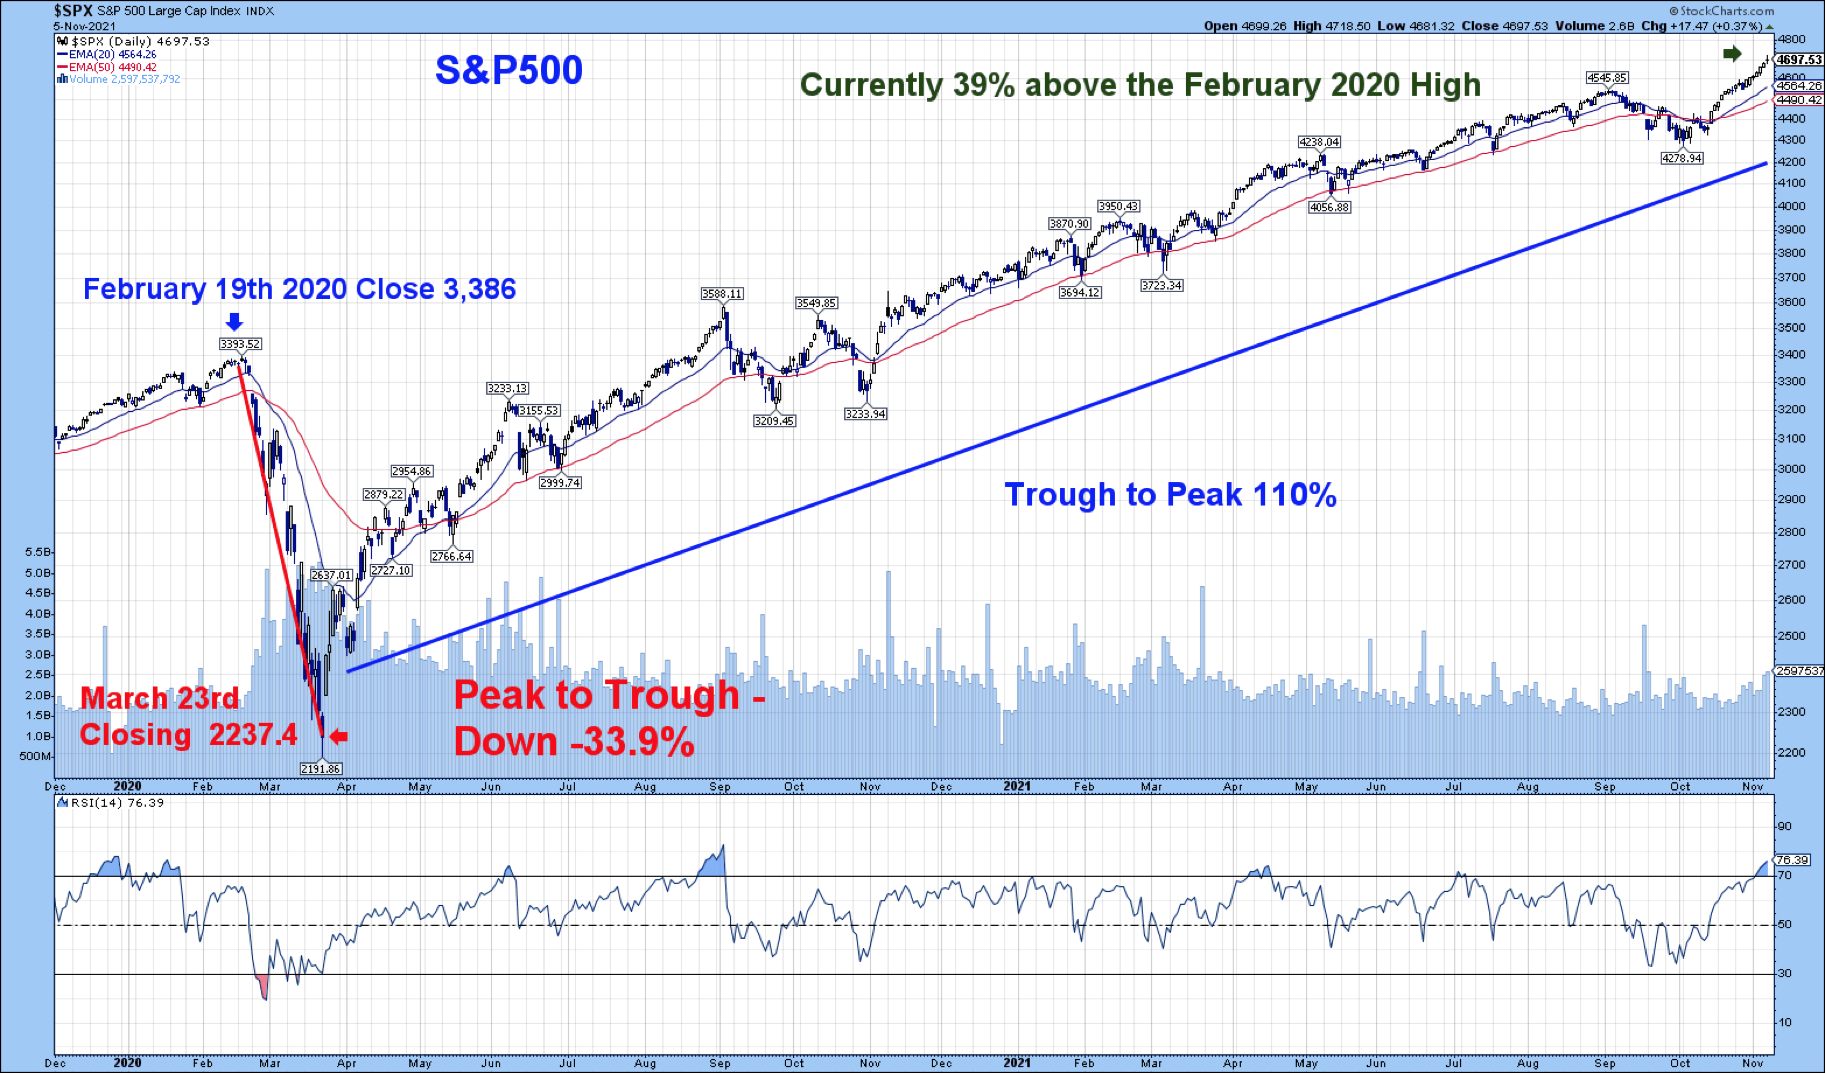
Positive earnings, continued covid improvement and a better-than-expected jobs report sent the equity markets to new all-time highs again. Adding to the sentiment was an expectation of the infrastructure bill being passed, which did happen later Friday evening. The measure passed 228-206. 13 Republicans joined most Democrats in support of the legislation, while six progressive Democrats voted against it. The October jobs report came in stronger than expected with the economy creating 531k jobs. The report also revised the August and September numbers higher by 235k.
The S&P500 is now up 39% from the February 2020 highs and up 110% of the March 2020 lows.
Small caps were the big winner this week with both the Russell 2000 and the S&P 600 breaking out after eight months of consolidation. On the earnings front, according to FactSet, just under 90% of S&P 500 companies have now reported Q3 results. The blended growth rate ended the week at 39.1%, up from the 27.5% expected at the end of the quarter. In aggregate, companies have reported earnings 10.3% above expectations, below the 18.0% one-year average positive surprise rate but better than the five-year average of 8.4%. The big themes have been fairly consistent throughout earnings season. Supply chain disruptions have dominated the narrative, impacting seemingly every industry. Companies have flagged lost sales due to procurement issues, along with the more widely discussed input price pressures. Q3 has also seen a notable pickup in mentions about labor shortages and higher wages as sales and margin headwinds. However, margins have managed to hold near record levels on the back of a combination of robust demand, pricing power and productivity measures (Goldman Sachs highlighted the automation theme in its S&P 500 Beige Book). One of the big themes this week revolved around the better sentiment surrounding results from reopening plays vs the scrutiny on pandemic winners.

Fixed Income
September FOMC Statement Credit, Liquidity and Balance Sheet Federal Reserve Dot Plots Sep 21′
US Corporate Debt Tops 7 Trillion. Treasury.gov yields FOMC Policy Normalization Statement Longer Run Goals August 2020
Global Bond Yields
Daily US Treasury Yields
Foreign Exchange Market
Energy Complex
The Baker Hughes rig count increased by 6 this week. There are 550 oil and gas rigs operating in the US – Up 250 over last year.
Metals Complex
Employment Picture
October Jobs Report – BLS Summary Released 11/5/2021 – The US Economy added 531k nonfarm jobs in September and the Unemployment rate edged down to 4.6%. Average hourly earnings increased by 11 cents to $30.96. Hiring highlights include +164k Leisure and Hospitality, +100k Professional and Business Services, and +60 in Manufacturing.
- Average hourly earnings increased by 11 cents or 0.4%.
- U3 unemployment rate declined 0.4% to 4.8%. U6 unemployment rate declined to 8.5%.
- The labor force participation rate was unchanged changed at 61.6%.
- Average work week decreased 0.1 hours to 34.7 hours.
Weekly Unemployment Claims – Released Thursday 11/4/2021 – The week ending October 30th experienced a decrease of 14k in initial claims declining to 269k. This marks the lowest level of initial claims since March 14, 2020. The four-week moving average of initial jobless claims decreased 15k to 284.75k.
Employment Cost Index – Released 10/29/2021 – Compensation costs for civilian workers increased 1.3% for the 3-month period ending in September 2021. The 12-month period ending in September 2021 saw compensation costs increase by 3.7%. The 12-month period ending September 2020 increased 2.4%. Wages and salaries increased 4.2 percent over the year and increased 2.5 percent for the 12-month period ending in September 2020. Benefit costs increased 2.5 percent over the year and increased 2.3 percent for the 12-month period ending in September 2020. This report is published quarterly.
Job Openings & Labor Turnover Survey JOLTS – Released 10/12/2021 – The U.S. Bureau of Labor Statistics reported the number and rate of job openings decreased to 10.4 million on the last business day of August. Over the month, hires decreased to 6.3 million and separations were little changed at 6.0 million. Within separations, the quits rate increased to 2.9%. The layoffs and discharges rates were little changed at 0.9%.
This Week’s Economic Data
Links take you to the data source
Consumer Credit – Released 11/5/2021 – Consumer credit increased at a seasonally adjusted annual rate of 5.6 percent in August. Revolving credit increased at an annual rate of 7.4 percent, while nonrevolving credit increased at an annual rate of 5.1 percent.
U.S. Trade Balance – Released 11/4/2021 – According to the U.S. Census Bureau of Economic Analysis the goods and services deficit increased in September by $8.1 billion to $80.9 billion. September exports were $207.6 billion, $6.4 billion less than August exports. September imports were $288.5 billion, $1.7 billion more than August imports. Year to date the goods and services deficit increased $158.7 billion or 33.1%, from the same period in 2020. Year to date exports and imports increased $274.1 billion or 17.4% and increased $432.8 billion or 21.1% respectively.
PMI Non-Manufacturing Index – Released 11/3/2021 – Economic activity in the non-manufacturing sector grew in October for the 17th consecutive month. ISM Non-Manufacturing registered 66.7 percent, which is 4.8 percentage points above the adjusted September reading of 61.9 percent.
PMI Manufacturing Index – Released 11/1/2021 – October PMI decreased 0.3% to 60.8% down from September’s reading of 61.1%. The New Orders Index was 59.8% down 6.9% from September’s reading of 66.7%. The Production Index registered 59.3%, down 0.1%.
U.S. Construction Spending– Released 11/1/2021 – Construction spending declined 0.5% in September measuring at a seasonally adjusted annual rate of $1,573.6 billion. The September figure is 7.8% above the September 2020 estimate. Private construction spending was 0.5% below the revised August estimate at $1,229.9 billion. Public construction spending was 0.7% below the revised August estimate at $343.7 billion.
Recent Economic Data
Links take you to the data source
US Light Vehicle Sales – Released 10/29/2021 – U.S. light vehicle sales were at a seasonally adjusted annual rate (SAAR) of 12.158 million units in September.
Chicago PMI – Released 10/29/2021 – Chicago PMI increased to 68.4 points in October, following two months of decline. Among the main five indicators, four were higher, led by Order backlogs and Employment. Only Production fell across the month.
Personal Income – Released 10/29/2021 – Personal income decreased $216.2 billion or 1.0 percent in September according to estimates released today by the Bureau of Economic Analysis. Disposable personal income (DPI) decreased $236.9 billion or 1.3 percent and personal consumption expenditures (PCE) increased $93.4 billion or 0.6 percent.
Advance Estimate of 3rd Quarter 2021 GDP – Released 10/28/2021 – Real gross domestic product (GDP) increased at an annual rate of 2.0 percent in the third quarter of 2021, according to the advance estimate released by the Bureau of Economic Analysis. GDP increased 6.7% in the second quarter of 2021. The advance estimate is based on source data that are incomplete or subject to further revision. The increase in real GDP in the third quarter reflected increases in private inventory investment, personal consumption expenditures (PCE), state and local government spending, and nonresidential fixed investment that were partly offset by decreases in residential fixed investment, federal government spending, and exports. Imports, which are a subtraction in the calculation of GDP, increased.
Durable Goods – Released 10/27/2021 – New orders for manufactured durable goods in September decreased $1.0 billion or 0.4% to $261.3 billion. Transportation equipment led the decrease falling $1.8 billion or 2.3% to $77.7 billion.
New Residential Sales – Released 10/26/2021 – Sales of new single-family homes increased 14.0% to 800k, seasonally adjusted, in September. The median sales price of new homes sold in September was $408,800 with an average sales price of $451,700. At the end of September, the seasonally adjusted estimate of new homes for sale was 379k. This represents a supply of 5.7 months at the current sales rate.
Consumer Confidence – Released 10/26/2021 – The Consumer confidence index increased in October. The Index now stands at 113.8, up from 109.8 in September.
Existing Home Sales – Released 10/21/2021 – Existing home sales increased in September. Sales rose 7.0% to a seasonally adjusted rate of 6.29 million in September. Sales are currently down 2.3% from one year ago. Housing inventory sits at 1.27 million units. Down 0.8% from August’s inventory. Down 13.0% over last year. Unsold inventory sits at a 2.4-month supply. The median existing home price for all housing types was $352,800.
Housing Starts – Released 10/19/2021 – New home starts in September were at a seasonally adjusted annual rate of 1.555 million; down 1.6% below August, but 7.4% above last September’s rate. Building Permits were at a seasonally adjusted annual rate of 1.589 million, down 7.7% compared to August, and virtually unchanged over last year.
Industrial Production and Capacity Utilization – Released 10/18/2021 – In September Industrial production declined 1.3%. Manufacturing decreased 0.7%. Motor Vehicles and parts, still limited by semiconductor shortages, declined 7.2%. Mining decreased 2.3%. Utilities output decreased 3.6%. Total industrial production was 4.6% higher in September than a year ago. Total capacity utilization decreased 1.0% to 75.2% in September which is 4.4% below its long run average.
Retail Sales – Released 10/15/2021 – U.S. retail sales for September increased 0.7% to $625.4 billion and retail sales are 13.9% above September 2020. U.S. retail sales for the July 2021 through September 2021 period were up 14.9% from the same period a year ago.
Producer Price Index – Released 10/14/2021 – The Producer Price Index for final demand increased 0.5% in September. PPI less food and energy increased 0.6% in September. The change in PPI for final demand has increased 8.6% year/y.
Consumer Price Index – Released 10/13/2021 – Consumer prices rose 0.4% m/m in September following a 0.3% gain in August. Core consumer prices increased 0.2% m/m in September following a 0.1% gain in August.
Next week we get data on CPI, PPI, and JOLTS.
Data Sources:
Bureau of Economic Analysis (BEA)
Congressional Budget Office (CBO)
U.S. Bureau of Labor Statistics (BLS)
Federal Reserve Economic Data (FRED Charts)
CME Fed Watch
U.S. Treasury – Yields
U.S. Census Bureau
Institute for Supply Management (ISM)
Weekly DOL Employment Data
BLS Monthly Jobs Report
JOLTS
US Energy Admin (EIA)
BLS Consumer Price Index CPI
BLS Producer Price Index PPI
Atlanta Fed GDPNOW
NY Fed Nowcast GDP
US Census Bureau Housing Starts
Consumer Credit
USCB Retail Sales
Construction Spending
Federal Reserve Dot Plots
NY Empire Index
Philadelphia Federal Reserve
P/E Ratio Data -Yardeni Research
Technical Analysis Info:
StockCharts.com – Financial Charts
Exponential vs Simple moving average
Other Links:
1973 Arab Oil Embargo
Hunt Brothers Silver
Long-Term Capital bailout


Week 44 Talking Points
Good Life Advisors – Talking Points – Week 44
All Time Highs, Again
Positive earnings, continued covid improvement and a better-than-expected jobs report sent the equity markets to new all-time highs again. Adding to the sentiment was an expectation of the infrastructure bill being passed, which did happen later Friday evening. The measure passed 228-206. 13 Republicans joined most Democrats in support of the legislation, while six progressive Democrats voted against it. The October jobs report came in stronger than expected with the economy creating 531k jobs. The report also revised the August and September numbers higher by 235k.
The S&P500 is now up 39% from the February 2020 highs and up 110% of the March 2020 lows.
Small caps were the big winner this week with both the Russell 2000 and the S&P 600 breaking out after eight months of consolidation. On the earnings front, according to FactSet, just under 90% of S&P 500 companies have now reported Q3 results. The blended growth rate ended the week at 39.1%, up from the 27.5% expected at the end of the quarter. In aggregate, companies have reported earnings 10.3% above expectations, below the 18.0% one-year average positive surprise rate but better than the five-year average of 8.4%. The big themes have been fairly consistent throughout earnings season. Supply chain disruptions have dominated the narrative, impacting seemingly every industry. Companies have flagged lost sales due to procurement issues, along with the more widely discussed input price pressures. Q3 has also seen a notable pickup in mentions about labor shortages and higher wages as sales and margin headwinds. However, margins have managed to hold near record levels on the back of a combination of robust demand, pricing power and productivity measures (Goldman Sachs highlighted the automation theme in its S&P 500 Beige Book). One of the big themes this week revolved around the better sentiment surrounding results from reopening plays vs the scrutiny on pandemic winners.
Table of Contents
Fixed Income
September FOMC Statement Credit, Liquidity and Balance Sheet Federal Reserve Dot Plots Sep 21′
US Corporate Debt Tops 7 Trillion. Treasury.gov yields FOMC Policy Normalization Statement Longer Run Goals August 2020
Global Bond Yields
Daily US Treasury Yields
Foreign Exchange Market
Energy Complex
The Baker Hughes rig count increased by 6 this week. There are 550 oil and gas rigs operating in the US – Up 250 over last year.
Metals Complex
Employment Picture
October Jobs Report – BLS Summary Released 11/5/2021 – The US Economy added 531k nonfarm jobs in September and the Unemployment rate edged down to 4.6%. Average hourly earnings increased by 11 cents to $30.96. Hiring highlights include +164k Leisure and Hospitality, +100k Professional and Business Services, and +60 in Manufacturing.
Weekly Unemployment Claims – Released Thursday 11/4/2021 – The week ending October 30th experienced a decrease of 14k in initial claims declining to 269k. This marks the lowest level of initial claims since March 14, 2020. The four-week moving average of initial jobless claims decreased 15k to 284.75k.
Employment Cost Index – Released 10/29/2021 – Compensation costs for civilian workers increased 1.3% for the 3-month period ending in September 2021. The 12-month period ending in September 2021 saw compensation costs increase by 3.7%. The 12-month period ending September 2020 increased 2.4%. Wages and salaries increased 4.2 percent over the year and increased 2.5 percent for the 12-month period ending in September 2020. Benefit costs increased 2.5 percent over the year and increased 2.3 percent for the 12-month period ending in September 2020. This report is published quarterly.
Job Openings & Labor Turnover Survey JOLTS – Released 10/12/2021 – The U.S. Bureau of Labor Statistics reported the number and rate of job openings decreased to 10.4 million on the last business day of August. Over the month, hires decreased to 6.3 million and separations were little changed at 6.0 million. Within separations, the quits rate increased to 2.9%. The layoffs and discharges rates were little changed at 0.9%.
This Week’s Economic Data
Links take you to the data source
Consumer Credit – Released 11/5/2021 – Consumer credit increased at a seasonally adjusted annual rate of 5.6 percent in August. Revolving credit increased at an annual rate of 7.4 percent, while nonrevolving credit increased at an annual rate of 5.1 percent.
U.S. Trade Balance – Released 11/4/2021 – According to the U.S. Census Bureau of Economic Analysis the goods and services deficit increased in September by $8.1 billion to $80.9 billion. September exports were $207.6 billion, $6.4 billion less than August exports. September imports were $288.5 billion, $1.7 billion more than August imports. Year to date the goods and services deficit increased $158.7 billion or 33.1%, from the same period in 2020. Year to date exports and imports increased $274.1 billion or 17.4% and increased $432.8 billion or 21.1% respectively.
PMI Non-Manufacturing Index – Released 11/3/2021 – Economic activity in the non-manufacturing sector grew in October for the 17th consecutive month. ISM Non-Manufacturing registered 66.7 percent, which is 4.8 percentage points above the adjusted September reading of 61.9 percent.
PMI Manufacturing Index – Released 11/1/2021 – October PMI decreased 0.3% to 60.8% down from September’s reading of 61.1%. The New Orders Index was 59.8% down 6.9% from September’s reading of 66.7%. The Production Index registered 59.3%, down 0.1%.
U.S. Construction Spending– Released 11/1/2021 – Construction spending declined 0.5% in September measuring at a seasonally adjusted annual rate of $1,573.6 billion. The September figure is 7.8% above the September 2020 estimate. Private construction spending was 0.5% below the revised August estimate at $1,229.9 billion. Public construction spending was 0.7% below the revised August estimate at $343.7 billion.
Recent Economic Data
Links take you to the data source
US Light Vehicle Sales – Released 10/29/2021 – U.S. light vehicle sales were at a seasonally adjusted annual rate (SAAR) of 12.158 million units in September.
Chicago PMI – Released 10/29/2021 – Chicago PMI increased to 68.4 points in October, following two months of decline. Among the main five indicators, four were higher, led by Order backlogs and Employment. Only Production fell across the month.
Personal Income – Released 10/29/2021 – Personal income decreased $216.2 billion or 1.0 percent in September according to estimates released today by the Bureau of Economic Analysis. Disposable personal income (DPI) decreased $236.9 billion or 1.3 percent and personal consumption expenditures (PCE) increased $93.4 billion or 0.6 percent.
Advance Estimate of 3rd Quarter 2021 GDP – Released 10/28/2021 – Real gross domestic product (GDP) increased at an annual rate of 2.0 percent in the third quarter of 2021, according to the advance estimate released by the Bureau of Economic Analysis. GDP increased 6.7% in the second quarter of 2021. The advance estimate is based on source data that are incomplete or subject to further revision. The increase in real GDP in the third quarter reflected increases in private inventory investment, personal consumption expenditures (PCE), state and local government spending, and nonresidential fixed investment that were partly offset by decreases in residential fixed investment, federal government spending, and exports. Imports, which are a subtraction in the calculation of GDP, increased.
Durable Goods – Released 10/27/2021 – New orders for manufactured durable goods in September decreased $1.0 billion or 0.4% to $261.3 billion. Transportation equipment led the decrease falling $1.8 billion or 2.3% to $77.7 billion.
New Residential Sales – Released 10/26/2021 – Sales of new single-family homes increased 14.0% to 800k, seasonally adjusted, in September. The median sales price of new homes sold in September was $408,800 with an average sales price of $451,700. At the end of September, the seasonally adjusted estimate of new homes for sale was 379k. This represents a supply of 5.7 months at the current sales rate.
Consumer Confidence – Released 10/26/2021 – The Consumer confidence index increased in October. The Index now stands at 113.8, up from 109.8 in September.
Existing Home Sales – Released 10/21/2021 – Existing home sales increased in September. Sales rose 7.0% to a seasonally adjusted rate of 6.29 million in September. Sales are currently down 2.3% from one year ago. Housing inventory sits at 1.27 million units. Down 0.8% from August’s inventory. Down 13.0% over last year. Unsold inventory sits at a 2.4-month supply. The median existing home price for all housing types was $352,800.
Housing Starts – Released 10/19/2021 – New home starts in September were at a seasonally adjusted annual rate of 1.555 million; down 1.6% below August, but 7.4% above last September’s rate. Building Permits were at a seasonally adjusted annual rate of 1.589 million, down 7.7% compared to August, and virtually unchanged over last year.
Industrial Production and Capacity Utilization – Released 10/18/2021 – In September Industrial production declined 1.3%. Manufacturing decreased 0.7%. Motor Vehicles and parts, still limited by semiconductor shortages, declined 7.2%. Mining decreased 2.3%. Utilities output decreased 3.6%. Total industrial production was 4.6% higher in September than a year ago. Total capacity utilization decreased 1.0% to 75.2% in September which is 4.4% below its long run average.
Retail Sales – Released 10/15/2021 – U.S. retail sales for September increased 0.7% to $625.4 billion and retail sales are 13.9% above September 2020. U.S. retail sales for the July 2021 through September 2021 period were up 14.9% from the same period a year ago.
Producer Price Index – Released 10/14/2021 – The Producer Price Index for final demand increased 0.5% in September. PPI less food and energy increased 0.6% in September. The change in PPI for final demand has increased 8.6% year/y.
Consumer Price Index – Released 10/13/2021 – Consumer prices rose 0.4% m/m in September following a 0.3% gain in August. Core consumer prices increased 0.2% m/m in September following a 0.1% gain in August.
Next week we get data on CPI, PPI, and JOLTS.
Data Sources:
Bureau of Economic Analysis (BEA)
Congressional Budget Office (CBO)
U.S. Bureau of Labor Statistics (BLS)
Federal Reserve Economic Data (FRED Charts)
CME Fed Watch
U.S. Treasury – Yields
U.S. Census Bureau
Institute for Supply Management (ISM)
Weekly DOL Employment Data
BLS Monthly Jobs Report
JOLTS
US Energy Admin (EIA)
BLS Consumer Price Index CPI
BLS Producer Price Index PPI
Atlanta Fed GDPNOW
NY Fed Nowcast GDP
US Census Bureau Housing Starts
Consumer Credit
USCB Retail Sales
Construction Spending
Federal Reserve Dot Plots
NY Empire Index
Philadelphia Federal Reserve
P/E Ratio Data -Yardeni Research
Technical Analysis Info:
StockCharts.com – Financial Charts
Exponential vs Simple moving average
Other Links:
1973 Arab Oil Embargo
Hunt Brothers Silver
Long-Term Capital bailout
Categories:
Tags: