Good Life Advisors – Talking Points – Week 40
Delta Blunts Jobs
The Delta variants’ threat to job growth, inflation and global supply chains is really starting to show. Friday’s September jobs report came in much lower than expected as the economy generated just 194k new positions in September. 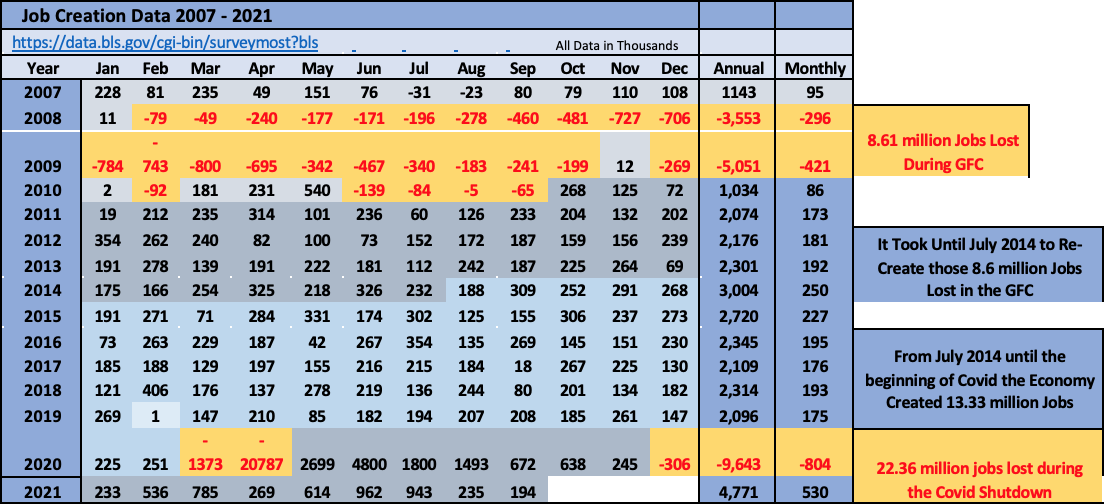
May, June, and July the economy was on a tear averaging over 800k a month. As the delta variant exploded job growth slowed dramatically. We are still five million jobs below pre-covid levels of employment.

US equities finished mostly higher this week after coming under pressure in the prior week. Value and cyclicals outperformed growth. Energy rallied sharply with oil up for a seventh straight week as OPEC maintained its gradual production increase plans. Financials outperformed with help from the higher rate backdrop. Tech lagged with some sluggishness in the semis though big software names did well. Communications services ended down with FB (3.8%) under scrutiny on the whistleblower headlines though GOOGL +2.4% outperformed, as did NFLX +3.2% and TWTR +2.7%. Treasuries were weaker across the curve with 10-year yields up 13 bp to 1.60%. The dollar index gained 0.1%. Gold ended slightly lower. WTI crude rallied nearly 5%.
This week’s upside seemed to largely be a function of oversold conditions and a deal to raise the debt ceiling. The bigger story was the heightened push and pull surrounding the higher-profile debates in the market right now, including buy-the-dip vs sell-the-rip. The debt ceiling deal was a positive but the market never realty seemed fearful of a default, and it only punts the issue to December when the same partisan battles will play out. Moderates and progressives have narrowed the gap over the topline figure for a social spending bill focused on Democratic priorities though the path to additional fiscal stimulus remains complicated given all the decisions about what programs should be reduced. While economic surprise momentum has improved, fitting with the better Covid trends, nonfarm payrolls came in well below expectations for a second straight month in September. In addition, an increasingly global energy crunch dominated the headlines and drove a further pickup in stagflation fears. The energy crunch has also played a role in the backup in bond yields, which while positive for cyclical rotations, carries risks for both growth plays and the broader market via multiple contraction. While the upcoming Q3 earnings season should highlight a strong demand backdrop, more persistent supply chain and input price pressures could translate to smaller beats and provide more fodder for peak margin concerns.
Fixed Income
The 10 Year US Treasury yield jumped this week to 1.61%. The two-year yield also pops to a post-covid high of 32 bps. This pushed most all bond prices down (except TIPS).
September FOMC Statement Credit, Liquidity and Balance Sheet Federal Reserve Dot Plots Sep 21′ US Corporate Debt Tops 7 Trillion. Treasury.gov yields FOMC Policy Normalization Statement Longer Run Goals August 2020
Global Bond Yields
Daily US Treasury Yields
Foreign Exchange Market
Energy Complex
The Baker Hughes rig count increased by 5 this week. There are 533 oil and gas rigs operating in the US – Up 264 over last year.
Metals Complex
Employment Picture
September Jobs Report – BLS Summary Released 10/8/2021 – The US Economy added 194k nonfarm jobs in September and the Unemployment rate declined 0.4% to 4.8. Average hourly earnings increased by 19 cents to $30.85. Hiring highlights include +74k Leisure and Hospitality, +60k Professional and Business Services, and +47 Transportation and Warehousing.
- Average hourly earnings increased by 19 cents to $30.85.
- U3 unemployment rate declined 0.4% to 4.8%. U6 unemployment rate declined to 8.5%.
- The labor force participation rate was little changed at 61.6%.
- Average work week increased 0.2 hours to 34.8 hours.
Weekly Unemployment Claims – Released Thursday 10/7/2021 – The week ending October 2nd experienced a decrease of 38k in initial claims declining to 326k. The four-week moving average of initial jobless claims increased 3.5k to 344k.
Job Openings & Labor Turnover Survey JOLTS – Released 9/8/2021 – The U.S. Bureau of Labor Statistics reported the number and rate of job openings increased to 10.9 million on the last business day of July. Over the month, hires were little changed at 6.7 million and separations were little changed at 5.8 million. Within separations, the quits rate was unchanged at 2.7%. The layoffs and discharges rates were little changed at 1.0%.
Employment Cost Index – Released 7/30/2021 – Compensation costs for civilian workers increased 0.7% for the 3-month period ending in June 2021. The 12-month period ending in June 2021 saw compensation costs increase by 2.9%. The 12-month period ending June 2020 increased 2.7%. Wages and salaries increased 3.2 percent over the year and increased 2.9 percent for the 12-month period ending in June 2020. Benefit costs increased 2.2 percent over the year and increased 2.2 percent for the 12-month period ending in June 2020. This report is published quarterly.
This Week’s Economic Data
Links take you to the data source
US Light Vehicle Sales – Released 10/8/2021 – U.S. light vehicle sales were at a seasonally adjusted annual rate (SAAR) of 12.176 million units in September.
Consumer Credit – Released 10/7/2021 – Consumer credit increased at a seasonally adjusted annual rate of 4.0 percent in August. Revolving credit increased at an annual rate of 3.6 percent, while nonrevolving credit increased at an annual rate of 4.1 percent.
PMI Non-Manufacturing Index – Released 10/5/2021 – Economic activity in the non-manufacturing sector grew in September for the 16th consecutive month. ISM Non-Manufacturing registered 61.9 percent, which is 0.2 percentage points above the adjusted August reading of 61.7 percent.
U.S. Trade Balance – Released 10/5/2021 – According to the U.S. Census Bureau of Economic Analysis the goods and services deficit increased in August by $2.9 billion to $73.3 billion. August exports were $213.7 billion, $1.0 billion more than July exports. August imports were $287.0 billion, $4.0 billion more than July imports. Year to date the goods and services deficit increased $140.8 billion or 33.7%, from the same period in 2020. Year to date exports and imports increased $244.3 billion or 17.5% and increased $385.1 billion or 21.2% respectively.
Recent Economic Data
Links take you to the data source
PMI Manufacturing Index – Released 10/1/2021 – September PMI increased 1.2% to 61.1% up from August’s reading of 59.9%. The New Orders Index was unchanged from August’s reading of 66.7%. The Production Index registered 59.4%, down 0.6%.
U.S. Construction Spending – Released 10/1/2021 – Construction spending was relatively unchanged in August measuring at a seasonally adjusted annual rate of $1,584.1 billion. The August figure is 8.9% above the August 2020 estimate. Private construction spending was 0.1% below the revised July estimate at $1,243.7 billion. Public construction spending was 0.5% above the revised July estimate at $341.9 billion.
Personal Income – Released 10/1/2021 – Personal income increased $35.5 billion or 0.2 percent in August according to estimates released today by the Bureau of Economic Analysis. Disposable personal income (DPI) increased $18.9 billion or 0.1 percent and personal consumption expenditures (PCE) increased $130.5 billion or 0.8 percent.
Third Estimate of 2nd Quarter 2021 GDP – Released 9/30/2021 – Real gross domestic product (GDP) increased at an annual rate of 6.7 percent in the second quarter of 2021, according to the third estimate released by the Bureau of Economic Analysis. The third GDP estimate is based on more complete source data than were available for the “second” and “advance” estimates. In the second estimate, the increase in real GDP was 6.6 percent. The first quarter observed a 6.3 percent increase in real GDP. The third estimate observed upward revisions to personal consumption expenditures (PCE), exports, and private inventory investment were partly offset by an upward revision to imports, which are a subtraction in the calculation of GDP. The increase in real GDP in the second quarter reflected increases in PCE, nonresidential fixed investment, exports, and state and local government spending that were partly offset by decreases in private inventory investment, residential fixed investment, and federal government spending. Imports, which are a subtraction in the calculation of GDP, increased.
Chicago PMI – Released 9/30/2021 – Chicago PMI decreased to 64.7 points in September, the lowest level since February. Among the main five indicators, Order Backlogs saw the largest decline, followed by Supplier Deliveries and New Orders. Only Employment increased through the month.
Consumer Confidence – Released 9/28/2021 – The Consumer confidence index declined in September. The Index now stands at 109.3, down from 115.2 in August.
Durable Goods – Released 9/27/2021 – New orders for manufactured durable goods in August increased $4.6 billion or 1.8% to $263.5 billion. Transportation equipment led the increase rising $4.2 billion or 5.5% to $80.8 billion.
New Residential Sales – Released 9/24/2021 – Sales of new single-family homes increased 1.5% to 740k, seasonally adjusted, in August. The median sales price of new homes sold in August was $390,900 with an average sales price of $443,200. At the end of August, the seasonally adjusted estimate of new homes for sale was 378k. This represents a supply of 6.1 months at the current sales rate.
Existing Home Sales – Released 9/22/2021 – Existing home sales declined in August. Sales decreased 2.0% to a seasonally adjusted rate of 5.88 million in August. Sales are currently down 1.5% from one year ago. Housing inventory sits at 1.29 million units. Down 1.5% from July’s inventory. Down 13.4% over last year. Unsold inventory sits at a 2.6-month supply. The median existing home price for all housing types was $356,700.
Housing Starts – Released 9/21/2021 – New home starts in August were at a seasonally adjusted annual rate of 1.615 million; up 3.9% above July, and 17.4% above last August’s rate. Building Permits were at a seasonally adjusted annual rate of 1.728 million, up 6.0% compared to July, and up 13.5% over last year.
Retail Sales – Released 9/16/2021 – U.S. retail sales for August increased 0.7% to $618.7 billion and retail sales are 15.1% above August 2020. U.S. retail sales are up 13.1% year/y.
Industrial Production and Capacity Utilization – Released 9/15/2021 – In August Industrial production increased 0.4%. Manufacturing increased 0.2%. Mining decreased 0.6%. Utilities output increased 3.3%. Total industrial production was 5.9% higher in August than a year ago, and 0.3% above its pre-pandemic level. Total capacity utilization increased 0.2% to 76.4% in August which is 3.2% below its long run average.
Consumer Price Index – Released 9/14/2021 – Consumer prices rose 0.3% m/m in August following a 0.5% gain in July. Core consumer prices increased 0.1% m/m in August following a 0.3% gain in July.
Producer Price Index – Released 9/10/2021 – The Producer Price Index for final demand increased 0.7% in August. PPI less food and energy increased 0.6% in August. The change in PPI for final demand has increased 8.3% year/y.
Next week we get data on PPI, CPI, Industrial Production and Capacity Utilization, Retail Sales, and JOLTS.
Data Sources:
Bureau of Economic Analysis (BEA)
Congressional Budget Office (CBO)
U.S. Bureau of Labor Statistics (BLS)
Federal Reserve Economic Data (FRED Charts)
CME Fed Watch
U.S. Treasury – Yields
U.S. Census Bureau
Institute for Supply Management (ISM)
Weekly DOL Employment Data
BLS Monthly Jobs Report
JOLTS
US Energy Admin (EIA)
BLS Consumer Price Index CPI
BLS Producer Price Index PPI
Atlanta Fed GDPNOW
NY Fed Nowcast GDP
US Census Bureau Housing Starts
Consumer Credit
USCB Retail Sales
Construction Spending
Federal Reserve Dot Plots
NY Empire Index
Philadelphia Federal Reserve
P/E Ratio Data -Yardeni Research
Technical Analysis Info:
StockCharts.com – Financial Charts
Exponential vs Simple moving average
Other Links:
1973 Arab Oil Embargo
Hunt Brothers Silver
Long-Term Capital bailout


Week 40 Talking Points
Good Life Advisors – Talking Points – Week 40
Delta Blunts Jobs
The Delta variants’ threat to job growth, inflation and global supply chains is really starting to show. Friday’s September jobs report came in much lower than expected as the economy generated just 194k new positions in September.
May, June, and July the economy was on a tear averaging over 800k a month. As the delta variant exploded job growth slowed dramatically. We are still five million jobs below pre-covid levels of employment.
US equities finished mostly higher this week after coming under pressure in the prior week. Value and cyclicals outperformed growth. Energy rallied sharply with oil up for a seventh straight week as OPEC maintained its gradual production increase plans. Financials outperformed with help from the higher rate backdrop. Tech lagged with some sluggishness in the semis though big software names did well. Communications services ended down with FB (3.8%) under scrutiny on the whistleblower headlines though GOOGL +2.4% outperformed, as did NFLX +3.2% and TWTR +2.7%. Treasuries were weaker across the curve with 10-year yields up 13 bp to 1.60%. The dollar index gained 0.1%. Gold ended slightly lower. WTI crude rallied nearly 5%.
This week’s upside seemed to largely be a function of oversold conditions and a deal to raise the debt ceiling. The bigger story was the heightened push and pull surrounding the higher-profile debates in the market right now, including buy-the-dip vs sell-the-rip. The debt ceiling deal was a positive but the market never realty seemed fearful of a default, and it only punts the issue to December when the same partisan battles will play out. Moderates and progressives have narrowed the gap over the topline figure for a social spending bill focused on Democratic priorities though the path to additional fiscal stimulus remains complicated given all the decisions about what programs should be reduced. While economic surprise momentum has improved, fitting with the better Covid trends, nonfarm payrolls came in well below expectations for a second straight month in September. In addition, an increasingly global energy crunch dominated the headlines and drove a further pickup in stagflation fears. The energy crunch has also played a role in the backup in bond yields, which while positive for cyclical rotations, carries risks for both growth plays and the broader market via multiple contraction. While the upcoming Q3 earnings season should highlight a strong demand backdrop, more persistent supply chain and input price pressures could translate to smaller beats and provide more fodder for peak margin concerns.
Table of Contents
Fixed Income
The 10 Year US Treasury yield jumped this week to 1.61%. The two-year yield also pops to a post-covid high of 32 bps. This pushed most all bond prices down (except TIPS).
September FOMC Statement Credit, Liquidity and Balance Sheet Federal Reserve Dot Plots Sep 21′ US Corporate Debt Tops 7 Trillion. Treasury.gov yields FOMC Policy Normalization Statement Longer Run Goals August 2020
Global Bond Yields
Daily US Treasury Yields
Foreign Exchange Market
Energy Complex
The Baker Hughes rig count increased by 5 this week. There are 533 oil and gas rigs operating in the US – Up 264 over last year.
Metals Complex
Employment Picture
September Jobs Report – BLS Summary Released 10/8/2021 – The US Economy added 194k nonfarm jobs in September and the Unemployment rate declined 0.4% to 4.8. Average hourly earnings increased by 19 cents to $30.85. Hiring highlights include +74k Leisure and Hospitality, +60k Professional and Business Services, and +47 Transportation and Warehousing.
Weekly Unemployment Claims – Released Thursday 10/7/2021 – The week ending October 2nd experienced a decrease of 38k in initial claims declining to 326k. The four-week moving average of initial jobless claims increased 3.5k to 344k.
Job Openings & Labor Turnover Survey JOLTS – Released 9/8/2021 – The U.S. Bureau of Labor Statistics reported the number and rate of job openings increased to 10.9 million on the last business day of July. Over the month, hires were little changed at 6.7 million and separations were little changed at 5.8 million. Within separations, the quits rate was unchanged at 2.7%. The layoffs and discharges rates were little changed at 1.0%.
Employment Cost Index – Released 7/30/2021 – Compensation costs for civilian workers increased 0.7% for the 3-month period ending in June 2021. The 12-month period ending in June 2021 saw compensation costs increase by 2.9%. The 12-month period ending June 2020 increased 2.7%. Wages and salaries increased 3.2 percent over the year and increased 2.9 percent for the 12-month period ending in June 2020. Benefit costs increased 2.2 percent over the year and increased 2.2 percent for the 12-month period ending in June 2020. This report is published quarterly.
This Week’s Economic Data
Links take you to the data source
US Light Vehicle Sales – Released 10/8/2021 – U.S. light vehicle sales were at a seasonally adjusted annual rate (SAAR) of 12.176 million units in September.
Consumer Credit – Released 10/7/2021 – Consumer credit increased at a seasonally adjusted annual rate of 4.0 percent in August. Revolving credit increased at an annual rate of 3.6 percent, while nonrevolving credit increased at an annual rate of 4.1 percent.
PMI Non-Manufacturing Index – Released 10/5/2021 – Economic activity in the non-manufacturing sector grew in September for the 16th consecutive month. ISM Non-Manufacturing registered 61.9 percent, which is 0.2 percentage points above the adjusted August reading of 61.7 percent.
U.S. Trade Balance – Released 10/5/2021 – According to the U.S. Census Bureau of Economic Analysis the goods and services deficit increased in August by $2.9 billion to $73.3 billion. August exports were $213.7 billion, $1.0 billion more than July exports. August imports were $287.0 billion, $4.0 billion more than July imports. Year to date the goods and services deficit increased $140.8 billion or 33.7%, from the same period in 2020. Year to date exports and imports increased $244.3 billion or 17.5% and increased $385.1 billion or 21.2% respectively.
Recent Economic Data
Links take you to the data source
PMI Manufacturing Index – Released 10/1/2021 – September PMI increased 1.2% to 61.1% up from August’s reading of 59.9%. The New Orders Index was unchanged from August’s reading of 66.7%. The Production Index registered 59.4%, down 0.6%.
U.S. Construction Spending – Released 10/1/2021 – Construction spending was relatively unchanged in August measuring at a seasonally adjusted annual rate of $1,584.1 billion. The August figure is 8.9% above the August 2020 estimate. Private construction spending was 0.1% below the revised July estimate at $1,243.7 billion. Public construction spending was 0.5% above the revised July estimate at $341.9 billion.
Personal Income – Released 10/1/2021 – Personal income increased $35.5 billion or 0.2 percent in August according to estimates released today by the Bureau of Economic Analysis. Disposable personal income (DPI) increased $18.9 billion or 0.1 percent and personal consumption expenditures (PCE) increased $130.5 billion or 0.8 percent.
Third Estimate of 2nd Quarter 2021 GDP – Released 9/30/2021 – Real gross domestic product (GDP) increased at an annual rate of 6.7 percent in the second quarter of 2021, according to the third estimate released by the Bureau of Economic Analysis. The third GDP estimate is based on more complete source data than were available for the “second” and “advance” estimates. In the second estimate, the increase in real GDP was 6.6 percent. The first quarter observed a 6.3 percent increase in real GDP. The third estimate observed upward revisions to personal consumption expenditures (PCE), exports, and private inventory investment were partly offset by an upward revision to imports, which are a subtraction in the calculation of GDP. The increase in real GDP in the second quarter reflected increases in PCE, nonresidential fixed investment, exports, and state and local government spending that were partly offset by decreases in private inventory investment, residential fixed investment, and federal government spending. Imports, which are a subtraction in the calculation of GDP, increased.
Chicago PMI – Released 9/30/2021 – Chicago PMI decreased to 64.7 points in September, the lowest level since February. Among the main five indicators, Order Backlogs saw the largest decline, followed by Supplier Deliveries and New Orders. Only Employment increased through the month.
Consumer Confidence – Released 9/28/2021 – The Consumer confidence index declined in September. The Index now stands at 109.3, down from 115.2 in August.
Durable Goods – Released 9/27/2021 – New orders for manufactured durable goods in August increased $4.6 billion or 1.8% to $263.5 billion. Transportation equipment led the increase rising $4.2 billion or 5.5% to $80.8 billion.
New Residential Sales – Released 9/24/2021 – Sales of new single-family homes increased 1.5% to 740k, seasonally adjusted, in August. The median sales price of new homes sold in August was $390,900 with an average sales price of $443,200. At the end of August, the seasonally adjusted estimate of new homes for sale was 378k. This represents a supply of 6.1 months at the current sales rate.
Existing Home Sales – Released 9/22/2021 – Existing home sales declined in August. Sales decreased 2.0% to a seasonally adjusted rate of 5.88 million in August. Sales are currently down 1.5% from one year ago. Housing inventory sits at 1.29 million units. Down 1.5% from July’s inventory. Down 13.4% over last year. Unsold inventory sits at a 2.6-month supply. The median existing home price for all housing types was $356,700.
Housing Starts – Released 9/21/2021 – New home starts in August were at a seasonally adjusted annual rate of 1.615 million; up 3.9% above July, and 17.4% above last August’s rate. Building Permits were at a seasonally adjusted annual rate of 1.728 million, up 6.0% compared to July, and up 13.5% over last year.
Retail Sales – Released 9/16/2021 – U.S. retail sales for August increased 0.7% to $618.7 billion and retail sales are 15.1% above August 2020. U.S. retail sales are up 13.1% year/y.
Industrial Production and Capacity Utilization – Released 9/15/2021 – In August Industrial production increased 0.4%. Manufacturing increased 0.2%. Mining decreased 0.6%. Utilities output increased 3.3%. Total industrial production was 5.9% higher in August than a year ago, and 0.3% above its pre-pandemic level. Total capacity utilization increased 0.2% to 76.4% in August which is 3.2% below its long run average.
Consumer Price Index – Released 9/14/2021 – Consumer prices rose 0.3% m/m in August following a 0.5% gain in July. Core consumer prices increased 0.1% m/m in August following a 0.3% gain in July.
Producer Price Index – Released 9/10/2021 – The Producer Price Index for final demand increased 0.7% in August. PPI less food and energy increased 0.6% in August. The change in PPI for final demand has increased 8.3% year/y.
Next week we get data on PPI, CPI, Industrial Production and Capacity Utilization, Retail Sales, and JOLTS.
Data Sources:
Bureau of Economic Analysis (BEA)
Congressional Budget Office (CBO)
U.S. Bureau of Labor Statistics (BLS)
Federal Reserve Economic Data (FRED Charts)
CME Fed Watch
U.S. Treasury – Yields
U.S. Census Bureau
Institute for Supply Management (ISM)
Weekly DOL Employment Data
BLS Monthly Jobs Report
JOLTS
US Energy Admin (EIA)
BLS Consumer Price Index CPI
BLS Producer Price Index PPI
Atlanta Fed GDPNOW
NY Fed Nowcast GDP
US Census Bureau Housing Starts
Consumer Credit
USCB Retail Sales
Construction Spending
Federal Reserve Dot Plots
NY Empire Index
Philadelphia Federal Reserve
P/E Ratio Data -Yardeni Research
Technical Analysis Info:
StockCharts.com – Financial Charts
Exponential vs Simple moving average
Other Links:
1973 Arab Oil Embargo
Hunt Brothers Silver
Long-Term Capital bailout
Categories:
Tags: