Good Life Advisors – Talking Points – Week 38
The week started off poorly as the Evergrande saga played out, but the major domestic indexes actually closed up for the week with small caps and energy outperforming. Tuesday afternoon, the S&P 500 closed at 4354, a drawdown of just 4% from the all-time closing high (4536) hit September 2nd. By Friday “all was forgotten” and the rebound continued. Even with the fed essentially showing its hand (that bond buying is all but over) and another month closer to a rate increase, the equity markets closed higher for the week. That cannot be said of the bond market, where the Agg fell deeper into negative territory for the year, with all the domestic bond indices closing lower on the Fed news.

The debt ceiling will be in play this week. There is little sign of an imminent solution to either the coming expiration of federal spending authorization (and a possible government shutdown after 30-Sep) or the debt ceiling (with Treasury Secretary Yellen having said current “extraordinary measures” may run out in October). House Democrats passed a short-term funding measure along with a suspension of the debt ceiling through 2022; but while this is scheduled for a vote in the Senate on Monday at 5:30pm ET, it appears doomed to failure for lack of enough GOP support to break a filibuster. House Speaker Pelosi said Thursday that government funding will not lapse and that a continuing resolution would pass both houses by 30-Sep. Democrats would then have to decide on next steps, which could include moving a debt limit increase on their own or including it as part of a separate reconciliation package.
Fixed Income
Consistent with analyst expectations, the September FOMC meeting this week held policy steady but said a taper in the Fed’s $120B/mo. asset-purchase plan may soon be warranted, assuming the economy continues to improve. In his post-meeting press conference, Powell said that in his mind, the “substantial further progress” test for employment has been all but met, and that it would not take a “knockout” jobs report to bring the economy over the line. He said there was broad agreement among policymakers for a gradual tapering process that would conclude mid-2022, and that this decision could be made as soon as the FOMC’s November meeting.
September FOMC Statement Credit, Liquidity and Balance Sheet Federal Reserve Dot Plots US Corporate Debt Tops 7 Trillion. Treasury.gov yields FOMC Policy Normalization Statement Longer Run Goals August 2020
Global Bond Yields
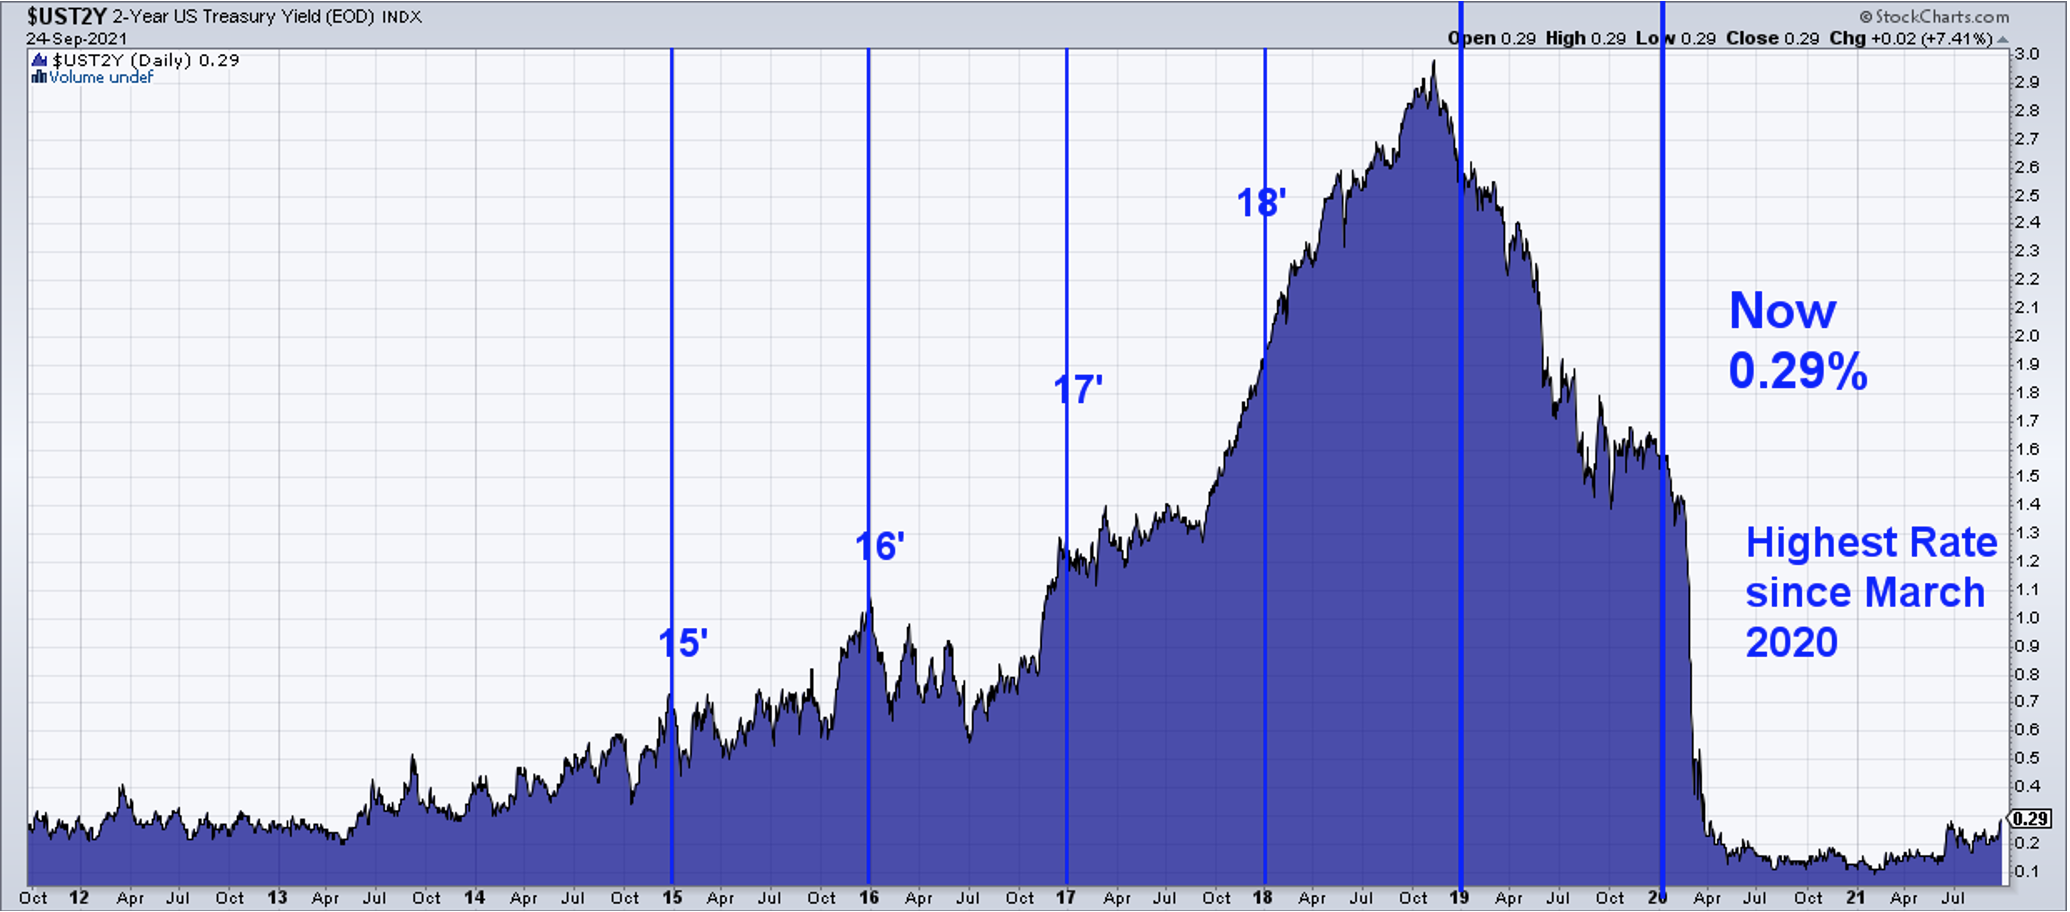
Daily US Treasury Yields
Foreign Exchange Market
Energy Complex
The Baker Hughes rig count increased by 9 this week. There are 521 oil and gas rigs operating in the US – Up 260 over last year.
Metals Complex
Employment Picture
Weekly Unemployment Claims – Released Thursday 9/23/2021 – The week ending September 18th experienced an increase of 16k in initial claims rising to 351k. The four-week moving average of initial jobless claims was slightly changed declining 750 to 335k.
Job Openings & Labor Turnover Survey JOLTS – Released 9/8/2021 – The U.S. Bureau of Labor Statistics reported the number and rate of job openings increased to 10.9 million on the last business day of July. Over the month, hires were little changed at 6.7 million and separations were little changed at 5.8 million. Within separations, the quits rate was unchanged at 2.7%. The layoffs and discharges rates were little changed at 1.0%.
August Jobs Report – BLS Summary – Released 9/3/2021 – The US Economy added 235k nonfarm jobs in August and the Unemployment rate declined 0.2% to 5.2. Average hourly earnings increased by 17 cents to $30.73. Hiring highlights include +74k Professional and Business Services, +53 Transportation and Warehousing, +37k Manufacturing, and +35 Education and Health Services.
- Average hourly earnings increased by 17 cents to $30.73.
- U3 unemployment rate declined 0.2% to 5.2%. U6 unemployment rate declined to 8.8%.
- The labor force participation rate was unchanged at 61.7%.
- Average work week was unchanged at 34.7 hours.
Employment Cost Index – Released 7/30/2021 – Compensation costs for civilian workers increased 0.7% for the 3-month period ending in June 2021. The 12-month period ending in June 2021 saw compensation costs increase by 2.9%. The 12-month period ending June 2020 increased 2.7%. Wages and salaries increased 3.2 percent over the year and increased 2.9 percent for the 12-month period ending in June 2020. Benefit costs increased 2.2 percent over the year and increased 2.2 percent for the 12-month period ending in June 2020. This report is published quarterly.
This Week’s Economic Data
Links take you to the data source
New Residential Sales – Released 9/24/2021 – Sales of new single-family homes increased 1.5% to 740k, seasonally adjusted, in August. The median sales price of new homes sold in August was $390,900 with an average sales price of $443,200. At the end of August, the seasonally adjusted estimate of new homes for sale was 378k. This represents a supply of 6.1 months at the current sales rate.
Existing Home Sales – Released 9/22/2021 – Existing home sales declined in August. Sales decreased 2.0% to a seasonally adjusted rate of 5.88 million in August. Sales are currently down 1.5% from one year ago. Housing inventory sits at 1.29 million units. Down 1.5% from July’s inventory. Down 13.4% over last year. Unsold inventory sits at a 2.6-month supply. The median existing home price for all housing types was $356,700.
Housing Starts – Released 9/21/2021 – New home starts in August were at a seasonally adjusted annual rate of 1.615 million; up 3.9% above July, and 17.4% above last August’s rate. Building Permits were at a seasonally adjusted annual rate of 1.728 million, up 6.0% compared to July, and up 13.5% over last year.
Recent Economic Data
Links take you to the data source
Retail Sales – Released 9/16/2021 – U.S. retail sales for August increased 0.7% to $618.7 billion and retail sales are 15.1% above August 2020. U.S. retail sales are up 13.1% year/y.
Industrial Production and Capacity Utilization – Released 9/15/2021 – In August Industrial production increased 0.4%. Manufacturing increased 0.2%. Mining decreased 0.6%. Utilities output increased 3.3%. Total industrial production was 5.9% higher in August than a year ago, and 0.3% above its pre-pandemic level. Total capacity utilization increased 0.2% to 76.4% in August which is 3.2% below its long run average.
Consumer Price Index – Released 9/14/2021 – Consumer prices rose 0.3% m/m in August following a 0.5% gain in July. Core consumer prices increased 0.1% m/m in August following a 0.3% gain in July.
Producer Price Index – Released 9/10/2021 – The Producer Price Index for final demand increased 0.7% in August. PPI less food and energy increased 0.6% in August. The change in PPI for final demand has increased 8.3% year/y.
Consumer Credit – Released 9/8/2021 – Consumer credit increased at a seasonally adjusted annual rate of 4.7 percent in July. Revolving credit increased at an annual rate of 6.7 percent, while nonrevolving credit increased at an annual rate of 4.1 percent.
US Light Vehicle Sales – Released 9/3/2021 – U.S. light vehicle sales were at a seasonally adjusted annual rate (SAAR) of 13.057 million units in August.
PMI Non-Manufacturing Index – Released 9/3/2021 – Economic activity in the non-manufacturing sector grew in August for the 15th consecutive month. ISM Non-Manufacturing registered 61.7 percent, which is 2.4 percentage points below the adjusted July reading of 64.1 percent.
U.S. Trade Balance – Released 9/2/2021 – According to the U.S. Census Bureau of Economic Analysis the goods and services deficit decreased in July by $3.2 billion to $70.1 billion. July exports were $212.8 billion, $2.8 billion more than June exports. July imports were $282.9 billion, $0.4 billion less than June imports. Year to date the goods and services deficit increased $131.0 billion or 37.1%, from the same period in 2020. Year to date exports and imports increased $205.0 billion or 16.8% and increased $336.0 billion or 21.3% respectively.
PMI Manufacturing Index – Released 9/1/2021 – August PMI increased 0.4% to 59.9% up from July’s reading of 59.5%. The New Orders Index was up 1.8% from July’s reading of 64.9% to 66.7%. The Production Index registered 60.0%, up 1.6%.
U.S. Construction Spending – Released 9/1/2021 – Construction spending increased 0.3% in July measuring at a seasonally adjusted annual rate of $1,568.8 billion. The July figure is 9.0% above the June 2020 estimate. Private construction spending was 0.3% above the revised June estimate at $1,227.8 billion. Public construction spending was 0.7% above the revised June estimate at $337.8 billion.
Chicago PMI – Released 8/31/2021 – Chicago PMI decreased to 66.8 points in August. Among the five main indicators, Order Backlogs saw the largest increase. That was followed by Supplier Deliveries, while Production saw the largest decline.
Consumer Confidence – Released 8/31/2021 – The Consumer confidence index declined in August. The Index now stands at 113.8, down from 125.1 in July.
Personal Income – Released 8/27/2021 – Personal income increased $225.9 billion or 1.1 percent in July according to estimates released today by the Bureau of Economic Analysis. Disposable personal income (DPI) increased $198.0 billion or 1.1 percent and personal consumption expenditures (PCE) increased $42.2 billion or 0.3 percent.
Second Estimate of 2nd Quarter 2021 GDP – Released 8/26/2021 – Real gross domestic product (GDP) increased at an annual rate of 6.6 percent in the second quarter of 2021, according to the second estimate released by the Bureau of Economic Analysis. The Second GDP estimate is based on more complete source data than were available for the “advance” estimate issued last month. In the advance estimate, the increase in real GDP was 6.5 percent. The first quarter observed a 6.3 percent increase in real GDP. The increase in real GDP in the second quarter reflected increases in personal consumption expenditures (PCE), nonresidential fixed investment, exports, and state and local government spending that were partly offset by decreases in private inventory investment, residential fixed investment, and federal government spending. Imports, which are a subtraction in the calculation of GDP, increased. The Second GDP estimate reflects upward revisions to nonresidential fixed investment and exports that were partly offset by downward revisions to private inventory investment, residential fixed investment, and state and local government spending. Imports, which are a subtraction in the calculation of GDP, were revised down
Durable Goods – Released 8/25/2021 – New orders for manufactured durable goods in July decreased $0.4 billion or 0.1% to $257.2 billion. Transportation equipment led the decrease declining $1.7 billion or 2.2% to $75.3 billion.
Next week we get data on Durable Goods, 3rd Estimate of 2nd Quarter 2021 GDP, Personal Income, Consumer Confidence, Chicago PMI, U.S. Construction Spending, Manufacturing PMI, and the September Jobs Report.
Data Sources:
Bureau of Economic Analysis (BEA)
Congressional Budget Office (CBO)
U.S. Bureau of Labor Statistics (BLS)
Federal Reserve Economic Data (FRED Charts)
CME Fed Watch
U.S. Treasury – Yields
U.S. Census Bureau
Institute for Supply Management (ISM)
Weekly DOL Employment Data
BLS Monthly Jobs Report
JOLTS
US Energy Admin (EIA)
BLS Consumer Price Index CPI
BLS Producer Price Index PPI
Atlanta Fed GDPNOW
NY Fed Nowcast GDP
US Census Bureau Housing Starts
Consumer Credit
USCB Retail Sales
Construction Spending
Federal Reserve Dot Plots
NY Empire Index
Philadelphia Federal Reserve
P/E Ratio Data -Yardeni Research
Technical Analysis Info:
StockCharts.com – Financial Charts
Exponential vs Simple moving average
Other Links:
1973 Arab Oil Embargo
Hunt Brothers Silver
Long-Term Capital bailout


Week 38 Talking Points
Good Life Advisors – Talking Points – Week 38
The week started off poorly as the Evergrande saga played out, but the major domestic indexes actually closed up for the week with small caps and energy outperforming. Tuesday afternoon, the S&P 500 closed at 4354, a drawdown of just 4% from the all-time closing high (4536) hit September 2nd. By Friday “all was forgotten” and the rebound continued. Even with the fed essentially showing its hand (that bond buying is all but over) and another month closer to a rate increase, the equity markets closed higher for the week. That cannot be said of the bond market, where the Agg fell deeper into negative territory for the year, with all the domestic bond indices closing lower on the Fed news.
The debt ceiling will be in play this week. There is little sign of an imminent solution to either the coming expiration of federal spending authorization (and a possible government shutdown after 30-Sep) or the debt ceiling (with Treasury Secretary Yellen having said current “extraordinary measures” may run out in October). House Democrats passed a short-term funding measure along with a suspension of the debt ceiling through 2022; but while this is scheduled for a vote in the Senate on Monday at 5:30pm ET, it appears doomed to failure for lack of enough GOP support to break a filibuster. House Speaker Pelosi said Thursday that government funding will not lapse and that a continuing resolution would pass both houses by 30-Sep. Democrats would then have to decide on next steps, which could include moving a debt limit increase on their own or including it as part of a separate reconciliation package.
Table of Contents
Fixed Income
Consistent with analyst expectations, the September FOMC meeting this week held policy steady but said a taper in the Fed’s $120B/mo. asset-purchase plan may soon be warranted, assuming the economy continues to improve. In his post-meeting press conference, Powell said that in his mind, the “substantial further progress” test for employment has been all but met, and that it would not take a “knockout” jobs report to bring the economy over the line. He said there was broad agreement among policymakers for a gradual tapering process that would conclude mid-2022, and that this decision could be made as soon as the FOMC’s November meeting.
September FOMC Statement Credit, Liquidity and Balance Sheet Federal Reserve Dot Plots US Corporate Debt Tops 7 Trillion. Treasury.gov yields FOMC Policy Normalization Statement Longer Run Goals August 2020
Global Bond Yields
Daily US Treasury Yields
Foreign Exchange Market
Energy Complex
The Baker Hughes rig count increased by 9 this week. There are 521 oil and gas rigs operating in the US – Up 260 over last year.
Metals Complex
Employment Picture
Weekly Unemployment Claims – Released Thursday 9/23/2021 – The week ending September 18th experienced an increase of 16k in initial claims rising to 351k. The four-week moving average of initial jobless claims was slightly changed declining 750 to 335k.
Job Openings & Labor Turnover Survey JOLTS – Released 9/8/2021 – The U.S. Bureau of Labor Statistics reported the number and rate of job openings increased to 10.9 million on the last business day of July. Over the month, hires were little changed at 6.7 million and separations were little changed at 5.8 million. Within separations, the quits rate was unchanged at 2.7%. The layoffs and discharges rates were little changed at 1.0%.
August Jobs Report – BLS Summary – Released 9/3/2021 – The US Economy added 235k nonfarm jobs in August and the Unemployment rate declined 0.2% to 5.2. Average hourly earnings increased by 17 cents to $30.73. Hiring highlights include +74k Professional and Business Services, +53 Transportation and Warehousing, +37k Manufacturing, and +35 Education and Health Services.
Employment Cost Index – Released 7/30/2021 – Compensation costs for civilian workers increased 0.7% for the 3-month period ending in June 2021. The 12-month period ending in June 2021 saw compensation costs increase by 2.9%. The 12-month period ending June 2020 increased 2.7%. Wages and salaries increased 3.2 percent over the year and increased 2.9 percent for the 12-month period ending in June 2020. Benefit costs increased 2.2 percent over the year and increased 2.2 percent for the 12-month period ending in June 2020. This report is published quarterly.
This Week’s Economic Data
Links take you to the data source
New Residential Sales – Released 9/24/2021 – Sales of new single-family homes increased 1.5% to 740k, seasonally adjusted, in August. The median sales price of new homes sold in August was $390,900 with an average sales price of $443,200. At the end of August, the seasonally adjusted estimate of new homes for sale was 378k. This represents a supply of 6.1 months at the current sales rate.
Existing Home Sales – Released 9/22/2021 – Existing home sales declined in August. Sales decreased 2.0% to a seasonally adjusted rate of 5.88 million in August. Sales are currently down 1.5% from one year ago. Housing inventory sits at 1.29 million units. Down 1.5% from July’s inventory. Down 13.4% over last year. Unsold inventory sits at a 2.6-month supply. The median existing home price for all housing types was $356,700.
Housing Starts – Released 9/21/2021 – New home starts in August were at a seasonally adjusted annual rate of 1.615 million; up 3.9% above July, and 17.4% above last August’s rate. Building Permits were at a seasonally adjusted annual rate of 1.728 million, up 6.0% compared to July, and up 13.5% over last year.
Recent Economic Data
Links take you to the data source
Retail Sales – Released 9/16/2021 – U.S. retail sales for August increased 0.7% to $618.7 billion and retail sales are 15.1% above August 2020. U.S. retail sales are up 13.1% year/y.
Industrial Production and Capacity Utilization – Released 9/15/2021 – In August Industrial production increased 0.4%. Manufacturing increased 0.2%. Mining decreased 0.6%. Utilities output increased 3.3%. Total industrial production was 5.9% higher in August than a year ago, and 0.3% above its pre-pandemic level. Total capacity utilization increased 0.2% to 76.4% in August which is 3.2% below its long run average.
Consumer Price Index – Released 9/14/2021 – Consumer prices rose 0.3% m/m in August following a 0.5% gain in July. Core consumer prices increased 0.1% m/m in August following a 0.3% gain in July.
Producer Price Index – Released 9/10/2021 – The Producer Price Index for final demand increased 0.7% in August. PPI less food and energy increased 0.6% in August. The change in PPI for final demand has increased 8.3% year/y.
Consumer Credit – Released 9/8/2021 – Consumer credit increased at a seasonally adjusted annual rate of 4.7 percent in July. Revolving credit increased at an annual rate of 6.7 percent, while nonrevolving credit increased at an annual rate of 4.1 percent.
US Light Vehicle Sales – Released 9/3/2021 – U.S. light vehicle sales were at a seasonally adjusted annual rate (SAAR) of 13.057 million units in August.
PMI Non-Manufacturing Index – Released 9/3/2021 – Economic activity in the non-manufacturing sector grew in August for the 15th consecutive month. ISM Non-Manufacturing registered 61.7 percent, which is 2.4 percentage points below the adjusted July reading of 64.1 percent.
U.S. Trade Balance – Released 9/2/2021 – According to the U.S. Census Bureau of Economic Analysis the goods and services deficit decreased in July by $3.2 billion to $70.1 billion. July exports were $212.8 billion, $2.8 billion more than June exports. July imports were $282.9 billion, $0.4 billion less than June imports. Year to date the goods and services deficit increased $131.0 billion or 37.1%, from the same period in 2020. Year to date exports and imports increased $205.0 billion or 16.8% and increased $336.0 billion or 21.3% respectively.
PMI Manufacturing Index – Released 9/1/2021 – August PMI increased 0.4% to 59.9% up from July’s reading of 59.5%. The New Orders Index was up 1.8% from July’s reading of 64.9% to 66.7%. The Production Index registered 60.0%, up 1.6%.
U.S. Construction Spending – Released 9/1/2021 – Construction spending increased 0.3% in July measuring at a seasonally adjusted annual rate of $1,568.8 billion. The July figure is 9.0% above the June 2020 estimate. Private construction spending was 0.3% above the revised June estimate at $1,227.8 billion. Public construction spending was 0.7% above the revised June estimate at $337.8 billion.
Chicago PMI – Released 8/31/2021 – Chicago PMI decreased to 66.8 points in August. Among the five main indicators, Order Backlogs saw the largest increase. That was followed by Supplier Deliveries, while Production saw the largest decline.
Consumer Confidence – Released 8/31/2021 – The Consumer confidence index declined in August. The Index now stands at 113.8, down from 125.1 in July.
Personal Income – Released 8/27/2021 – Personal income increased $225.9 billion or 1.1 percent in July according to estimates released today by the Bureau of Economic Analysis. Disposable personal income (DPI) increased $198.0 billion or 1.1 percent and personal consumption expenditures (PCE) increased $42.2 billion or 0.3 percent.
Second Estimate of 2nd Quarter 2021 GDP – Released 8/26/2021 – Real gross domestic product (GDP) increased at an annual rate of 6.6 percent in the second quarter of 2021, according to the second estimate released by the Bureau of Economic Analysis. The Second GDP estimate is based on more complete source data than were available for the “advance” estimate issued last month. In the advance estimate, the increase in real GDP was 6.5 percent. The first quarter observed a 6.3 percent increase in real GDP. The increase in real GDP in the second quarter reflected increases in personal consumption expenditures (PCE), nonresidential fixed investment, exports, and state and local government spending that were partly offset by decreases in private inventory investment, residential fixed investment, and federal government spending. Imports, which are a subtraction in the calculation of GDP, increased. The Second GDP estimate reflects upward revisions to nonresidential fixed investment and exports that were partly offset by downward revisions to private inventory investment, residential fixed investment, and state and local government spending. Imports, which are a subtraction in the calculation of GDP, were revised down
Durable Goods – Released 8/25/2021 – New orders for manufactured durable goods in July decreased $0.4 billion or 0.1% to $257.2 billion. Transportation equipment led the decrease declining $1.7 billion or 2.2% to $75.3 billion.
Next week we get data on Durable Goods, 3rd Estimate of 2nd Quarter 2021 GDP, Personal Income, Consumer Confidence, Chicago PMI, U.S. Construction Spending, Manufacturing PMI, and the September Jobs Report.
Data Sources:
Bureau of Economic Analysis (BEA)
Congressional Budget Office (CBO)
U.S. Bureau of Labor Statistics (BLS)
Federal Reserve Economic Data (FRED Charts)
CME Fed Watch
U.S. Treasury – Yields
U.S. Census Bureau
Institute for Supply Management (ISM)
Weekly DOL Employment Data
BLS Monthly Jobs Report
JOLTS
US Energy Admin (EIA)
BLS Consumer Price Index CPI
BLS Producer Price Index PPI
Atlanta Fed GDPNOW
NY Fed Nowcast GDP
US Census Bureau Housing Starts
Consumer Credit
USCB Retail Sales
Construction Spending
Federal Reserve Dot Plots
NY Empire Index
Philadelphia Federal Reserve
P/E Ratio Data -Yardeni Research
Technical Analysis Info:
StockCharts.com – Financial Charts
Exponential vs Simple moving average
Other Links:
1973 Arab Oil Embargo
Hunt Brothers Silver
Long-Term Capital bailout
Categories:
Tags: