Good Life Advisors – Talking Points – Week 41
Learning to Live With the Virus
After two week of reprieve the S&P 500 closed just 1.6% away from all-time highs on Friday.
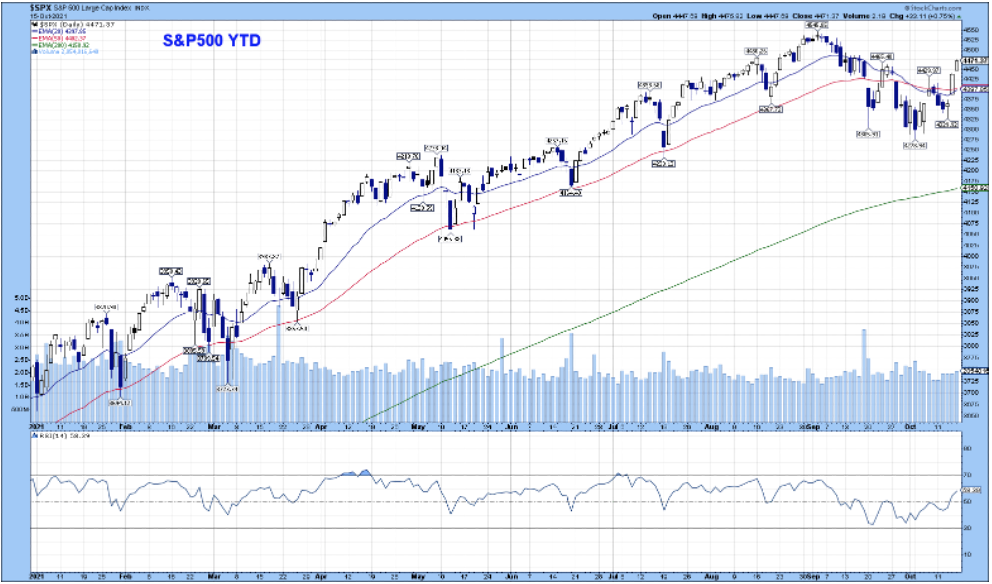
US equities were higher this week, with the S&P 500 and Nasdaq posting the best weeks since August. Growth broke four-straight weeks of underperformance to Value. Materials led with particular strength in metals as the global energy supply crisis led to even more supply cuts. Consumer discretionary saw solid gains from Amazon, the autos complex, and homebuilders. Tech outperformed as semis posted the best week since late August while software also saw a big bounce. Industrials outperformed as strength in trucking, rails and parcels/logistics offset airline weakness. Financials were a bit of an underperformer with money center banks mixed on earnings, but investment banks rallied on well-received reports.
Treasuries were mixed with the curve flattening with the 2Y and 3Y particularly weak amid increased Fed rate hike expectations, though long-end yields fell. The dollar index was down 0.1%, breaking a five-week streak of gains. WTI crude was up 3.7%, posting an eighth-straight week of gains. Gold finished up 0.6%. Bitcoin futures rallied by more than 12% amid optimism that the SEC will allow Bitcoin futures ETFs to start trading next week. I don’t know what the availability will be on our platform but if you’re interested in anything crypto related, advisors should start by completing the required LPL training course #21CLR 093, clients also need to complete form F725 before purchasing any crypto related securities.
A strong start to earnings season was a big driver of the week’s upside. Bank earnings came in mostly stronger than expected, with BAC +4.6%, GS +3.4%, and MS +2.1% the standouts. Analysts said a number of reserve releases signaled optimism over the quarters ahead and highlighted some threads across the money center bank and investment bank results, including strong equity and FICC trading, (mostly) solid loan growth, and better operating leverage than expected.
Data was also a tailwind this week despite a mixed outlook in inflation trends from the September CPI and PPI reports. CPI came in a bit hotter than expected, though PPI was cooler, which some economists said could suggest some easing of price pressures ahead. However, economists at Morgan Stanley and Goldman Sachs said the composition of the CPI report was firmer and see upside risk in the months ahead with stickier components (notably rent and OER) still elevated.
Bank of America economists also said the positive inflation surprise signals a still-hot economy, which could push the Fed’s rate hike timeline up. Following the price index reports, markets pushed forward the timing of the first Fed rate hike to Q3-22 from Q4-22. Elsewhere, September headline retail sales posted a surprise gain, though October Consumer Sentiment disappointed with still-elevated fears around inflation. Despite the inflation trends, some economists have played down threat of stagflation (Nikkei) as demand remains strong across the economy. Monetary policy is also expected to remain accommodative despite the taper and rate hike timeline, as this week’s September FOMC meeting minutes said various participants stressed that economic conditions were likely to justify keeping the rate at or near its lower bound over the next couple of years.
The global energy crisis also remains a headwind to economic growth and could be continuing to push inflation higher in the months ahead (WSJ), though some improving trends in shipping and semiconductors (Washington Post) could help ease inflation pressure moving ahead. That sentiment was boosted after the White House this week announced a pledge by the ports of Los Angeles and Long Beach to operate 24/7 to help alleviate supply-chain issues ahead of the holidays (WSJ).

Fixed Income
September FOMC Statement Credit, Liquidity and Balance Sheet Federal Reserve Dot Plots Sep 21′
US Corporate Debt Tops 7 Trillion. Treasury.gov yields FOMC Policy Normalization Statement Longer Run Goals August 2020
Global Bond Yields
Daily US Treasury Yields
Foreign Exchange Market
Energy Complex
The Baker Hughes rig count increased by 10 this week. There are 543 oil and gas rigs operating in the US – Up 261 over last year.
Metals Complex
Employment Picture
Wage growth is the highest it’s been since just before the GFC
Weekly Unemployment Claims – Released Thursday 10/14/2021 – The week ending October 9th experienced a decrease of 36k in initial claims declining to 293k. The four-week moving average of initial jobless claims decreased 10.5k to 334k.
Job Openings & Labor Turnover Survey JOLTS – Released 10/12/2021 – The U.S. Bureau of Labor Statistics reported the number and rate of job openings decreased to 10.4 million on the last business day of August. Over the month, hires decreased to 6.3 million and separations were little changed at 6.0 million. Within separations, the quits rate increased to 2.9%. The layoffs and discharges rates were little changed at 0.9%.
September Jobs Report – BLS Summary Released 10/8/2021 – The US Economy added 194k nonfarm jobs in September and the Unemployment rate declined 0.4% to 4.8. Average hourly earnings increased by 19 cents to $30.85. Hiring highlights include +74k Leisure and Hospitality, +60k Professional and Business Services, and +47 Transportation and Warehousing.
- Average hourly earnings increased by 19 cents to $30.85.
- U3 unemployment rate declined 0.4% to 4.8%. U6 unemployment rate declined to 8.5%.
- The labor force participation rate was little changed at 61.6%.
- Average work week increased 0.2 hours to 34.8 hours.
Employment Cost Index – Released 7/30/2021 – Compensation costs for civilian workers increased 0.7% for the 3-month period ending in June 2021. The 12-month period ending in June 2021 saw compensation costs increase by 2.9%. The 12-month period ending June 2020 increased 2.7%. Wages and salaries increased 3.2 percent over the year and increased 2.9 percent for the 12-month period ending in June 2020. Benefit costs increased 2.2 percent over the year and increased 2.2 percent for the 12-month period ending in June 2020. This report is published quarterly.
This Week’s Economic Data
Links take you to the data source
Retail Sales – Released 10/15/2021 – U.S. retail sales for September increased 0.7% to $625.4 billion and retail sales are 13.9% above September 2020. U.S. retail sales for the July 2021 through September 2021 period were up 14.9% from the same period a year ago.
Producer Price Index – Released 10/14/2021 – The Producer Price Index for final demand increased 0.5% in September. PPI less food and energy increased 0.6% in September. The change in PPI for final demand has increased 8.6% year/y.
Consumer Price Index – Released 10/13/2021 – Consumer prices rose 0.4% m/m in September following a 0.3% gain in August. Core consumer prices increased 0.2% m/m in September following a 0.1% gain in August.
Recent Economic Data
Links take you to the data source
US Light Vehicle Sales – Released 10/8/2021 – U.S. light vehicle sales were at a seasonally adjusted annual rate (SAAR) of 12.176 million units in September.
Consumer Credit – Released 10/7/2021 – Consumer credit increased at a seasonally adjusted annual rate of 4.0 percent in August. Revolving credit increased at an annual rate of 3.6 percent, while nonrevolving credit increased at an annual rate of 4.1 percent.
PMI Non-Manufacturing Index – Released 10/5/2021 – Economic activity in the non-manufacturing sector grew in September for the 16th consecutive month. ISM Non-Manufacturing registered 61.9 percent, which is 0.2 percentage points above the adjusted August reading of 61.7 percent.
U.S. Trade Balance – Released 10/5/2021 – According to the U.S. Census Bureau of Economic Analysis the goods and services deficit increased in August by $2.9 billion to $73.3 billion. August exports were $213.7 billion, $1.0 billion more than July exports. August imports were $287.0 billion, $4.0 billion more than July imports. Year to date the goods and services deficit increased $140.8 billion or 33.7%, from the same period in 2020. Year to date exports and imports increased $244.3 billion or 17.5% and increased $385.1 billion or 21.2% respectively.
PMI Manufacturing Index – Released 10/1/2021 – September PMI increased 1.2% to 61.1% up from August’s reading of 59.9%. The New Orders Index was unchanged from August’s reading of 66.7%. The Production Index registered 59.4%, down 0.6%.
U.S. Construction Spending – Released 10/1/2021 – Construction spending was relatively unchanged in August measuring at a seasonally adjusted annual rate of $1,584.1 billion. The August figure is 8.9% above the August 2020 estimate. Private construction spending was 0.1% below the revised July estimate at $1,243.7 billion. Public construction spending was 0.5% above the revised July estimate at $341.9 billion.
Personal Income – Released 10/1/2021 – Personal income increased $35.5 billion or 0.2 percent in August according to estimates released today by the Bureau of Economic Analysis. Disposable personal income (DPI) increased $18.9 billion or 0.1 percent and personal consumption expenditures (PCE) increased $130.5 billion or 0.8 percent.
Third Estimate of 2nd Quarter 2021 GDP – Released 9/30/2021 – Real gross domestic product (GDP) increased at an annual rate of 6.7 percent in the second quarter of 2021, according to the third estimate released by the Bureau of Economic Analysis. The third GDP estimate is based on more complete source data than were available for the “second” and “advance” estimates. In the second estimate, the increase in real GDP was 6.6 percent. The first quarter observed a 6.3 percent increase in real GDP. The third estimate observed upward revisions to personal consumption expenditures (PCE), exports, and private inventory investment were partly offset by an upward revision to imports, which are a subtraction in the calculation of GDP. The increase in real GDP in the second quarter reflected increases in PCE, nonresidential fixed investment, exports, and state and local government spending that were partly offset by decreases in private inventory investment, residential fixed investment, and federal government spending. Imports, which are a subtraction in the calculation of GDP, increased.
Chicago PMI – Released 9/30/2021 – Chicago PMI decreased to 64.7 points in September, the lowest level since February. Among the main five indicators, Order Backlogs saw the largest decline, followed by Supplier Deliveries and New Orders. Only Employment increased through the month.
Consumer Confidence – Released 9/28/2021 – The Consumer confidence index declined in September. The Index now stands at 109.3, down from 115.2 in August.
Durable Goods – Released 9/27/2021 – New orders for manufactured durable goods in August increased $4.6 billion or 1.8% to $263.5 billion. Transportation equipment led the increase rising $4.2 billion or 5.5% to $80.8 billion.
New Residential Sales – Released 9/24/2021 – Sales of new single-family homes increased 1.5% to 740k, seasonally adjusted, in August. The median sales price of new homes sold in August was $390,900 with an average sales price of $443,200. At the end of August, the seasonally adjusted estimate of new homes for sale was 378k. This represents a supply of 6.1 months at the current sales rate.
Existing Home Sales – Released 9/22/2021 – Existing home sales declined in August. Sales decreased 2.0% to a seasonally adjusted rate of 5.88 million in August. Sales are currently down 1.5% from one year ago. Housing inventory sits at 1.29 million units. Down 1.5% from July’s inventory. Down 13.4% over last year. Unsold inventory sits at a 2.6-month supply. The median existing home price for all housing types was $356,700.
Housing Starts – Released 9/21/2021 – New home starts in August were at a seasonally adjusted annual rate of 1.615 million; up 3.9% above July, and 17.4% above last August’s rate. Building Permits were at a seasonally adjusted annual rate of 1.728 million, up 6.0% compared to July, and up 13.5% over last year.
Industrial Production and Capacity Utilization – Released 9/15/2021 – In August Industrial production increased 0.4%. Manufacturing increased 0.2%. Mining decreased 0.6%. Utilities output increased 3.3%. Total industrial production was 5.9% higher in August than a year ago, and 0.3% above its pre-pandemic level. Total capacity utilization increased 0.2% to 76.4% in August which is 3.2% below its long run average.
Next week we get data on Industrial Production and Capacity Utilization, Housing Starts, and Existing Home Sales.
Data Sources:
Bureau of Economic Analysis (BEA)
Congressional Budget Office (CBO)
U.S. Bureau of Labor Statistics (BLS)
Federal Reserve Economic Data (FRED Charts)
CME Fed Watch
U.S. Treasury – Yields
U.S. Census Bureau
Institute for Supply Management (ISM)
Weekly DOL Employment Data
BLS Monthly Jobs Report
JOLTS
US Energy Admin (EIA)
BLS Consumer Price Index CPI
BLS Producer Price Index PPI
Atlanta Fed GDPNOW
NY Fed Nowcast GDP
US Census Bureau Housing Starts
Consumer Credit
USCB Retail Sales
Construction Spending
Federal Reserve Dot Plots
NY Empire Index
Philadelphia Federal Reserve
P/E Ratio Data -Yardeni Research
Technical Analysis Info:
StockCharts.com – Financial Charts
Exponential vs Simple moving average
Other Links:
1973 Arab Oil Embargo
Hunt Brothers Silver
Long-Term Capital bailout


Week 41 Talking Points
Good Life Advisors – Talking Points – Week 41
Learning to Live With the Virus
After two week of reprieve the S&P 500 closed just 1.6% away from all-time highs on Friday.
US equities were higher this week, with the S&P 500 and Nasdaq posting the best weeks since August. Growth broke four-straight weeks of underperformance to Value. Materials led with particular strength in metals as the global energy supply crisis led to even more supply cuts. Consumer discretionary saw solid gains from Amazon, the autos complex, and homebuilders. Tech outperformed as semis posted the best week since late August while software also saw a big bounce. Industrials outperformed as strength in trucking, rails and parcels/logistics offset airline weakness. Financials were a bit of an underperformer with money center banks mixed on earnings, but investment banks rallied on well-received reports.
Treasuries were mixed with the curve flattening with the 2Y and 3Y particularly weak amid increased Fed rate hike expectations, though long-end yields fell. The dollar index was down 0.1%, breaking a five-week streak of gains. WTI crude was up 3.7%, posting an eighth-straight week of gains. Gold finished up 0.6%. Bitcoin futures rallied by more than 12% amid optimism that the SEC will allow Bitcoin futures ETFs to start trading next week. I don’t know what the availability will be on our platform but if you’re interested in anything crypto related, advisors should start by completing the required LPL training course #21CLR 093, clients also need to complete form F725 before purchasing any crypto related securities.
A strong start to earnings season was a big driver of the week’s upside. Bank earnings came in mostly stronger than expected, with BAC +4.6%, GS +3.4%, and MS +2.1% the standouts. Analysts said a number of reserve releases signaled optimism over the quarters ahead and highlighted some threads across the money center bank and investment bank results, including strong equity and FICC trading, (mostly) solid loan growth, and better operating leverage than expected.
Data was also a tailwind this week despite a mixed outlook in inflation trends from the September CPI and PPI reports. CPI came in a bit hotter than expected, though PPI was cooler, which some economists said could suggest some easing of price pressures ahead. However, economists at Morgan Stanley and Goldman Sachs said the composition of the CPI report was firmer and see upside risk in the months ahead with stickier components (notably rent and OER) still elevated.
Bank of America economists also said the positive inflation surprise signals a still-hot economy, which could push the Fed’s rate hike timeline up. Following the price index reports, markets pushed forward the timing of the first Fed rate hike to Q3-22 from Q4-22. Elsewhere, September headline retail sales posted a surprise gain, though October Consumer Sentiment disappointed with still-elevated fears around inflation. Despite the inflation trends, some economists have played down threat of stagflation (Nikkei) as demand remains strong across the economy. Monetary policy is also expected to remain accommodative despite the taper and rate hike timeline, as this week’s September FOMC meeting minutes said various participants stressed that economic conditions were likely to justify keeping the rate at or near its lower bound over the next couple of years.
The global energy crisis also remains a headwind to economic growth and could be continuing to push inflation higher in the months ahead (WSJ), though some improving trends in shipping and semiconductors (Washington Post) could help ease inflation pressure moving ahead. That sentiment was boosted after the White House this week announced a pledge by the ports of Los Angeles and Long Beach to operate 24/7 to help alleviate supply-chain issues ahead of the holidays (WSJ).
Table of Contents
Fixed Income
September FOMC Statement Credit, Liquidity and Balance Sheet Federal Reserve Dot Plots Sep 21′
US Corporate Debt Tops 7 Trillion. Treasury.gov yields FOMC Policy Normalization Statement Longer Run Goals August 2020
Global Bond Yields
Daily US Treasury Yields
Foreign Exchange Market
Energy Complex
The Baker Hughes rig count increased by 10 this week. There are 543 oil and gas rigs operating in the US – Up 261 over last year.
Metals Complex
Employment Picture
Wage growth is the highest it’s been since just before the GFC
Weekly Unemployment Claims – Released Thursday 10/14/2021 – The week ending October 9th experienced a decrease of 36k in initial claims declining to 293k. The four-week moving average of initial jobless claims decreased 10.5k to 334k.
Job Openings & Labor Turnover Survey JOLTS – Released 10/12/2021 – The U.S. Bureau of Labor Statistics reported the number and rate of job openings decreased to 10.4 million on the last business day of August. Over the month, hires decreased to 6.3 million and separations were little changed at 6.0 million. Within separations, the quits rate increased to 2.9%. The layoffs and discharges rates were little changed at 0.9%.
September Jobs Report – BLS Summary Released 10/8/2021 – The US Economy added 194k nonfarm jobs in September and the Unemployment rate declined 0.4% to 4.8. Average hourly earnings increased by 19 cents to $30.85. Hiring highlights include +74k Leisure and Hospitality, +60k Professional and Business Services, and +47 Transportation and Warehousing.
Employment Cost Index – Released 7/30/2021 – Compensation costs for civilian workers increased 0.7% for the 3-month period ending in June 2021. The 12-month period ending in June 2021 saw compensation costs increase by 2.9%. The 12-month period ending June 2020 increased 2.7%. Wages and salaries increased 3.2 percent over the year and increased 2.9 percent for the 12-month period ending in June 2020. Benefit costs increased 2.2 percent over the year and increased 2.2 percent for the 12-month period ending in June 2020. This report is published quarterly.
This Week’s Economic Data
Links take you to the data source
Retail Sales – Released 10/15/2021 – U.S. retail sales for September increased 0.7% to $625.4 billion and retail sales are 13.9% above September 2020. U.S. retail sales for the July 2021 through September 2021 period were up 14.9% from the same period a year ago.
Producer Price Index – Released 10/14/2021 – The Producer Price Index for final demand increased 0.5% in September. PPI less food and energy increased 0.6% in September. The change in PPI for final demand has increased 8.6% year/y.
Consumer Price Index – Released 10/13/2021 – Consumer prices rose 0.4% m/m in September following a 0.3% gain in August. Core consumer prices increased 0.2% m/m in September following a 0.1% gain in August.
Recent Economic Data
Links take you to the data source
US Light Vehicle Sales – Released 10/8/2021 – U.S. light vehicle sales were at a seasonally adjusted annual rate (SAAR) of 12.176 million units in September.
Consumer Credit – Released 10/7/2021 – Consumer credit increased at a seasonally adjusted annual rate of 4.0 percent in August. Revolving credit increased at an annual rate of 3.6 percent, while nonrevolving credit increased at an annual rate of 4.1 percent.
PMI Non-Manufacturing Index – Released 10/5/2021 – Economic activity in the non-manufacturing sector grew in September for the 16th consecutive month. ISM Non-Manufacturing registered 61.9 percent, which is 0.2 percentage points above the adjusted August reading of 61.7 percent.
U.S. Trade Balance – Released 10/5/2021 – According to the U.S. Census Bureau of Economic Analysis the goods and services deficit increased in August by $2.9 billion to $73.3 billion. August exports were $213.7 billion, $1.0 billion more than July exports. August imports were $287.0 billion, $4.0 billion more than July imports. Year to date the goods and services deficit increased $140.8 billion or 33.7%, from the same period in 2020. Year to date exports and imports increased $244.3 billion or 17.5% and increased $385.1 billion or 21.2% respectively.
PMI Manufacturing Index – Released 10/1/2021 – September PMI increased 1.2% to 61.1% up from August’s reading of 59.9%. The New Orders Index was unchanged from August’s reading of 66.7%. The Production Index registered 59.4%, down 0.6%.
U.S. Construction Spending – Released 10/1/2021 – Construction spending was relatively unchanged in August measuring at a seasonally adjusted annual rate of $1,584.1 billion. The August figure is 8.9% above the August 2020 estimate. Private construction spending was 0.1% below the revised July estimate at $1,243.7 billion. Public construction spending was 0.5% above the revised July estimate at $341.9 billion.
Personal Income – Released 10/1/2021 – Personal income increased $35.5 billion or 0.2 percent in August according to estimates released today by the Bureau of Economic Analysis. Disposable personal income (DPI) increased $18.9 billion or 0.1 percent and personal consumption expenditures (PCE) increased $130.5 billion or 0.8 percent.
Third Estimate of 2nd Quarter 2021 GDP – Released 9/30/2021 – Real gross domestic product (GDP) increased at an annual rate of 6.7 percent in the second quarter of 2021, according to the third estimate released by the Bureau of Economic Analysis. The third GDP estimate is based on more complete source data than were available for the “second” and “advance” estimates. In the second estimate, the increase in real GDP was 6.6 percent. The first quarter observed a 6.3 percent increase in real GDP. The third estimate observed upward revisions to personal consumption expenditures (PCE), exports, and private inventory investment were partly offset by an upward revision to imports, which are a subtraction in the calculation of GDP. The increase in real GDP in the second quarter reflected increases in PCE, nonresidential fixed investment, exports, and state and local government spending that were partly offset by decreases in private inventory investment, residential fixed investment, and federal government spending. Imports, which are a subtraction in the calculation of GDP, increased.
Chicago PMI – Released 9/30/2021 – Chicago PMI decreased to 64.7 points in September, the lowest level since February. Among the main five indicators, Order Backlogs saw the largest decline, followed by Supplier Deliveries and New Orders. Only Employment increased through the month.
Consumer Confidence – Released 9/28/2021 – The Consumer confidence index declined in September. The Index now stands at 109.3, down from 115.2 in August.
Durable Goods – Released 9/27/2021 – New orders for manufactured durable goods in August increased $4.6 billion or 1.8% to $263.5 billion. Transportation equipment led the increase rising $4.2 billion or 5.5% to $80.8 billion.
New Residential Sales – Released 9/24/2021 – Sales of new single-family homes increased 1.5% to 740k, seasonally adjusted, in August. The median sales price of new homes sold in August was $390,900 with an average sales price of $443,200. At the end of August, the seasonally adjusted estimate of new homes for sale was 378k. This represents a supply of 6.1 months at the current sales rate.
Existing Home Sales – Released 9/22/2021 – Existing home sales declined in August. Sales decreased 2.0% to a seasonally adjusted rate of 5.88 million in August. Sales are currently down 1.5% from one year ago. Housing inventory sits at 1.29 million units. Down 1.5% from July’s inventory. Down 13.4% over last year. Unsold inventory sits at a 2.6-month supply. The median existing home price for all housing types was $356,700.
Housing Starts – Released 9/21/2021 – New home starts in August were at a seasonally adjusted annual rate of 1.615 million; up 3.9% above July, and 17.4% above last August’s rate. Building Permits were at a seasonally adjusted annual rate of 1.728 million, up 6.0% compared to July, and up 13.5% over last year.
Industrial Production and Capacity Utilization – Released 9/15/2021 – In August Industrial production increased 0.4%. Manufacturing increased 0.2%. Mining decreased 0.6%. Utilities output increased 3.3%. Total industrial production was 5.9% higher in August than a year ago, and 0.3% above its pre-pandemic level. Total capacity utilization increased 0.2% to 76.4% in August which is 3.2% below its long run average.
Next week we get data on Industrial Production and Capacity Utilization, Housing Starts, and Existing Home Sales.
Data Sources:
Bureau of Economic Analysis (BEA)
Congressional Budget Office (CBO)
U.S. Bureau of Labor Statistics (BLS)
Federal Reserve Economic Data (FRED Charts)
CME Fed Watch
U.S. Treasury – Yields
U.S. Census Bureau
Institute for Supply Management (ISM)
Weekly DOL Employment Data
BLS Monthly Jobs Report
JOLTS
US Energy Admin (EIA)
BLS Consumer Price Index CPI
BLS Producer Price Index PPI
Atlanta Fed GDPNOW
NY Fed Nowcast GDP
US Census Bureau Housing Starts
Consumer Credit
USCB Retail Sales
Construction Spending
Federal Reserve Dot Plots
NY Empire Index
Philadelphia Federal Reserve
P/E Ratio Data -Yardeni Research
Technical Analysis Info:
StockCharts.com – Financial Charts
Exponential vs Simple moving average
Other Links:
1973 Arab Oil Embargo
Hunt Brothers Silver
Long-Term Capital bailout
Categories:
Tags: