Good Life Advisors – Talking Points – Week 37
Is the wall of worry too steep to continue climbing? Inflation, Chip Shortage, Debt Limit and now Evergrande.
Markets were mostly flat to down this week with small caps being the outlier rising slightly. We saw a combination of supply chain, input price pressures and Delta variant spread drive more cautious corporate updates this week. There also seems to be an increasingly unsettled macro narrative rearing its head. There was a little reprieve when the CPI showed Consumer prices rising 0.3% m/m in August following a 0.5% gain in July. Core consumer prices increased just 0.1% m/m in August following a 0.3% gain in July. These numbers provide support to Chairman Powell’s argument, that the rise in prices is largely temporary. We‘ll get a some more inflation insight and what steps the Fed plans on taking, this coming week at their scheduled meeting.
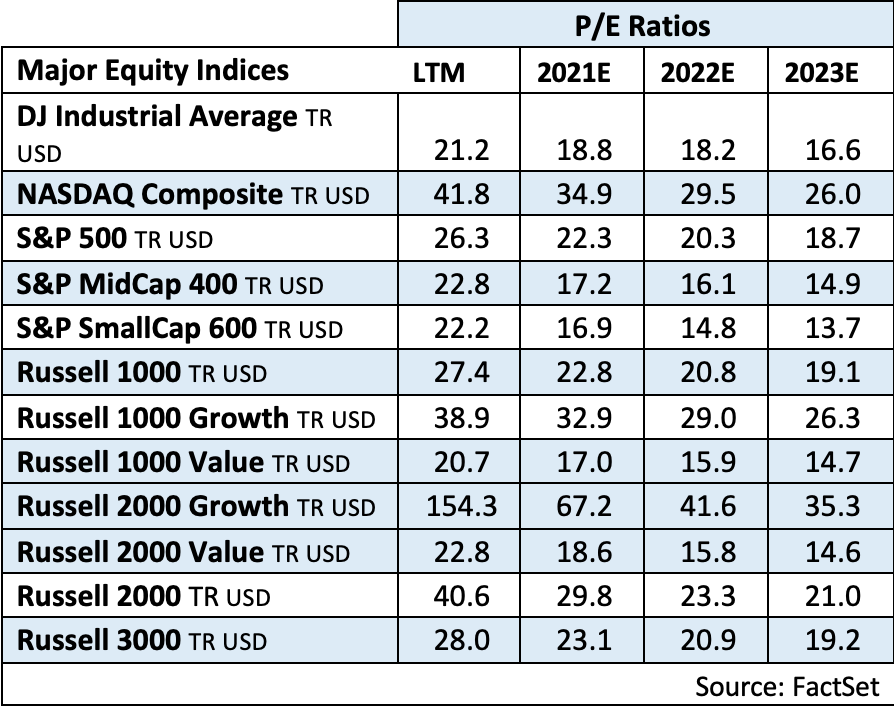
While the recent pullback has been fairly limited at the index level, there has been much more damage beneath the surface and the path of least resistance has been to the downside. In addition, press reports (WSJ, CNBC) have highlighted some heightened caution surrounding the market. Concerns have largely revolved around reopening/economic normalization headwinds from the spread of the Delta variant; earnings warnings stemming from lingering supply chain and input price pressures; a near-term Fed tapering announcement that represents a big piece of the peak monetary policy theme; a waning fiscal tailwind and benefits cliff; heightened uncertainty about the prospects for both the physical and human infrastructure stimulus packages; higher taxes in Democrats’ reconciliation plan; debt ceiling drama; and China’s broadening regulatory crackdown and reluctance to unleash more meaningful policy support. There has also been the usual discussion about stretched valuation, which as you can see from the table below is a conversation that will not being going away anytime soon.
And just to add some steepness to the wall of worry, this week it was widely reported that Evergrande Group, China’s second largest real estate company, will miss an interest payment due tomorrow (9/20). Evergrande is ranked 122nd in the world by revenue. We don’t know if this will be just something else that adds to that negative macro sentiment or if it will have any ripple effects in China as a whole.

Fixed Income
The Fed is not expected to make a formal tapering announcement at next week’s meeting. The consensus seems to revolve around a November announcement with the central bank actually beginning the tapering process in December or early 2022 at a pace of $15B a month ($10B Treasuries and $5B MBS). However, the September FOMC statement is expected to provide more explicit tapering hints. Previews noted it could say that if the economy evolves largely in line with expectations, it could be appropriate to start reducing the pace of asset purchases this year. Some previews added that Powell could confirm during his press conference that the Fed is providing its long promised advance notice. The dot plot will be the other key area of focus in the updated Summary of Economic Projections. The median projection for 2022 is expected to continue to show no rate change, though economists flagged slight upside risk.
July FOMC Statement FOMC Minutes Credit, Liquidity and Balance Sheet Federal Reserve Dot Plots
US Corporate Debt Tops 7 trillion. Treasury.gov yields FOMC Policy Normalization Statement Longer Run Goals August 2020
Global Bond Yields
Daily US Treasury Yields
Foreign Exchange Market
Energy Complex
The Baker Hughes rig count increased by 9 this week. There are 512 oil and gas rigs operating in the US – Up 257 over last year.
Metals Complex
Employment Picture
Weekly Unemployment Claims – Released Thursday 9/16/2021 – The four-week moving average of initial jobless claims hit a pandemic low, at 335k. The week ending September 11th claims increased 20k to 332k.
https://fred.stlouisfed.org/graph/?g=GTmT
Job Openings & Labor Turnover Survey JOLTS – Released 9/8/2021 – The U.S. Bureau of Labor Statistics reported the number and rate of job openings increased to 10.9 million on the last business day of July. Over the month, hires were little changed at 6.7 million and separations were little changed at 5.8 million. Within separations, the quits rate was unchanged at 2.7%. The layoffs and discharges rates were little changed at 1.0%.
August Jobs Report – BLS Summary – Released 9/3/2021 – The US Economy added 235k nonfarm jobs in August and the Unemployment rate declined 0.2% to 5.2. Average hourly earnings increased by 17 cents to $30.73. Hiring highlights include +74k Professional and Business Services, +53 Transportation and Warehousing, +37k Manufacturing, and +35 Education and Health Services.
- Average hourly earnings increased by 17 cents to $30.73.
- U3 unemployment rate declined 0.2% to 5.2%. U6 unemployment rate declined to 8.8%.
- The labor force participation rate was unchanged at 61.7%.
- Average work week was unchanged at 34.7 hours.
Employment Cost Index – Released 7/30/2021 – Compensation costs for civilian workers increased 0.7% for the 3-month period ending in June 2021. The 12-month period ending in June 2021 saw compensation costs increase by 2.9%. The 12-month period ending June 2020 increased 2.7%. Wages and salaries increased 3.2 percent over the year and increased 2.9 percent for the 12-month period ending in June 2020. Benefit costs increased 2.2 percent over the year and increased 2.2 percent for the 12-month period ending in June 2020. This report is published quarterly.
This Week’s Economic Data
Links take you to the data source
Retail Sales – Released 9/16/2021 – U.S. retail sales for August increased 0.7% to $618.7 billion and retail sales are 15.1% above August 2020. U.S. retail sales are up 13.1% year/y.
Industrial Production and Capacity Utilization – Released 9/15/2021 – In August Industrial production increased 0.4%. Manufacturing increased 0.2%. Mining decreased 0.6%. Utilities output increased 3.3%. Total industrial production was 5.9% higher in August than a year ago, and 0.3% above its pre-pandemic level. Total capacity utilization increased 0.2% to 76.4% in August which is 3.2% below its long run average.
Consumer Price Index – Released 9/14/2021 – Consumer prices rose 0.3% m/m in August following a 0.5% gain in July. Core consumer prices increased 0.1% m/m in August following a 0.3% gain in July.
Recent Economic Data
Links take you to the data source
Producer Price Index – Released 9/10/2021 – The Producer Price Index for final demand increased 0.7% in August. PPI less food and energy increased 0.6% in August. The change in PPI for final demand has increased 8.3% year/y.
Consumer Credit – Released 9/8/2021 – Consumer credit increased at a seasonally adjusted annual rate of 4.7 percent in July. Revolving credit increased at an annual rate of 6.7 percent, while nonrevolving credit increased at an annual rate of 4.1 percent.
US Light Vehicle Sales – Released 9/3/2021 – U.S. light vehicle sales were at a seasonally adjusted annual rate (SAAR) of 13.057 million units in August.
PMI Non-Manufacturing Index – Released 9/3/2021 – Economic activity in the non-manufacturing sector grew in August for the 15th consecutive month. ISM Non-Manufacturing registered 61.7 percent, which is 2.4 percentage points below the adjusted July reading of 64.1 percent.
U.S. Trade Balance – Released 9/2/2021 – According to the U.S. Census Bureau of Economic Analysis the goods and services deficit decreased in July by $3.2 billion to $70.1 billion. July exports were $212.8 billion, $2.8 billion more than June exports. July imports were $282.9 billion, $0.4 billion less than June imports. Year to date the goods and services deficit increased $131.0 billion or 37.1%, from the same period in 2020. Year to date exports and imports increased $205.0 billion or 16.8% and increased $336.0 billion or 21.3% respectively.
PMI Manufacturing Index – Released 9/1/2021 – August PMI increased 0.4% to 59.9% up from July’s reading of 59.5%. The New Orders Index was up 1.8% from July’s reading of 64.9% to 66.7%. The Production Index registered 60.0%, up 1.6%.
U.S. Construction Spending – Released 9/1/2021 – Construction spending increased 0.3% in July measuring at a seasonally adjusted annual rate of $1,568.8 billion. The July figure is 9.0% above the June 2020 estimate. Private construction spending was 0.3% above the revised June estimate at $1,227.8 billion. Public construction spending was 0.7% above the revised June estimate at $337.8 billion.
Chicago PMI – Released 8/31/2021 – Chicago PMI decreased to 66.8 points in August. Among the five main indicators, Order Backlogs saw the largest increase. That was followed by Supplier Deliveries, while Production saw the largest decline.
Consumer Confidence – Released 8/31/2021 – The Consumer confidence index declined in August. The Index now stands at 113.8, down from 125.1 in July.
Personal Income – Released 8/27/2021 – Personal income increased $225.9 billion or 1.1 percent in July according to estimates released today by the Bureau of Economic Analysis. Disposable personal income (DPI) increased $198.0 billion or 1.1 percent and personal consumption expenditures (PCE) increased $42.2 billion or 0.3 percent.
Second Estimate of 2nd Quarter 2021 GDP – Released 8/26/2021 – Real gross domestic product (GDP) increased at an annual rate of 6.6 percent in the second quarter of 2021, according to the second estimate released by the Bureau of Economic Analysis. The Second GDP estimate is based on more complete source data than were available for the “advance” estimate issued last month. In the advance estimate, the increase in real GDP was 6.5 percent. The first quarter observed a 6.3 percent increase in real GDP. The increase in real GDP in the second quarter reflected increases in personal consumption expenditures (PCE), nonresidential fixed investment, exports, and state and local government spending that were partly offset by decreases in private inventory investment, residential fixed investment, and federal government spending. Imports, which are a subtraction in the calculation of GDP, increased. The Second GDP estimate reflects upward revisions to nonresidential fixed investment and exports that were partly offset by downward revisions to private inventory investment, residential fixed investment, and state and local government spending. Imports, which are a subtraction in the calculation of GDP, were revised down
Durable Goods – Released 8/25/2021 – New orders for manufactured durable goods in July decreased $0.4 billion or 0.1% to $257.2 billion. Transportation equipment led the decrease declining $1.7 billion or 2.2% to $75.3 billion.
New Residential Sales – Released 8/24/2021 – Sales of new single-family homes increased 1.0% to 708k, seasonally adjusted, in July. The median sales price of new homes sold in July was $390,500 with an average sales price of $446,000. At the end of July, the seasonally adjusted estimate of new homes for sale was 367k. This represents a supply of 6.2 months at the current sales rate.
Existing Home Sales – Released 8/23/2021 – Existing home sales increased in July. Sales increased 2.0% to a seasonally adjusted rate of 5.99 million in July. Sales are currently up 1.5% from one year ago. Housing inventory sits at 1.32 million units. Up 7.3% from June’s inventory. Down 12.0% over last year. Unsold inventory sits at a 2.6-month supply. The median existing home price for all housing types was $359,900.
Housing Starts – Released 8/18/2021 – New home starts in July were at a seasonally adjusted annual rate of 1.534 million; down 7.0% below June, but 2.5% above last July’s rate. Building Permits were at a seasonally adjusted annual rate of 1.635 million, up 2.6% compared to June, and up 6.0% over last year.
Next week we get data on Housing Starts, Existing Home Sales, and New Residential Sales.
Data Sources:
Bureau of Economic Analysis (BEA)
Congressional Budget Office (CBO)
U.S. Bureau of Labor Statistics (BLS)
Federal Reserve Economic Data (FRED Charts)
CME Fed Watch
U.S. Treasury – Yields
U.S. Census Bureau
Institute for Supply Management (ISM)
Weekly DOL Employment Data
BLS Monthly Jobs Report
JOLTS
US Energy Admin (EIA)
BLS Consumer Price Index CPI
BLS Producer Price Index PPI
Atlanta Fed GDPNOW
NY Fed Nowcast GDP
US Census Bureau Housing Starts
Consumer Credit
USCB Retail Sales
Construction Spending
Federal Reserve Dot Plots
NY Empire Index
Philadelphia Federal Reserve
P/E Ratio Data -Yardeni Research
Technical Analysis Info:
StockCharts.com – Financial Charts
Exponential vs Simple moving average
Other Links:
1973 Arab Oil Embargo
Hunt Brothers Silver
Long-Term Capital bailout


Week 37 Talking Points
Good Life Advisors – Talking Points – Week 37
Is the wall of worry too steep to continue climbing? Inflation, Chip Shortage, Debt Limit and now Evergrande.
Markets were mostly flat to down this week with small caps being the outlier rising slightly. We saw a combination of supply chain, input price pressures and Delta variant spread drive more cautious corporate updates this week. There also seems to be an increasingly unsettled macro narrative rearing its head. There was a little reprieve when the CPI showed Consumer prices rising 0.3% m/m in August following a 0.5% gain in July. Core consumer prices increased just 0.1% m/m in August following a 0.3% gain in July. These numbers provide support to Chairman Powell’s argument, that the rise in prices is largely temporary. We‘ll get a some more inflation insight and what steps the Fed plans on taking, this coming week at their scheduled meeting.
While the recent pullback has been fairly limited at the index level, there has been much more damage beneath the surface and the path of least resistance has been to the downside. In addition, press reports (WSJ, CNBC) have highlighted some heightened caution surrounding the market. Concerns have largely revolved around reopening/economic normalization headwinds from the spread of the Delta variant; earnings warnings stemming from lingering supply chain and input price pressures; a near-term Fed tapering announcement that represents a big piece of the peak monetary policy theme; a waning fiscal tailwind and benefits cliff; heightened uncertainty about the prospects for both the physical and human infrastructure stimulus packages; higher taxes in Democrats’ reconciliation plan; debt ceiling drama; and China’s broadening regulatory crackdown and reluctance to unleash more meaningful policy support. There has also been the usual discussion about stretched valuation, which as you can see from the table below is a conversation that will not being going away anytime soon.
And just to add some steepness to the wall of worry, this week it was widely reported that Evergrande Group, China’s second largest real estate company, will miss an interest payment due tomorrow (9/20). Evergrande is ranked 122nd in the world by revenue. We don’t know if this will be just something else that adds to that negative macro sentiment or if it will have any ripple effects in China as a whole.
Table of Contents
Fixed Income
The Fed is not expected to make a formal tapering announcement at next week’s meeting. The consensus seems to revolve around a November announcement with the central bank actually beginning the tapering process in December or early 2022 at a pace of $15B a month ($10B Treasuries and $5B MBS). However, the September FOMC statement is expected to provide more explicit tapering hints. Previews noted it could say that if the economy evolves largely in line with expectations, it could be appropriate to start reducing the pace of asset purchases this year. Some previews added that Powell could confirm during his press conference that the Fed is providing its long promised advance notice. The dot plot will be the other key area of focus in the updated Summary of Economic Projections. The median projection for 2022 is expected to continue to show no rate change, though economists flagged slight upside risk.
July FOMC Statement FOMC Minutes Credit, Liquidity and Balance Sheet Federal Reserve Dot Plots
US Corporate Debt Tops 7 trillion. Treasury.gov yields FOMC Policy Normalization Statement Longer Run Goals August 2020
Global Bond Yields
Daily US Treasury Yields
Foreign Exchange Market
Energy Complex
The Baker Hughes rig count increased by 9 this week. There are 512 oil and gas rigs operating in the US – Up 257 over last year.
Metals Complex
Employment Picture
Weekly Unemployment Claims – Released Thursday 9/16/2021 – The four-week moving average of initial jobless claims hit a pandemic low, at 335k. The week ending September 11th claims increased 20k to 332k.
https://fred.stlouisfed.org/graph/?g=GTmT
Job Openings & Labor Turnover Survey JOLTS – Released 9/8/2021 – The U.S. Bureau of Labor Statistics reported the number and rate of job openings increased to 10.9 million on the last business day of July. Over the month, hires were little changed at 6.7 million and separations were little changed at 5.8 million. Within separations, the quits rate was unchanged at 2.7%. The layoffs and discharges rates were little changed at 1.0%.
August Jobs Report – BLS Summary – Released 9/3/2021 – The US Economy added 235k nonfarm jobs in August and the Unemployment rate declined 0.2% to 5.2. Average hourly earnings increased by 17 cents to $30.73. Hiring highlights include +74k Professional and Business Services, +53 Transportation and Warehousing, +37k Manufacturing, and +35 Education and Health Services.
Employment Cost Index – Released 7/30/2021 – Compensation costs for civilian workers increased 0.7% for the 3-month period ending in June 2021. The 12-month period ending in June 2021 saw compensation costs increase by 2.9%. The 12-month period ending June 2020 increased 2.7%. Wages and salaries increased 3.2 percent over the year and increased 2.9 percent for the 12-month period ending in June 2020. Benefit costs increased 2.2 percent over the year and increased 2.2 percent for the 12-month period ending in June 2020. This report is published quarterly.
This Week’s Economic Data
Links take you to the data source
Retail Sales – Released 9/16/2021 – U.S. retail sales for August increased 0.7% to $618.7 billion and retail sales are 15.1% above August 2020. U.S. retail sales are up 13.1% year/y.
Industrial Production and Capacity Utilization – Released 9/15/2021 – In August Industrial production increased 0.4%. Manufacturing increased 0.2%. Mining decreased 0.6%. Utilities output increased 3.3%. Total industrial production was 5.9% higher in August than a year ago, and 0.3% above its pre-pandemic level. Total capacity utilization increased 0.2% to 76.4% in August which is 3.2% below its long run average.
Consumer Price Index – Released 9/14/2021 – Consumer prices rose 0.3% m/m in August following a 0.5% gain in July. Core consumer prices increased 0.1% m/m in August following a 0.3% gain in July.
Recent Economic Data
Links take you to the data source
Producer Price Index – Released 9/10/2021 – The Producer Price Index for final demand increased 0.7% in August. PPI less food and energy increased 0.6% in August. The change in PPI for final demand has increased 8.3% year/y.
Consumer Credit – Released 9/8/2021 – Consumer credit increased at a seasonally adjusted annual rate of 4.7 percent in July. Revolving credit increased at an annual rate of 6.7 percent, while nonrevolving credit increased at an annual rate of 4.1 percent.
US Light Vehicle Sales – Released 9/3/2021 – U.S. light vehicle sales were at a seasonally adjusted annual rate (SAAR) of 13.057 million units in August.
PMI Non-Manufacturing Index – Released 9/3/2021 – Economic activity in the non-manufacturing sector grew in August for the 15th consecutive month. ISM Non-Manufacturing registered 61.7 percent, which is 2.4 percentage points below the adjusted July reading of 64.1 percent.
U.S. Trade Balance – Released 9/2/2021 – According to the U.S. Census Bureau of Economic Analysis the goods and services deficit decreased in July by $3.2 billion to $70.1 billion. July exports were $212.8 billion, $2.8 billion more than June exports. July imports were $282.9 billion, $0.4 billion less than June imports. Year to date the goods and services deficit increased $131.0 billion or 37.1%, from the same period in 2020. Year to date exports and imports increased $205.0 billion or 16.8% and increased $336.0 billion or 21.3% respectively.
PMI Manufacturing Index – Released 9/1/2021 – August PMI increased 0.4% to 59.9% up from July’s reading of 59.5%. The New Orders Index was up 1.8% from July’s reading of 64.9% to 66.7%. The Production Index registered 60.0%, up 1.6%.
U.S. Construction Spending – Released 9/1/2021 – Construction spending increased 0.3% in July measuring at a seasonally adjusted annual rate of $1,568.8 billion. The July figure is 9.0% above the June 2020 estimate. Private construction spending was 0.3% above the revised June estimate at $1,227.8 billion. Public construction spending was 0.7% above the revised June estimate at $337.8 billion.
Chicago PMI – Released 8/31/2021 – Chicago PMI decreased to 66.8 points in August. Among the five main indicators, Order Backlogs saw the largest increase. That was followed by Supplier Deliveries, while Production saw the largest decline.
Consumer Confidence – Released 8/31/2021 – The Consumer confidence index declined in August. The Index now stands at 113.8, down from 125.1 in July.
Personal Income – Released 8/27/2021 – Personal income increased $225.9 billion or 1.1 percent in July according to estimates released today by the Bureau of Economic Analysis. Disposable personal income (DPI) increased $198.0 billion or 1.1 percent and personal consumption expenditures (PCE) increased $42.2 billion or 0.3 percent.
Second Estimate of 2nd Quarter 2021 GDP – Released 8/26/2021 – Real gross domestic product (GDP) increased at an annual rate of 6.6 percent in the second quarter of 2021, according to the second estimate released by the Bureau of Economic Analysis. The Second GDP estimate is based on more complete source data than were available for the “advance” estimate issued last month. In the advance estimate, the increase in real GDP was 6.5 percent. The first quarter observed a 6.3 percent increase in real GDP. The increase in real GDP in the second quarter reflected increases in personal consumption expenditures (PCE), nonresidential fixed investment, exports, and state and local government spending that were partly offset by decreases in private inventory investment, residential fixed investment, and federal government spending. Imports, which are a subtraction in the calculation of GDP, increased. The Second GDP estimate reflects upward revisions to nonresidential fixed investment and exports that were partly offset by downward revisions to private inventory investment, residential fixed investment, and state and local government spending. Imports, which are a subtraction in the calculation of GDP, were revised down
Durable Goods – Released 8/25/2021 – New orders for manufactured durable goods in July decreased $0.4 billion or 0.1% to $257.2 billion. Transportation equipment led the decrease declining $1.7 billion or 2.2% to $75.3 billion.
New Residential Sales – Released 8/24/2021 – Sales of new single-family homes increased 1.0% to 708k, seasonally adjusted, in July. The median sales price of new homes sold in July was $390,500 with an average sales price of $446,000. At the end of July, the seasonally adjusted estimate of new homes for sale was 367k. This represents a supply of 6.2 months at the current sales rate.
Existing Home Sales – Released 8/23/2021 – Existing home sales increased in July. Sales increased 2.0% to a seasonally adjusted rate of 5.99 million in July. Sales are currently up 1.5% from one year ago. Housing inventory sits at 1.32 million units. Up 7.3% from June’s inventory. Down 12.0% over last year. Unsold inventory sits at a 2.6-month supply. The median existing home price for all housing types was $359,900.
Housing Starts – Released 8/18/2021 – New home starts in July were at a seasonally adjusted annual rate of 1.534 million; down 7.0% below June, but 2.5% above last July’s rate. Building Permits were at a seasonally adjusted annual rate of 1.635 million, up 2.6% compared to June, and up 6.0% over last year.
Next week we get data on Housing Starts, Existing Home Sales, and New Residential Sales.
Data Sources:
Bureau of Economic Analysis (BEA)
Congressional Budget Office (CBO)
U.S. Bureau of Labor Statistics (BLS)
Federal Reserve Economic Data (FRED Charts)
CME Fed Watch
U.S. Treasury – Yields
U.S. Census Bureau
Institute for Supply Management (ISM)
Weekly DOL Employment Data
BLS Monthly Jobs Report
JOLTS
US Energy Admin (EIA)
BLS Consumer Price Index CPI
BLS Producer Price Index PPI
Atlanta Fed GDPNOW
NY Fed Nowcast GDP
US Census Bureau Housing Starts
Consumer Credit
USCB Retail Sales
Construction Spending
Federal Reserve Dot Plots
NY Empire Index
Philadelphia Federal Reserve
P/E Ratio Data -Yardeni Research
Technical Analysis Info:
StockCharts.com – Financial Charts
Exponential vs Simple moving average
Other Links:
1973 Arab Oil Embargo
Hunt Brothers Silver
Long-Term Capital bailout
Categories:
Tags: