Good Life Advisors – Talking Points – Week 36
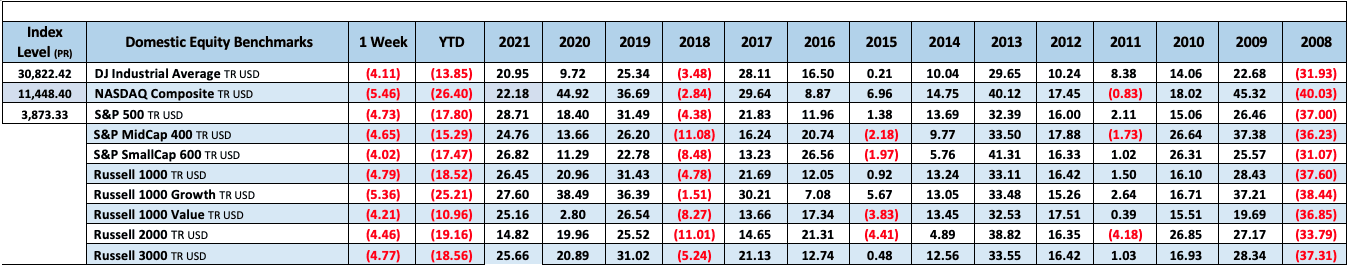
Major US equity indices were notably lower this week, with the S&P logging its fourth weekly decline in the past five weeks and now down nearly 10% since its recent peak on 12-Aug. Growth was an underperformer to value, but both factors were lower. Treasuries were weaker with the curve seeing a big flattening move this week. The 2/10 spread moved back toward the deeply negative level it touched last month that was the lowest since 2000, with the 2Y at one point climbing as high as 3.9%. The dollar index was up 0.6% for the week, with strength against the major crosses (particularly sterling). Gold was down 3% for the week, still near to two-year lows despite a bit of strength Friday. WTI crude logged its third consecutive weekly decline, dropping 1.9% amid continued concerns about weakening global demand.
The market was in risk-off mode this week, with a hotter-than-expected August CPI report on Tuesday sparking a big selloff (the S&P logged its worst session since June 2020) and raising fears of a more aggressive Fed and a longer wait before any dovish pivot. It also somewhat undercut economic “soft landing” hopes, which had been cited as a source of support as of late. At the same time, there was note this week of the World Bank warning of aggressive tightening possibly leading to global recession, Q3 GDP estimates coming down, 30-year mortgage rates topping 6% for the first time since 2008, and surveys showing an ongoing waning of CEO confidence. Moreover, while there has been some talk about earnings resilience and the bar seems to have been lowered for Q3, the week saw numerous negative announcements from more cyclical names. Nevertheless, the week’s news was not uniformly bad, with surveys pointing to a continued decline in consumers’ inflation expectations and China easing Covid restrictions in Chengdu.
Away from the main themes, there was limited newsflow of note. Despite a lot of press focus, fears of a nationwide railroad strike evaporated after Washington helped secure a tentative labor agreement (as many analysts had expected). There was a lot of attention last weekend on Ukraine’s surprisingly successful counteroffensive, though this has not been a big driver for markets. There was also somewhat more political chatter bubbling about the coming government-funding debates and November’s midterms, though these are not yet front-burner issues for the market.
Headline August CPI surprised to the upside, rising 0.1% for the month against forecasts for a 0.1% decline. Moreover, Core CPI was up 0.6%, higher than the 0.35% consensus. There was a lot of attention on still-high services inflation, with shelter and medical care among the contributors. The pace of food inflation decelerated, but still managed to post the highest y/y print since 1979 (+11.4%). This release served to further dent the peak inflation narrative and sparked some market bets that the FOMC will hike by 100bp at its meeting next week. While this remains a minority view, the Street is now looking for a higher terminal rate and has backed off some bets for a dovish Fed pivot in 2023 (which would match the consistent recent Fedspeak favoring a higher-for-longer approach). Note that Wednesday’s FOMC meeting will also bring an updated Summary of Economic Projections (SEP).
Among the other economic releases this week, August PPI dropped 0.1% m/m, better than consensus for a flat reading, while core PPI came in slightly higher than forecasts. August retail sales were stronger than expected, though control-group sales were weaker than expected. Regional Fed manufacturing gauges were mixed, with NY’s Empire survey improving but Philadelphia’s re-entering contractionary territory. However, both reports showed slower prices-paid growth. Both initial jobless claims and continuing claims were down w/w. The preliminary read for UMich consumer sentiment showed another drop in respondents’ one- and five-year inflation expectations (consumer inflation expectations also continued to ease back in the NY Fed’s August consumer survey).

Fixed Income
Yield Curve
July FOMC Statement July Fed Minutes Balance Sheet Reduction Plan Credit, Liquidity and Balance Sheet Federal Reserve Dot Plots US Corporate Debt Tops 7 Trillion. Treasury.gov yields FOMC Policy Normalization Statement Longer- Run Goals Jan 2022
Foreign Exchange Market
As the US dollar surges, American buyers splurge on European homes – So says the WSJ
Energy Complex
The Baker Hughes rig count increased by 4 this week. There are 763 oil and gas rigs operating in the US – Up 251 over last year.
Metals Complex
Employment Picture
Weekly Unemployment Claims – Released Thursday 9/15/2022 – The week ending September 10th observed a decrease of 5k in initial claims, decreasing to 213k. The four-week moving average of initial jobless claims decreased 8k to 224k.
August Jobs Report – BLS Summary Released 9/2/2022 –The US Economy added 315k nonfarm jobs in August and the Unemployment rate stayed increased to 3.7%. Average hourly earnings increased 10 to $32.36. Hiring highlights include +68k Education and Health Services, +68k Professional and Business Services, and +44k Retail Trade.
- Average hourly earnings increased 10 cents to $32.36.
- U3 unemployment rate remained increased 0.2% to 3.7%. U6 unemployment rate increased 0.3% to 7%.
- The labor force participation rate was increased 0.3% to 62.4%.
- Average work week decreased 0.1 to 34.5 hours.
Job Openings & Labor Turnover Survey – JOLTS – Released 8/30/2022 – The US Bureau of Labor Statistics reported the number and rate of job openings was little changed at 11.2 million on the last business day of July. OVer the month, hires were little changed at 6.4 million and separations were little changed at 5.9 million. Within separations, quits were little changed at 4.2 million. The layoffs and discharges rates were little changed at 1.4 million.
Employment Cost Index – Released 7/29/2022 – Compensation costs for civilian workers increased 1.3% for the 2-month period ending in June 2022. The 12-month period ending in June 2022 saw compensation costs increase by 5.1%. The 12-month period ending June 2021 increased 2.9%/ Wages and salaries increased 5.3% over the year and increased 3.2% for the 12-month period ending in June 2021. Benefit costs increased 4.8% over the year and increased 2.2% for the 12-month period ending in June 2021. This report is published quarterly.
This Week’s Economic Data
Links take you to the data source
Retail Sales – Released 9/15/2022 – US retail sales for August increased 0.3% to $683.3 billion and retail sales are 9.1% above August 2021. US retail sales for the June 2022 through August 2022 period were up 9.3% from the same period a year ago.
Industrial Production and Capacity Utilization Released 9/15/2022 – In August, industrial production decreased 0.2%, manufacturing increased 0.1%, utilities output decreased 2.3%, mining output was unchanged, total industrial production was 3.7% higher in August than a year ago. Total capacity utilization decreased 0.2% in August to 80%, which is 0.4% above its long run average.
Producer Price Index – Released 9/14/2022 – The producer price index for final demand decreased 0.1% in August. PPI less food and energy increased 0.2%. The change in PPI for final demand has increased 8.7% year/y.
Consumer Price Index – Released 9/13/2022 – Consumer prices increased 0.1% m/m in August following no change in July. Consumer prices are up 8.3% for the 12-month period ending in August. Core consumer prices increased 0.6% m/m in August.
This Week’s Economic Data
Links take you to the data source
Consumer Credit – Released 9/8/2022 – Consumer credit increased at a seasonally adjusted annual rate of 6.2% in July 2022. Revolving credit increased at an annual rate of 11.6%, while nonrevolving credit increased at an annual rate of 4.4%.
U.S. Trade Balance – Released 9/7/2022 – According to the US Census Bureau of Economic Analysis, the goods and services deficit decreased in July by $10.2 billion to $70.6 billion. July exports were $259.3 billion, $0.5 billion more than June exports. July imports were $329.9 billion, $9.7 billion less than June imports. Year to date, the goods and services deficit increased $136.6 billion or 29%, from the same period on 2021. Exports increased $286.4 billion or 19.9%. Imports increased $423 billion or 22.1%.
PMI Non-Manufacturing Index – Released 9/6/2022 – Economic activity in the non-manufacturing sector grew in August for the 27th consecutive month. ISM Non-Manufacturing registered 56.9%. which is 0.2 percentage points above the July reading of 56.7%.
PMI Manufacturing Index – Released 9/1/2022 – August PMI was unchanged at 52.8%. The New Orders Index was 51.3%, up 3.3% from July’s reading of 48%. The Production Index registered 50.4%, down 3.1%.
U.S. Construction Spending – Released 9/1/2022 – Construction spending decreased 0.4% in July measuring at a seasonally adjusted annual rate of $1,777.3 billion. The July figure is 8.5% above the July 2021 estimate. Private construction spending declined 0.8% from the revised June estimate at $1,436.4 billion. Public construction spending was 1.5% above the revised June estimate at $353.1 billion.
Chicago PMI – Released 8/31/2022 – Chicago PMI was relatively unchanged in August at 52.20.
Consumer Confidence – Released 8/30/2022 – The consumer confidence index increased in August following three consecutive months of decline. The Index now stands at 103.2, up from 95.3 in July.
US Light Vehicle Sales – Released 8/26/2022 – US light vehicle sales were at a seasonally adjusted annual rate (SAAR) of 13.333 million units in July.
Personal Income – Released 8/26/2022 – Personal income increased $47 billion or 0.2% in July according to estimates released today by the Bureau of Economic Analysis. Disposable Personal Income (DPI) increased $37.6 billion of 0.2% and Personal Consumption Expenditures (PCE) increased $23.7 billion or 0.1%.
Second Estimate of 2nd Quarter 2022 GDP Released 8/25/2022 – Real Gross Domestic Product (GDP) decreased at an annual rate of 0.6% in the second quarter of 2022, according to the second estimate released by the Bureau of Economic Analysis. GDP decreased 1.6% in the first quarter of 2022. Two quarters of negative GDP growth marks a technical recession. The GDP estimate released today is based on source data that are more complete than that of the advance estimate which saw real GDP decline 0.9% in the second quarter of 2022. The decrease in GDP reflected decreases in private inventory investment, residential fixed investment, federal government spending, state and local government spending, and nonresidential fixed investment that were partly offset by increases in exports and Personal Consumption Expenditures (PCE). Imports, which are a subtraction in the calculation of GDP, increased. The update primarily reflects upward revisions to consumer spending and private inventory investment that were partly offset by a downward revision to residential fixed investment.
Durable Goods Released 8/24/2022 – New orders for manufactured durable goods in July decreased less than $0.1 billion to $273.5 billion. Transportation equipment led the decrease down $0.6 billion or 0.7% to $93 billion.
New Residential Sales Released 8/23/2022 – Sales of new single-family homes decreased 12.6% to 511k, seasonally adjusted, in July. The median sales price of new homes sold in July was $439,400 with an average sales price of $546,800. At the end of July, the seasonally adjusted estimate of new homes for sale was 464k. This represents a supply of 10.9 months at the current sales rate.
Existing Home Sales – Released 8/18/2022 – Existing home sales decreased in July marking six-consecutive months of declines. Sales declined 5.9% to a seasonally adjusted rate of 4.81 million in JUly. Sales decreased 20.2% year-over-year. Housing inventory sits at 1.31 million units, up 4.8% from June’s inventory and up 2.4% over last year. Unsold inventory sits at a 3.3-month supply. The median existing home price for all housing types was $403,800, which is up 10.8% from July 2021. This marks 125 consecutive months of year-over-year increased, the longest-running streak on record.
Housing Starts – Released 8/16/2022 – New home starts in July were at a seasonally adjusted annual rate of 1.446 million; down 9.6% below June, and 8.1% below last July’s rate. Building permits were at a seasonally adjusted annual rate of 1.674 million; down 1.3% compared to June, but up 1.1% over last year.
Next week we get data on Housing Starts and Existing Home Sales.
Data Sources:
Bureau of Economic Analysis (BEA)
Congressional Budget Office (CBO)
U.S. Bureau of Labor Statistics (BLS)
Federal Reserve Economic Data (FRED Charts)
CME Fed Watch
U.S. Treasury – Yields
U.S. Census Bureau
Institute for Supply Management (ISM)
Weekly DOL Employment Data
BLS Monthly Jobs Report
JOLTS
US Energy Admin (EIA)
BLS Consumer Price Index CPI
BLS Producer Price Index PPI
Atlanta Fed GDPNOW
NY Fed Nowcast GDP
US Census Bureau Housing Starts
Consumer Credit
USCB Retail Sales
Construction Spending
Federal Reserve Dot Plots
NY Empire Index
Philadelphia Federal Reserve
P/E Ratio Data -Yardeni Research
Technical Analysis Info:
StockCharts.com – Financial Charts
Exponential vs Simple moving average
Other Links:
1973 Arab Oil Embargo
Hunt Brothers Silver
Long-Term Capital bailout


Week 36 Talking Points
Table of Contents
Good Life Advisors – Talking Points – Week 36
Major US equity indices were notably lower this week, with the S&P logging its fourth weekly decline in the past five weeks and now down nearly 10% since its recent peak on 12-Aug. Growth was an underperformer to value, but both factors were lower. Treasuries were weaker with the curve seeing a big flattening move this week. The 2/10 spread moved back toward the deeply negative level it touched last month that was the lowest since 2000, with the 2Y at one point climbing as high as 3.9%. The dollar index was up 0.6% for the week, with strength against the major crosses (particularly sterling). Gold was down 3% for the week, still near to two-year lows despite a bit of strength Friday. WTI crude logged its third consecutive weekly decline, dropping 1.9% amid continued concerns about weakening global demand.
The market was in risk-off mode this week, with a hotter-than-expected August CPI report on Tuesday sparking a big selloff (the S&P logged its worst session since June 2020) and raising fears of a more aggressive Fed and a longer wait before any dovish pivot. It also somewhat undercut economic “soft landing” hopes, which had been cited as a source of support as of late. At the same time, there was note this week of the World Bank warning of aggressive tightening possibly leading to global recession, Q3 GDP estimates coming down, 30-year mortgage rates topping 6% for the first time since 2008, and surveys showing an ongoing waning of CEO confidence. Moreover, while there has been some talk about earnings resilience and the bar seems to have been lowered for Q3, the week saw numerous negative announcements from more cyclical names. Nevertheless, the week’s news was not uniformly bad, with surveys pointing to a continued decline in consumers’ inflation expectations and China easing Covid restrictions in Chengdu.
Away from the main themes, there was limited newsflow of note. Despite a lot of press focus, fears of a nationwide railroad strike evaporated after Washington helped secure a tentative labor agreement (as many analysts had expected). There was a lot of attention last weekend on Ukraine’s surprisingly successful counteroffensive, though this has not been a big driver for markets. There was also somewhat more political chatter bubbling about the coming government-funding debates and November’s midterms, though these are not yet front-burner issues for the market.
Headline August CPI surprised to the upside, rising 0.1% for the month against forecasts for a 0.1% decline. Moreover, Core CPI was up 0.6%, higher than the 0.35% consensus. There was a lot of attention on still-high services inflation, with shelter and medical care among the contributors. The pace of food inflation decelerated, but still managed to post the highest y/y print since 1979 (+11.4%). This release served to further dent the peak inflation narrative and sparked some market bets that the FOMC will hike by 100bp at its meeting next week. While this remains a minority view, the Street is now looking for a higher terminal rate and has backed off some bets for a dovish Fed pivot in 2023 (which would match the consistent recent Fedspeak favoring a higher-for-longer approach). Note that Wednesday’s FOMC meeting will also bring an updated Summary of Economic Projections (SEP).
Among the other economic releases this week, August PPI dropped 0.1% m/m, better than consensus for a flat reading, while core PPI came in slightly higher than forecasts. August retail sales were stronger than expected, though control-group sales were weaker than expected. Regional Fed manufacturing gauges were mixed, with NY’s Empire survey improving but Philadelphia’s re-entering contractionary territory. However, both reports showed slower prices-paid growth. Both initial jobless claims and continuing claims were down w/w. The preliminary read for UMich consumer sentiment showed another drop in respondents’ one- and five-year inflation expectations (consumer inflation expectations also continued to ease back in the NY Fed’s August consumer survey).
Fixed Income
Yield Curve
July FOMC Statement July Fed Minutes Balance Sheet Reduction Plan Credit, Liquidity and Balance Sheet Federal Reserve Dot Plots US Corporate Debt Tops 7 Trillion. Treasury.gov yields FOMC Policy Normalization Statement Longer- Run Goals Jan 2022
Foreign Exchange Market
As the US dollar surges, American buyers splurge on European homes – So says the WSJ
Energy Complex
The Baker Hughes rig count increased by 4 this week. There are 763 oil and gas rigs operating in the US – Up 251 over last year.
Metals Complex
Employment Picture
Weekly Unemployment Claims – Released Thursday 9/15/2022 – The week ending September 10th observed a decrease of 5k in initial claims, decreasing to 213k. The four-week moving average of initial jobless claims decreased 8k to 224k.
August Jobs Report – BLS Summary Released 9/2/2022 –The US Economy added 315k nonfarm jobs in August and the Unemployment rate stayed increased to 3.7%. Average hourly earnings increased 10 to $32.36. Hiring highlights include +68k Education and Health Services, +68k Professional and Business Services, and +44k Retail Trade.
Job Openings & Labor Turnover Survey – JOLTS – Released 8/30/2022 – The US Bureau of Labor Statistics reported the number and rate of job openings was little changed at 11.2 million on the last business day of July. OVer the month, hires were little changed at 6.4 million and separations were little changed at 5.9 million. Within separations, quits were little changed at 4.2 million. The layoffs and discharges rates were little changed at 1.4 million.
Employment Cost Index – Released 7/29/2022 – Compensation costs for civilian workers increased 1.3% for the 2-month period ending in June 2022. The 12-month period ending in June 2022 saw compensation costs increase by 5.1%. The 12-month period ending June 2021 increased 2.9%/ Wages and salaries increased 5.3% over the year and increased 3.2% for the 12-month period ending in June 2021. Benefit costs increased 4.8% over the year and increased 2.2% for the 12-month period ending in June 2021. This report is published quarterly.
This Week’s Economic Data
Links take you to the data source
Retail Sales – Released 9/15/2022 – US retail sales for August increased 0.3% to $683.3 billion and retail sales are 9.1% above August 2021. US retail sales for the June 2022 through August 2022 period were up 9.3% from the same period a year ago.
Industrial Production and Capacity Utilization Released 9/15/2022 – In August, industrial production decreased 0.2%, manufacturing increased 0.1%, utilities output decreased 2.3%, mining output was unchanged, total industrial production was 3.7% higher in August than a year ago. Total capacity utilization decreased 0.2% in August to 80%, which is 0.4% above its long run average.
Producer Price Index – Released 9/14/2022 – The producer price index for final demand decreased 0.1% in August. PPI less food and energy increased 0.2%. The change in PPI for final demand has increased 8.7% year/y.
Consumer Price Index – Released 9/13/2022 – Consumer prices increased 0.1% m/m in August following no change in July. Consumer prices are up 8.3% for the 12-month period ending in August. Core consumer prices increased 0.6% m/m in August.
This Week’s Economic Data
Links take you to the data source
Consumer Credit – Released 9/8/2022 – Consumer credit increased at a seasonally adjusted annual rate of 6.2% in July 2022. Revolving credit increased at an annual rate of 11.6%, while nonrevolving credit increased at an annual rate of 4.4%.
U.S. Trade Balance – Released 9/7/2022 – According to the US Census Bureau of Economic Analysis, the goods and services deficit decreased in July by $10.2 billion to $70.6 billion. July exports were $259.3 billion, $0.5 billion more than June exports. July imports were $329.9 billion, $9.7 billion less than June imports. Year to date, the goods and services deficit increased $136.6 billion or 29%, from the same period on 2021. Exports increased $286.4 billion or 19.9%. Imports increased $423 billion or 22.1%.
PMI Non-Manufacturing Index – Released 9/6/2022 – Economic activity in the non-manufacturing sector grew in August for the 27th consecutive month. ISM Non-Manufacturing registered 56.9%. which is 0.2 percentage points above the July reading of 56.7%.
PMI Manufacturing Index – Released 9/1/2022 – August PMI was unchanged at 52.8%. The New Orders Index was 51.3%, up 3.3% from July’s reading of 48%. The Production Index registered 50.4%, down 3.1%.
U.S. Construction Spending – Released 9/1/2022 – Construction spending decreased 0.4% in July measuring at a seasonally adjusted annual rate of $1,777.3 billion. The July figure is 8.5% above the July 2021 estimate. Private construction spending declined 0.8% from the revised June estimate at $1,436.4 billion. Public construction spending was 1.5% above the revised June estimate at $353.1 billion.
Chicago PMI – Released 8/31/2022 – Chicago PMI was relatively unchanged in August at 52.20.
Consumer Confidence – Released 8/30/2022 – The consumer confidence index increased in August following three consecutive months of decline. The Index now stands at 103.2, up from 95.3 in July.
US Light Vehicle Sales – Released 8/26/2022 – US light vehicle sales were at a seasonally adjusted annual rate (SAAR) of 13.333 million units in July.
Personal Income – Released 8/26/2022 – Personal income increased $47 billion or 0.2% in July according to estimates released today by the Bureau of Economic Analysis. Disposable Personal Income (DPI) increased $37.6 billion of 0.2% and Personal Consumption Expenditures (PCE) increased $23.7 billion or 0.1%.
Second Estimate of 2nd Quarter 2022 GDP Released 8/25/2022 – Real Gross Domestic Product (GDP) decreased at an annual rate of 0.6% in the second quarter of 2022, according to the second estimate released by the Bureau of Economic Analysis. GDP decreased 1.6% in the first quarter of 2022. Two quarters of negative GDP growth marks a technical recession. The GDP estimate released today is based on source data that are more complete than that of the advance estimate which saw real GDP decline 0.9% in the second quarter of 2022. The decrease in GDP reflected decreases in private inventory investment, residential fixed investment, federal government spending, state and local government spending, and nonresidential fixed investment that were partly offset by increases in exports and Personal Consumption Expenditures (PCE). Imports, which are a subtraction in the calculation of GDP, increased. The update primarily reflects upward revisions to consumer spending and private inventory investment that were partly offset by a downward revision to residential fixed investment.
Durable Goods Released 8/24/2022 – New orders for manufactured durable goods in July decreased less than $0.1 billion to $273.5 billion. Transportation equipment led the decrease down $0.6 billion or 0.7% to $93 billion.
New Residential Sales Released 8/23/2022 – Sales of new single-family homes decreased 12.6% to 511k, seasonally adjusted, in July. The median sales price of new homes sold in July was $439,400 with an average sales price of $546,800. At the end of July, the seasonally adjusted estimate of new homes for sale was 464k. This represents a supply of 10.9 months at the current sales rate.
Existing Home Sales – Released 8/18/2022 – Existing home sales decreased in July marking six-consecutive months of declines. Sales declined 5.9% to a seasonally adjusted rate of 4.81 million in JUly. Sales decreased 20.2% year-over-year. Housing inventory sits at 1.31 million units, up 4.8% from June’s inventory and up 2.4% over last year. Unsold inventory sits at a 3.3-month supply. The median existing home price for all housing types was $403,800, which is up 10.8% from July 2021. This marks 125 consecutive months of year-over-year increased, the longest-running streak on record.
Housing Starts – Released 8/16/2022 – New home starts in July were at a seasonally adjusted annual rate of 1.446 million; down 9.6% below June, and 8.1% below last July’s rate. Building permits were at a seasonally adjusted annual rate of 1.674 million; down 1.3% compared to June, but up 1.1% over last year.
Next week we get data on Housing Starts and Existing Home Sales.
Data Sources:
Bureau of Economic Analysis (BEA)
Congressional Budget Office (CBO)
U.S. Bureau of Labor Statistics (BLS)
Federal Reserve Economic Data (FRED Charts)
CME Fed Watch
U.S. Treasury – Yields
U.S. Census Bureau
Institute for Supply Management (ISM)
Weekly DOL Employment Data
BLS Monthly Jobs Report
JOLTS
US Energy Admin (EIA)
BLS Consumer Price Index CPI
BLS Producer Price Index PPI
Atlanta Fed GDPNOW
NY Fed Nowcast GDP
US Census Bureau Housing Starts
Consumer Credit
USCB Retail Sales
Construction Spending
Federal Reserve Dot Plots
NY Empire Index
Philadelphia Federal Reserve
P/E Ratio Data -Yardeni Research
Technical Analysis Info:
StockCharts.com – Financial Charts
Exponential vs Simple moving average
Other Links:
1973 Arab Oil Embargo
Hunt Brothers Silver
Long-Term Capital bailout
Categories:
Tags: