Good Life Advisors – Talking Points – Week 38
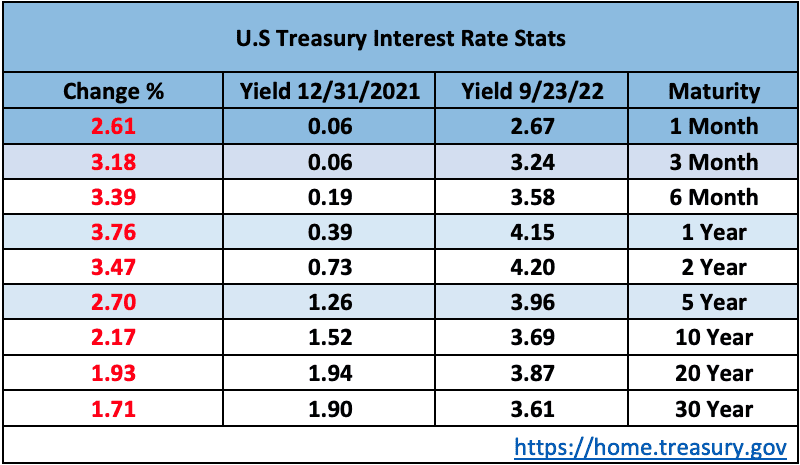
We’re officially in a bear market again. The Federal Reserve raised rates another 3/4% this week and both the bond market and stock market are not taking it so well. With bond prices still falling there is one minor bright spot and that interest rates are normalizing. In the last year they’ve moved dramatically:
From a Valuation perspective P/E ratios have come down dramatically from their highs but are not near GFC lows.

US real yields hit the highest levels since 2011, which some strategists expect to further weigh in on equity multiples, particularly in very expensive and unprofitable segments. Morgan Stanley’s Michael Wilson continued to warn that consensus estimates are too high in the face of demand destruction and margin pressure. Goldman Sachs strategists also cut their 2022 S&P price target to 3600, saying elevated recession odds add risk to corporate earnings, while also highlighting the risk between the recent dislocation between real yields and the S&P forward P/E multiple.
Nothing positive to report this week. The markets sell off was driven by the Fed projected policy path adding support to its “raise and hold” mantra, a subsequent big backup in yields, and rising recessionary fears. We saw 2Y Treasury yields rise above 4.25% to the highest levels since 2007 this week, while the 10Y yield rose above 3.8% for the first time since 2010. The 2Y/10Y spread of around -50bp was also the most negative since 1982. While the Fed raised rates by 75bp on Wednesday, as widely expected, dot plot takeaways leaned hawkish with the median rate at 4.4% to end 2022, implying another 125bp of rate hikes over the final two meetings of the year, and a 4.6% terminal rate in 2023. Fed Chair Powell’s comments also leaned hawkish, saying the dot plot was likely and a plausible path, while Powell also said that the chances of a soft landing are likely to diminish.
Higher rates and tightening financial conditions drove a further deterioration in sentiment. Bank of America’s Bull & BEar indicator fell back down to zero, with the team’s analysts saying investor sentiment is “unquestionably” the worst in the GFC. Bulls in latest AAII Investor Sentiment Survey fell to 17.7% in the week-ended 21-Sep from 26.1% in the prior week. This week’s report marked the biggest sequential decline since early June, the lowest level since late April and the 44th consecutive week below the 38% historical average. The weakest sentiment in years was about the only bullish narrative this week (if you can call that bullish). JPMorgan’s Marko Kolanovic this week suggested sentiment and positioning may be at its nadir, noting signs that revisions may be bottoming, while retail and institutional positioning remains very low, and longer-term inflation expectations continue to fall. JPMorgan also said household equity allocations fell back to 2018 levels, more than reversing post-pandemic increases, which they say limits any equity market downside from here.
It was a busy week for geopolitical headlines, though from a market perspective geopolitics and China were somewhat on the backburner. Russian President Putin authorized a “partial mobilization” of reservists to fight in Ukraine and hinted that Russia could use nuclear weapons if its “territorial integrity” is threatened. China Covid headlines were also better with full reopening of the city of Chengdu on Monday, though there are still questions about the country’s recovery. Goldman Sachs this week cut its 2023 GDP forecast for China by 0.8 pp to 4.5%, citing weakness driven by Covid Zero policies being maintained at least through Q1.
Fixed Income
Yield Curve
The 10Y minus 2Y spread hit a negative 51 bps – the most inverted since 1981.
September FOMC Statement July Fed Minutes Balance Sheet Reduction Plan Credit, Liquidity and Balance Sheet Federal Reserve Dot Plots
Treasury.gov yields FOMC Policy Normalization Statement Longer- Run Goals Jan 2022
Foreign Exchange Market
The dollar also remains a growing headwind, with the dollar index hitting the highest level since June-2002 this week. Dollar strength was propelled by factors including a more hawkish Fed than expected and global growth concerns. The rally also came despite a BoJ intervention to keep the yen from weakening further against the dollar (FT). Sterling weakness was the other big FX this week, falling to the lowest level against the dollar since 1985 on worries that tax cuts and energy subsidies would put the UK on an unstable fiscal path (FT). A number of analysts warned the cycle of Fed hikes and stronger dollar may be pushing global currency markets toward the verge of breaking, adding to global recession fears. As the US dollar surges, American buyers splurge on European homes – So says the WSJ.
Energy Complex
Baker Hughes rig count increased by 1 this week. There are 764 oil and gas rigs operating in the US – Up 243 over last year.
Metals Complex
Employment Picture
Weekly Unemployment Claims – Released Thursday 9/22/2022 – The week ending September 17th observed an increase of 5k in initial claims increasing to 213k. The four-week moving average of initial jobless claims decreased 6k to 216.75k.
August Jobs Report – BLS Summary Released 9/2/2022 – The US Economy added 315k nonfarm jobs in August and the Unemployment rate stayed increased to 3.7%. Average hourly earnings increased 10 to $32.36. Hiring highlights include +68k Education and Health Services, +68k Professional and Business Services, and +44k Retail Trade.
- Average hourly earnings increased 10 cents to $32.26.
- U3 unemployment rate remained increased 0.2% to 3.7%. U6 unemployment rate increased 0.3% to 7%.
- The labor force participation rate was increased 0.3% to 62.4%.
- Average work week decreased 0.1 to 34.5 hours.
Job Openings & Labor Turnover Survey JOLTS – Released 8/30/2022 – The US Bureau of Labor Statistics reported the number and rate of job openings was little changed at 11.2 million on the last business day of JUly. Over the month, hires were little changed at 5.4 million and separations were little changed at 5.9 million. Within separations, quits were little changed at 4.2 million. The layoffs and discharges rates was little changed at 1.4 million.
Employment Cost Index – Released 7/29/2022 – Compensation costs for civilian workers increased 1.3% for the 3-month period ending in June 2022. The 12-month period ending in June 2022 saw compensation costs increase by 5.1%. The 12-month period ending June 2021 increased 2.9%. Wages and salaries increased 5.3% over the year and increased 3.2% for the 12-month period ending in June 2021. Benefit costs increased 4.8% over the year and increased 2.2% for the 12-month period ending in June 2021. This report is published quarterly.
This Week’s Economic Data
Links take you to the data source
Existing Home Sales – Released 9/21/2022 – Existing home sales decreased slightly in August marking seven consecutive months of declines. Sales declined 0.4% to a seasonally adjusted rate of 4.8 million in August. Sales decreased 19.9% year-over-year. Housing inventory sits at 1.28 million units. Down 1.5% from July’s inventory, unchanged over last year. Unsold inventory sits at a 3.2-month supply. The median existing home price for all housing types was $385,500, which is up 7.7% from August 2021. This marks 126 consecutive months of year-over-year increases, the longest-running streak on record.
Housing Starts – Released 9/20/2022 – New home starts in August were at a seasonally adjusted annual rate of 1.575 million; up 12.2% above July, but 0.1% below last August’s raate. Building Permits were at a seasonally adjusted annual rate of 1.517 million, down 10% compared to July, and down 14.4% over last year.
Recent Economic Data
Links take you to the data source
Retail Sales – Released 9/15/2022 – US retail sales for August increased 0.3% to $683.3 billion and retail sales are 9.1% above August 2021. US retail sales for the June 2022 through August 2022 period were up 9.3% from the same period a year ago.
Industrial Production and Capacity Utilization – Released 9/15/2022 – In August, Industrial production decreased 0.2%. Manufacturing increased 0.1%.Utilities output decreased 2.3%. Mining output was unchanged. Total industrial production was 3.7% higher in August than a year ago. Total capacity utilization decreased 0.2% in August to 80% which is 0.4% above its long run average.
Producer Price Index – Released 9/14/2022 – The Producer Price Index for final demand decreased 0.1% in August. PPI less food and energy increased 0.2%. The change in PPI for final demand has increased 8.7% year/y.
Consumer Price Index – Released 9/13/2022– Consumer prices increased 0.1% m/m in August following no change in July. Consumer prices are up 8.3% for the 12-month period ending in August. Core consumer prices increased 0.6% m/m in August.
Consumer Credit – Released 9/8/2022 – Consumer credit increased at a seasonally adjusted annual rate of 6.2% in July 2022. Revolving credit increased at an annual rate of 11.6%, while nonrevolving credit increased at an annual rate of 4.4%.
U.S. Trade Balance – Released 9/7/2022 – According to the US Census Bureau of Economic Analysis, the goods and services deficit decreased in July by $10.2 billion to $70.6 billion. July exports were $259.3 billion, $0.5 billion more than June exports. July imports were $329.9 billion, $9.7 billion less than June imports. YEar to date, the goods and services deficit increased $136.6 billion, or 29%, from the same period in 2021. Exports increased $286.4 billion or 19.9%. Imports increased $423 billion or 22.1%.
PMI Non-Manufacturing Index – Released 9/6/2022 – Economic activity in the non-manufacturing sector grew in August for the 27th consecutive month. ISM Non-Manufacturing registered 56.9%, which is 0.2 percentage points above the July reading of 56.7%.
PMI Manufacturing Index – Released 9/1/2022 – August PMI was unchanged at 52.8%. The New Orders Index was 51.3%, up 3.3% from July’s reading of 48%. The Production Index registered 50.4%, down 3.1%.
U.S. Construction Spending – Released 9/1/2022 – Construction spending decreased 0.4% in July, measuring at a seasonally adjusted annual rate of $1,777.3 billion. The July figure is 8.5% above the July 2021 estimate. Private construction spending declined 0.8% from the revised June estimate at $1,436.4 billion. Public constructions pending was 1.5% above the revised June estimate at $353.1 billion.
Chicago PMI – Released 8/31/2022 – Chicago PMI was relatively unchanged in August at 52.20.
Consumer Confidence – Released 8/30/2022 – The Consumer Confidence Index increased in August following three consecutive months of decline. The Index now stands at 103.2, up from 95.3 in July.
US Light Vehicle Sales – Released 8/26/2022 – US light vehicle sales were at a seasonally adjusted annual rate of 13.333 million units in July.
Personal Income – Released 8/26/2022 – Personal income increased $47 billion, or 0.2% in July, according to estimates released today by the Bureau of Economic Analysis. Disposable Personal Income (DPI) increased $27.6 billion or 0.2% and Personal Consumption Expenditures (PCE) increased $23.7 billion or 0.1%.
Second Estimate of 2nd Quarter 2022 GDP – Released 8/25/2022 – Real Gross Domestic Product (GDP) decreased at an annual rate of 0.6% in the second quarter of 2022, according to the second estimate released by the Bureau of Economic Analysis. GDP decreased 1.6% in the first quarter of 2022. Two quarters of negative GDP growth marks a technical recession. The GDP estimate released today is based on source data that are more complete than that of the advance estimate which saw real GDP decline 0.9% in the second quarter of 2022. the decrease in real GDP reflected decreases in private inventory investment, residential fixed investment, federal government spending, state and local government spending, and nonresidential fixed investment that were partly offset by increases in exports and Personal Consumption Expenditures (PCE). Imports, which are a subtraction in the calculation of GDP, increased. The update primarily reflects upward revisions to consumer spending and private inventory investment that were partly offset by a downward revision to residential fixed investment.
Durable Goods – Released 8/24/2022 – New orders for manufactured durable goods in July decreased less than $0.1 billion to $273.5 billion. Transportation equipment led the decrease down $0.6 billion or 0.7% to $93 billion.
New Residential Sales – Released 8/23/2022 – Sales of new single-family homes decreased 12.6% to 511k, seasonally adjusted, in July. The median sales price of new homes sold in July was $439,400 with an average sales price of $546,800. At the end of July, the seasonally adjusted estimate of new homes for sale was 464k. This represents a supply of 10.9 months at the current sales rate.
Next week we get data on New Residential Sales, Durable Goods, the 3rd Estimate of 2nd Quarter GDP, Personal Income, Consumer Confidence, and Chicago PMI.
Data Sources:
Bureau of Economic Analysis (BEA)
Congressional Budget Office (CBO)
U.S. Bureau of Labor Statistics (BLS)
Federal Reserve Economic Data (FRED Charts)
CME Fed Watch
U.S. Treasury – Yields
U.S. Census Bureau
Institute for Supply Management (ISM)
Weekly DOL Employment Data
BLS Monthly Jobs Report
JOLTS
US Energy Admin (EIA)
BLS Consumer Price Index CPI
BLS Producer Price Index PPI
Atlanta Fed GDPNOW
NY Fed Nowcast GDP
US Census Bureau Housing Starts
Consumer Credit
USCB Retail Sales
Construction Spending
Federal Reserve Dot Plots
NY Empire Index
Philadelphia Federal Reserve
P/E Ratio Data -Yardeni Research
Technical Analysis Info:
StockCharts.com – Financial Charts
Exponential vs Simple moving average
Other Links:
1973 Arab Oil Embargo
Hunt Brothers Silver
Long-Term Capital bailout


Week 38 Talking Points
Table of Contents
Good Life Advisors – Talking Points – Week 38
We’re officially in a bear market again. The Federal Reserve raised rates another 3/4% this week and both the bond market and stock market are not taking it so well. With bond prices still falling there is one minor bright spot and that interest rates are normalizing. In the last year they’ve moved dramatically:
From a Valuation perspective P/E ratios have come down dramatically from their highs but are not near GFC lows.
US real yields hit the highest levels since 2011, which some strategists expect to further weigh in on equity multiples, particularly in very expensive and unprofitable segments. Morgan Stanley’s Michael Wilson continued to warn that consensus estimates are too high in the face of demand destruction and margin pressure. Goldman Sachs strategists also cut their 2022 S&P price target to 3600, saying elevated recession odds add risk to corporate earnings, while also highlighting the risk between the recent dislocation between real yields and the S&P forward P/E multiple.
Nothing positive to report this week. The markets sell off was driven by the Fed projected policy path adding support to its “raise and hold” mantra, a subsequent big backup in yields, and rising recessionary fears. We saw 2Y Treasury yields rise above 4.25% to the highest levels since 2007 this week, while the 10Y yield rose above 3.8% for the first time since 2010. The 2Y/10Y spread of around -50bp was also the most negative since 1982. While the Fed raised rates by 75bp on Wednesday, as widely expected, dot plot takeaways leaned hawkish with the median rate at 4.4% to end 2022, implying another 125bp of rate hikes over the final two meetings of the year, and a 4.6% terminal rate in 2023. Fed Chair Powell’s comments also leaned hawkish, saying the dot plot was likely and a plausible path, while Powell also said that the chances of a soft landing are likely to diminish.
Higher rates and tightening financial conditions drove a further deterioration in sentiment. Bank of America’s Bull & BEar indicator fell back down to zero, with the team’s analysts saying investor sentiment is “unquestionably” the worst in the GFC. Bulls in latest AAII Investor Sentiment Survey fell to 17.7% in the week-ended 21-Sep from 26.1% in the prior week. This week’s report marked the biggest sequential decline since early June, the lowest level since late April and the 44th consecutive week below the 38% historical average. The weakest sentiment in years was about the only bullish narrative this week (if you can call that bullish). JPMorgan’s Marko Kolanovic this week suggested sentiment and positioning may be at its nadir, noting signs that revisions may be bottoming, while retail and institutional positioning remains very low, and longer-term inflation expectations continue to fall. JPMorgan also said household equity allocations fell back to 2018 levels, more than reversing post-pandemic increases, which they say limits any equity market downside from here.
It was a busy week for geopolitical headlines, though from a market perspective geopolitics and China were somewhat on the backburner. Russian President Putin authorized a “partial mobilization” of reservists to fight in Ukraine and hinted that Russia could use nuclear weapons if its “territorial integrity” is threatened. China Covid headlines were also better with full reopening of the city of Chengdu on Monday, though there are still questions about the country’s recovery. Goldman Sachs this week cut its 2023 GDP forecast for China by 0.8 pp to 4.5%, citing weakness driven by Covid Zero policies being maintained at least through Q1.
Fixed Income
Yield Curve
The 10Y minus 2Y spread hit a negative 51 bps – the most inverted since 1981.
September FOMC Statement July Fed Minutes Balance Sheet Reduction Plan Credit, Liquidity and Balance Sheet Federal Reserve Dot Plots
Treasury.gov yields FOMC Policy Normalization Statement Longer- Run Goals Jan 2022
Foreign Exchange Market
The dollar also remains a growing headwind, with the dollar index hitting the highest level since June-2002 this week. Dollar strength was propelled by factors including a more hawkish Fed than expected and global growth concerns. The rally also came despite a BoJ intervention to keep the yen from weakening further against the dollar (FT). Sterling weakness was the other big FX this week, falling to the lowest level against the dollar since 1985 on worries that tax cuts and energy subsidies would put the UK on an unstable fiscal path (FT). A number of analysts warned the cycle of Fed hikes and stronger dollar may be pushing global currency markets toward the verge of breaking, adding to global recession fears. As the US dollar surges, American buyers splurge on European homes – So says the WSJ.
Energy Complex
Baker Hughes rig count increased by 1 this week. There are 764 oil and gas rigs operating in the US – Up 243 over last year.
Metals Complex
Employment Picture
Weekly Unemployment Claims – Released Thursday 9/22/2022 – The week ending September 17th observed an increase of 5k in initial claims increasing to 213k. The four-week moving average of initial jobless claims decreased 6k to 216.75k.
August Jobs Report – BLS Summary Released 9/2/2022 – The US Economy added 315k nonfarm jobs in August and the Unemployment rate stayed increased to 3.7%. Average hourly earnings increased 10 to $32.36. Hiring highlights include +68k Education and Health Services, +68k Professional and Business Services, and +44k Retail Trade.
Job Openings & Labor Turnover Survey JOLTS – Released 8/30/2022 – The US Bureau of Labor Statistics reported the number and rate of job openings was little changed at 11.2 million on the last business day of JUly. Over the month, hires were little changed at 5.4 million and separations were little changed at 5.9 million. Within separations, quits were little changed at 4.2 million. The layoffs and discharges rates was little changed at 1.4 million.
Employment Cost Index – Released 7/29/2022 – Compensation costs for civilian workers increased 1.3% for the 3-month period ending in June 2022. The 12-month period ending in June 2022 saw compensation costs increase by 5.1%. The 12-month period ending June 2021 increased 2.9%. Wages and salaries increased 5.3% over the year and increased 3.2% for the 12-month period ending in June 2021. Benefit costs increased 4.8% over the year and increased 2.2% for the 12-month period ending in June 2021. This report is published quarterly.
This Week’s Economic Data
Links take you to the data source
Existing Home Sales – Released 9/21/2022 – Existing home sales decreased slightly in August marking seven consecutive months of declines. Sales declined 0.4% to a seasonally adjusted rate of 4.8 million in August. Sales decreased 19.9% year-over-year. Housing inventory sits at 1.28 million units. Down 1.5% from July’s inventory, unchanged over last year. Unsold inventory sits at a 3.2-month supply. The median existing home price for all housing types was $385,500, which is up 7.7% from August 2021. This marks 126 consecutive months of year-over-year increases, the longest-running streak on record.
Housing Starts – Released 9/20/2022 – New home starts in August were at a seasonally adjusted annual rate of 1.575 million; up 12.2% above July, but 0.1% below last August’s raate. Building Permits were at a seasonally adjusted annual rate of 1.517 million, down 10% compared to July, and down 14.4% over last year.
Recent Economic Data
Links take you to the data source
Retail Sales – Released 9/15/2022 – US retail sales for August increased 0.3% to $683.3 billion and retail sales are 9.1% above August 2021. US retail sales for the June 2022 through August 2022 period were up 9.3% from the same period a year ago.
Industrial Production and Capacity Utilization – Released 9/15/2022 – In August, Industrial production decreased 0.2%. Manufacturing increased 0.1%.Utilities output decreased 2.3%. Mining output was unchanged. Total industrial production was 3.7% higher in August than a year ago. Total capacity utilization decreased 0.2% in August to 80% which is 0.4% above its long run average.
Producer Price Index – Released 9/14/2022 – The Producer Price Index for final demand decreased 0.1% in August. PPI less food and energy increased 0.2%. The change in PPI for final demand has increased 8.7% year/y.
Consumer Price Index – Released 9/13/2022– Consumer prices increased 0.1% m/m in August following no change in July. Consumer prices are up 8.3% for the 12-month period ending in August. Core consumer prices increased 0.6% m/m in August.
Consumer Credit – Released 9/8/2022 – Consumer credit increased at a seasonally adjusted annual rate of 6.2% in July 2022. Revolving credit increased at an annual rate of 11.6%, while nonrevolving credit increased at an annual rate of 4.4%.
U.S. Trade Balance – Released 9/7/2022 – According to the US Census Bureau of Economic Analysis, the goods and services deficit decreased in July by $10.2 billion to $70.6 billion. July exports were $259.3 billion, $0.5 billion more than June exports. July imports were $329.9 billion, $9.7 billion less than June imports. YEar to date, the goods and services deficit increased $136.6 billion, or 29%, from the same period in 2021. Exports increased $286.4 billion or 19.9%. Imports increased $423 billion or 22.1%.
PMI Non-Manufacturing Index – Released 9/6/2022 – Economic activity in the non-manufacturing sector grew in August for the 27th consecutive month. ISM Non-Manufacturing registered 56.9%, which is 0.2 percentage points above the July reading of 56.7%.
PMI Manufacturing Index – Released 9/1/2022 – August PMI was unchanged at 52.8%. The New Orders Index was 51.3%, up 3.3% from July’s reading of 48%. The Production Index registered 50.4%, down 3.1%.
U.S. Construction Spending – Released 9/1/2022 – Construction spending decreased 0.4% in July, measuring at a seasonally adjusted annual rate of $1,777.3 billion. The July figure is 8.5% above the July 2021 estimate. Private construction spending declined 0.8% from the revised June estimate at $1,436.4 billion. Public constructions pending was 1.5% above the revised June estimate at $353.1 billion.
Chicago PMI – Released 8/31/2022 – Chicago PMI was relatively unchanged in August at 52.20.
Consumer Confidence – Released 8/30/2022 – The Consumer Confidence Index increased in August following three consecutive months of decline. The Index now stands at 103.2, up from 95.3 in July.
US Light Vehicle Sales – Released 8/26/2022 – US light vehicle sales were at a seasonally adjusted annual rate of 13.333 million units in July.
Personal Income – Released 8/26/2022 – Personal income increased $47 billion, or 0.2% in July, according to estimates released today by the Bureau of Economic Analysis. Disposable Personal Income (DPI) increased $27.6 billion or 0.2% and Personal Consumption Expenditures (PCE) increased $23.7 billion or 0.1%.
Second Estimate of 2nd Quarter 2022 GDP – Released 8/25/2022 – Real Gross Domestic Product (GDP) decreased at an annual rate of 0.6% in the second quarter of 2022, according to the second estimate released by the Bureau of Economic Analysis. GDP decreased 1.6% in the first quarter of 2022. Two quarters of negative GDP growth marks a technical recession. The GDP estimate released today is based on source data that are more complete than that of the advance estimate which saw real GDP decline 0.9% in the second quarter of 2022. the decrease in real GDP reflected decreases in private inventory investment, residential fixed investment, federal government spending, state and local government spending, and nonresidential fixed investment that were partly offset by increases in exports and Personal Consumption Expenditures (PCE). Imports, which are a subtraction in the calculation of GDP, increased. The update primarily reflects upward revisions to consumer spending and private inventory investment that were partly offset by a downward revision to residential fixed investment.
Durable Goods – Released 8/24/2022 – New orders for manufactured durable goods in July decreased less than $0.1 billion to $273.5 billion. Transportation equipment led the decrease down $0.6 billion or 0.7% to $93 billion.
New Residential Sales – Released 8/23/2022 – Sales of new single-family homes decreased 12.6% to 511k, seasonally adjusted, in July. The median sales price of new homes sold in July was $439,400 with an average sales price of $546,800. At the end of July, the seasonally adjusted estimate of new homes for sale was 464k. This represents a supply of 10.9 months at the current sales rate.
Next week we get data on New Residential Sales, Durable Goods, the 3rd Estimate of 2nd Quarter GDP, Personal Income, Consumer Confidence, and Chicago PMI.
Data Sources:
Bureau of Economic Analysis (BEA)
Congressional Budget Office (CBO)
U.S. Bureau of Labor Statistics (BLS)
Federal Reserve Economic Data (FRED Charts)
CME Fed Watch
U.S. Treasury – Yields
U.S. Census Bureau
Institute for Supply Management (ISM)
Weekly DOL Employment Data
BLS Monthly Jobs Report
JOLTS
US Energy Admin (EIA)
BLS Consumer Price Index CPI
BLS Producer Price Index PPI
Atlanta Fed GDPNOW
NY Fed Nowcast GDP
US Census Bureau Housing Starts
Consumer Credit
USCB Retail Sales
Construction Spending
Federal Reserve Dot Plots
NY Empire Index
Philadelphia Federal Reserve
P/E Ratio Data -Yardeni Research
Technical Analysis Info:
StockCharts.com – Financial Charts
Exponential vs Simple moving average
Other Links:
1973 Arab Oil Embargo
Hunt Brothers Silver
Long-Term Capital bailout
Categories:
Tags: